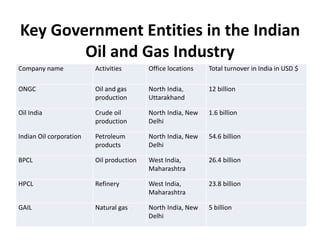
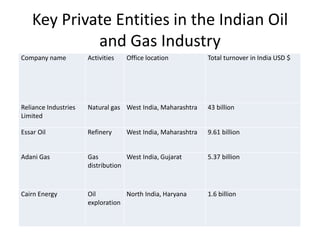
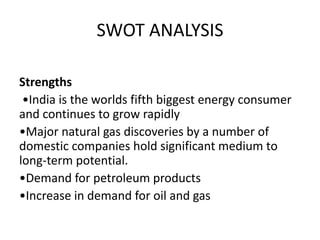
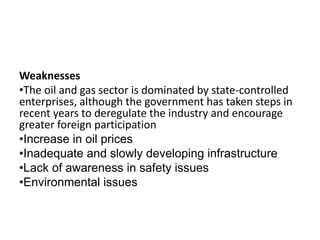
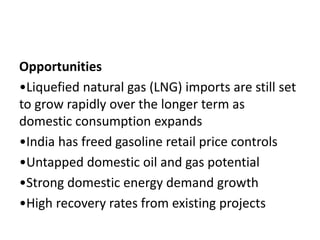
INDUSTRY ANALYSIS
PRESENTATION
BY
A.SARAVANAN
ORIGIN OF THE INDUSTRY
• The origin of the Indian oil & gas industry _19th century, when oil was
first struck at Digboi in Assam in 1889.
• Due to oil exploration the North-Eastern region Assam produced 5,000
barrels per day.
• In view of the significance of the oil & gas sector for overall economic
growth, the Government of India, under the Industrial Policy Resolution
of 1954, announced that petroleum would be the core sector industry.
• In pursuance of the Industrial Policy Resolution, 1954, petroleum
exploration & production activity was controlled by thegovernment-
owned National Oil Companies (NOCs), namely Oil & Natural Gas
Corporation (ONGC) and Oil India Private Ltd (OIL).
Oil Formation
Oil was formed from the remains of animal and
plants that live millions of years ago in a marine
environment before the dinosaurs.
Over the year ,the remains were covered by
layers of mud. Heat and pressure from these layers
helped the remains turn into what we today call
crude oil . The word “petroleum” means “rock oil” or
“oil from the earth”.
CAPACITY OF PETROL TANK
PETROLEUM PIPE LINE
Shares in crude pipeline network by
length
KEY PLAYERS
MARKET CAPITALISATION-BSE
Company Name Last Price % Chg
52 wk
High
52 wk
Low
Market Cap
(Rs. cr)
ONGC 386.00 0.49 472.00 269.20 330,241.92
GAIL 475.10 -0.74 551.35 328.60 60,265.36
Cairn India 266.35 1.91 385.00 258.30 49,935.82
Oil India 579.85 -0.32 668.80 439.00 34,856.87
Petronet LNG 189.75 1.44 208.70 102.50 14,231.25
Guj Gas 520.90 7.40 578.90 219.25 6,680.54
IGL 420.15 0.15 450.60 238.85 5,882.11
Guj State Petro 103.40 2.78 104.50 54.20 5,819.57
Aban Offshore 581.35 3.03 939.90 312.50 3,932.54
Selan Explore 410.50 -1.44 677.00 295.00 673.22
HOEC 48.15 -2.43 76.75 32.25 628.33
Jindal Drilling 210.10 1.38 302.75 172.40 608.89
Dolphin Offshor 233.90 10.23 233.90 66.10 392.31
Alphageo 527.00 6.19 647.05 39.75 296.95
Deep Industries 78.40 1.69 91.00 35.45 252.06
Sah Petroleums 44.70 17.02 44.70 7.23 227.90
Asian Oilfield 42.55 -0.35 75.45 24.30 94.99
Interlink Petro 18.50 -9.76 31.05 11.89 46.10
Shiv Vani Oil 9.53 -3.25 25.00 8.31 44.18
Duke Offshore 30.50 -4.39 62.10 11.43 15.03
Key Government Entities in the Indian
Oil and Gas Industry
Company name Activities Office locations Total turnover in India in USD $
ONGC Oil and gas
production
North India,
Uttarakhand
12 billion
Oil India Crude oil
production
North India, New
Delhi
1.6 billion
Indian Oil corporation Petroleum
products
North India, New
Delhi
54.6 billion
BPCL Oil production West India,
Maharashtra
26.4 billion
HPCL Refinery West India,
Maharashtra
23.8 billion
GAIL Natural gas North India, New
Delhi
5 billion
Key Private Entities in the Indian Oil
and Gas Industry
Company name Activities Office location Total turnover in India USD $
Reliance Industries
Limited
Natural gas West India, Maharashtra 43 billion
Essar Oil Refinery West India, Maharashtra 9.61 billion
Adani Gas Gas
distribution
West India, Gujarat 5.37 billion
Cairn Energy Oil
exploration
North India, Haryana 1.6 billion
MBA in oil&gas management
Indian Oil Institute of Petroleum Management
इंडियन ऑयल इंस्टिट्यूि ऑफ पेट्रोललयम मैनेजमेंि
Established 1995
Type Business School
Location Gurgaon, Haryana, India
Campus Urban, 30 acres (0.12 km2)
Website www.iocl.com
JOB OPPORTUNITIES IN OIL AND
GAS INDUSTRIES
SWOT ANALYSIS
Strengths
•India is the worlds fifth biggest energy consumer
and continues to grow rapidly
•Major natural gas discoveries by a number of
domestic companies hold significant medium to
long-term potential.
•Demand for petroleum products
•Increase in demand for oil and gas
Weaknesses
•The oil and gas sector is dominated by state-controlled
enterprises, although the government has taken steps in
recent years to deregulate the industry and encourage
greater foreign participation
•Increase in oil prices
•Inadequate and slowly developing infrastructure
•Lack of awareness in safety issues
•Environmental issues
Opportunities
•Liquefied natural gas (LNG) imports are still set
to grow rapidly over the longer term as
domestic consumption expands
•India has freed gasoline retail price controls
•Untapped domestic oil and gas potential
•Strong domestic energy demand growth
•High recovery rates from existing projects
Threats
• Highly flammable
•Increased competition within government and
private players
•Continuing government interference
•Changes in national energy policies
Bibliography
• http://economictimes.indiatimes.com/marketstat
s/pid-55,pageno-1,sortby-
CurrentYearRank,sortorder-asc,year-2014.cms
• https://www.dnb.co.in/IndiasEnergySector/GasI
ndustry.asp
• http://www.indianoilandgas.com/
• http://www.moneycontrol.com/stocks/marketinf
o/marketcap/bse/oil-drilling-and-
exploration.html
• http://www.moneycontrol.com/markets/gallery/
marketcap-1.html
• http://www.minglebox.com/mba/colleges/cat
egory/oil-and-gas-management
• http://www.htcampus.com/subcategory/oil-
gas-energy-management-colleges-in-india/
THANK YOU

Industrial Analysis Presentation Oil & Gas

  • 1.
  • 2.
    ORIGIN OF THEINDUSTRY • The origin of the Indian oil & gas industry _19th century, when oil was first struck at Digboi in Assam in 1889. • Due to oil exploration the North-Eastern region Assam produced 5,000 barrels per day. • In view of the significance of the oil & gas sector for overall economic growth, the Government of India, under the Industrial Policy Resolution of 1954, announced that petroleum would be the core sector industry. • In pursuance of the Industrial Policy Resolution, 1954, petroleum exploration & production activity was controlled by thegovernment- owned National Oil Companies (NOCs), namely Oil & Natural Gas Corporation (ONGC) and Oil India Private Ltd (OIL).
  • 3.
    Oil Formation Oil wasformed from the remains of animal and plants that live millions of years ago in a marine environment before the dinosaurs. Over the year ,the remains were covered by layers of mud. Heat and pressure from these layers helped the remains turn into what we today call crude oil . The word “petroleum” means “rock oil” or “oil from the earth”.
  • 8.
  • 9.
  • 10.
    Shares in crudepipeline network by length
  • 11.
  • 13.
    MARKET CAPITALISATION-BSE Company NameLast Price % Chg 52 wk High 52 wk Low Market Cap (Rs. cr) ONGC 386.00 0.49 472.00 269.20 330,241.92 GAIL 475.10 -0.74 551.35 328.60 60,265.36 Cairn India 266.35 1.91 385.00 258.30 49,935.82 Oil India 579.85 -0.32 668.80 439.00 34,856.87 Petronet LNG 189.75 1.44 208.70 102.50 14,231.25 Guj Gas 520.90 7.40 578.90 219.25 6,680.54 IGL 420.15 0.15 450.60 238.85 5,882.11 Guj State Petro 103.40 2.78 104.50 54.20 5,819.57 Aban Offshore 581.35 3.03 939.90 312.50 3,932.54 Selan Explore 410.50 -1.44 677.00 295.00 673.22 HOEC 48.15 -2.43 76.75 32.25 628.33 Jindal Drilling 210.10 1.38 302.75 172.40 608.89 Dolphin Offshor 233.90 10.23 233.90 66.10 392.31 Alphageo 527.00 6.19 647.05 39.75 296.95 Deep Industries 78.40 1.69 91.00 35.45 252.06 Sah Petroleums 44.70 17.02 44.70 7.23 227.90 Asian Oilfield 42.55 -0.35 75.45 24.30 94.99 Interlink Petro 18.50 -9.76 31.05 11.89 46.10 Shiv Vani Oil 9.53 -3.25 25.00 8.31 44.18 Duke Offshore 30.50 -4.39 62.10 11.43 15.03
  • 15.
    Key Government Entitiesin the Indian Oil and Gas Industry Company name Activities Office locations Total turnover in India in USD $ ONGC Oil and gas production North India, Uttarakhand 12 billion Oil India Crude oil production North India, New Delhi 1.6 billion Indian Oil corporation Petroleum products North India, New Delhi 54.6 billion BPCL Oil production West India, Maharashtra 26.4 billion HPCL Refinery West India, Maharashtra 23.8 billion GAIL Natural gas North India, New Delhi 5 billion
  • 16.
    Key Private Entitiesin the Indian Oil and Gas Industry Company name Activities Office location Total turnover in India USD $ Reliance Industries Limited Natural gas West India, Maharashtra 43 billion Essar Oil Refinery West India, Maharashtra 9.61 billion Adani Gas Gas distribution West India, Gujarat 5.37 billion Cairn Energy Oil exploration North India, Haryana 1.6 billion
  • 17.
    MBA in oil&gasmanagement
  • 18.
    Indian Oil Instituteof Petroleum Management इंडियन ऑयल इंस्टिट्यूि ऑफ पेट्रोललयम मैनेजमेंि Established 1995 Type Business School Location Gurgaon, Haryana, India Campus Urban, 30 acres (0.12 km2) Website www.iocl.com
  • 19.
    JOB OPPORTUNITIES INOIL AND GAS INDUSTRIES
  • 20.
    SWOT ANALYSIS Strengths •India isthe worlds fifth biggest energy consumer and continues to grow rapidly •Major natural gas discoveries by a number of domestic companies hold significant medium to long-term potential. •Demand for petroleum products •Increase in demand for oil and gas
  • 21.
    Weaknesses •The oil andgas sector is dominated by state-controlled enterprises, although the government has taken steps in recent years to deregulate the industry and encourage greater foreign participation •Increase in oil prices •Inadequate and slowly developing infrastructure •Lack of awareness in safety issues •Environmental issues
  • 22.
    Opportunities •Liquefied natural gas(LNG) imports are still set to grow rapidly over the longer term as domestic consumption expands •India has freed gasoline retail price controls •Untapped domestic oil and gas potential •Strong domestic energy demand growth •High recovery rates from existing projects
  • 23.
    Threats • Highly flammable •Increasedcompetition within government and private players •Continuing government interference •Changes in national energy policies
  • 24.
    Bibliography • http://economictimes.indiatimes.com/marketstat s/pid-55,pageno-1,sortby- CurrentYearRank,sortorder-asc,year-2014.cms • https://www.dnb.co.in/IndiasEnergySector/GasI ndustry.asp •http://www.indianoilandgas.com/ • http://www.moneycontrol.com/stocks/marketinf o/marketcap/bse/oil-drilling-and- exploration.html • http://www.moneycontrol.com/markets/gallery/ marketcap-1.html
  • 25.
  • 26.