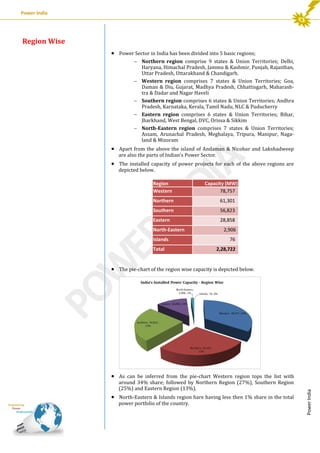
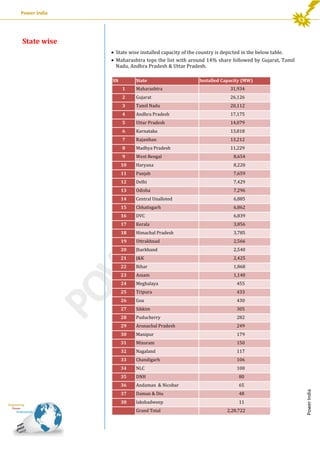
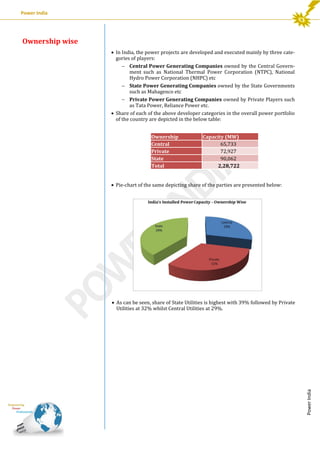
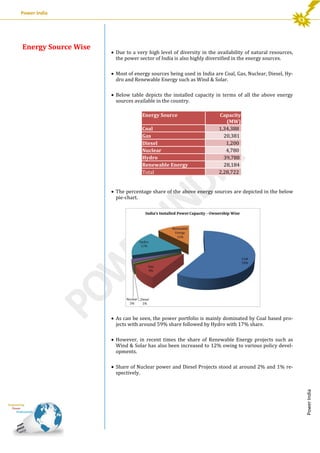
POWER INDIA

India’s Installed Power Capacity (September 2013)
Executive Summary
Analysis of Power Generating Capacity
Region wise
State wise
Ownership wise
Energy Sources wise

Summary

Connect with us
November 6, 2013
Power India

DISCLAIMER

Every effort is made to provide
correct and updated information.

POWER INDIA
www.powerind.in

Connect with us

However, POWER INDIA takes
no responsibility for content of
any of the material posted , and
will not be liable for, any reliance you place on information.
POWER INDIA is not herein engaged in rendering professional
advice and services to user of
this report.
POWER INDIA makes no warranties, expressed or implied, as
to the ownership, accuracy, or
adequacy of the content of this
report.
POWER INDIA shall not be liable for any indirect, incidental,
consequential, or punitive damages or for lost revenues or
profits, whether or not advised
of the possibility of such damages or losses and regardless of
the theory of liability.

POWER INDIA hereby grants
the user a personal, nonexclusive, nonrefundable, nontransferable license to use the
report for research purposes
only pursuant to the terms and
conditions of this agreement.
POWER INDIA retains exclusive
and sole ownership of each report disseminated under this
agreement.
The user cannot engage in any
unauthorized use, reproduction, distribution, publication
or electronic transmission of
this report or the information/
forecasts therein without the
express written permission of
POWER INDIA.
No part of this report may be
used or reproduced in any
manner or in any form or by
any means without mentioning
its original source.

For further enquiries, please
contact:
POWER INDIA
sparksnetwork@gmail.com
info@powerind.in

Power India

This document along with all
the Reports published by the
POWER INDIA are properties of
POWER INDIA.
Power India

India having the second highest population in the world has the world’s fifthlargest electricity generation capacity. However, still the per capita consumption of electricity is one of the lowest in the world and owing to the multifold
increase in the industrialization and other aspects of the economy the demand
of power is expected to surge in the coming years.

Due to these reasons, the power sector is high on priority for both the Government & Private bodies as it offers tremendous potential for investing companies based on the sheer size of the market and the returns available on investment capital.

The Indian power sector is one of the most diversified sectors in the world.
Power in India is generated from commercial sources like coal, lignite, natural
gas, oil, hydro and nuclear power as well as other viable non-conventional
sources like wind, solar, agriculture and domestic waste.

The demand for electricity in the country has been growing at a rapid rate and
is expected to increase further in the years to come. In order to meet the increasing requirement of electricity, massive addition to the installed generating capacity in the country is required.

In this report, country’s total installed capacity as on the month ending of September 2013 has been analyzed and depicted in the tabular as well as graphical formats.

Power India

Executive Summary
Power India

Region Wise
 Power Sector in India has been divided into 5 basic regions;
 Northern region comprise 9 states & Union Territories; Delhi,
Haryana, Himachal Pradesh, Jammu & Kashmir, Punjab, Rajasthan,
Uttar Pradesh, Uttarakhand & Chandigarh.
 Western region comprises 7 states & Union Territories; Goa,
Daman & Diu, Gujarat, Madhya Pradesh, Chhattisgarh, Maharashtra & Dadar and Nagar Haveli
 Southern region comprises 6 states & Union Territories; Andhra
Pradesh, Karnataka, Kerala, Tamil Nadu, NLC & Puducherry
 Eastern region comprises 6 states & Union Territories; Bihar,
Jharkhand, West Bengal, DVC, Orissa & Sikkim
 North-Eastern region comprises 7 states & Union Territories;
Assam, Arunachal Pradesh, Meghalaya, Tripura, Manipur, Nagaland & Mizoram

 Apart from the above the island of Andaman & Nicobar and Lakshadweep
are also the parts of Indian’s Power Sector.

 The installed capacity of power projects for each of the above regions are
depicted below.

Region
Western

Capacity (MW)
78,757

Northern

61,301

Southern

56,823

Eastern

28,858

North-Eastern
Islands
Total

2,906
76
2,28,722

 The pie-chart of the region wise capacity is depicted below.

around 34% share; followed by Northern Region (27%), Southern Region
(25%) and Eastern Region (13%).

 North-Eastern & Islands region hare having less then 1% share in the total
power portfolio of the country.

Power India

 As can be inferred from the pie-chart Western region tops the list with
Power India

State wise
 State wise installed capacity of the country is depicted in the below table.
 Maharashtra tops the list with around 14% share followed by Gujarat, Tamil
Nadu, Andhra Pradesh & Uttar Pradesh.
SN

State

Installed Capacity (MW)

Maharashtra

31,934

2

Gujarat

26,126

3

Tamil Nadu

20,112

4

Andhra Pradesh

17,175

5

Uttar Pradesh

14,079

6

Karnataka

13,818

7

Rajasthan

13,212

8

Madhya Pradesh

11,229

9

West Bengal

8,654

10

Haryana

8,220

11

Punjab

7,659

12

Delhi

7,429

13

Odisha

7,296

14

Central Unalloted

6,885

15

Chhatisgarh

6,862

16

DVC

6,839

17

Kerala

3,856

18

Himachal Pradesh

3,785

19

Uttrakhnad

2,566

20

Jharkhand

2,540

21

J&K

2,425

22

Bihar

1,868

23

Assam

1,140

24

Meghalaya

455

25

Tripura

433

26

Goa

430

27

Sikkim

305

28

Puducherry

282

29

Arunachal Pradesh

249

30

Manipur

179

31

Mizoram

150

32

Nagaland

117

33

Chandigarh

106

34

NLC

100

35

DNH

80

36

Andaman & Nicobar

65

37

Daman & Diu

48

38

lakshadweep

11

Grand Total

2,28,722

Power India

1
Power India

Ownership wise
 In India, the power projects are developed and executed mainly by three categories of players:
 Central Power Generating Companies owned by the Central Government such as National Thermal Power Corporation (NTPC), National
Hydro Power Corporation (NHPC) etc
 State Power Generating Companies owned by the State Governments
such as Mahagenco etc
 Private Power Generating Companies owned by Private Players such
as Tata Power, Reliance Power etc.
 Share of each of the above developer categories in the overall power portfolio
of the country are depicted in the below table:
Ownership
Central
Private
State
Total

Capacity (MW)
65,733
72,927
90,062
2,28,722

 Pie-chart of the same depicting share of the parties are presented below:

Power India

 As can be seen, share of State Utilities is highest with 39% followed by Private
Utilities at 32% whilst Central Utilities at 29%.
Power India

 Due to a very high level of diversity in the availability of natural resources,
the power sector of India is also highly diversified in the energy sources.
 Most of energy sources being used in India are Coal, Gas, Nuclear, Diesel, Hydro and Renewable Energy such as Wind & Solar.
 Below table depicts the installed capacity in terms of all the above energy
sources available in the country.
Energy Source
Coal
Gas
Diesel
Nuclear
Hydro
Renewable Energy
Total

Capacity
(MW)
1,34,388
20,381
1,200
4,780
39,788
28,184
2,28,722

 The percentage share of the above energy sources are depicted in the below
pie-chart.

 As can be seen, the power portfolio is mainly dominated by Coal based projects with around 59% share followed by Hydro with 17% share.
 However, in recent times the share of Renewable Energy projects such as
Wind & Solar has also been increased to 12% owing to various policy developments.
 Share of Nuclear power and Diesel Projects stood at around 2% and 1% respectively.

Power India

Energy Source Wise
Power India

 India’s total power generation capacity stood at around 228.72 GW.
 Out of the 5 regions (and Islands), Western region tops the list with
around 34% share; followed by Northern Region (27%), Southern Region
(25%) and Eastern Region (13%).
 The top 5 power generating states are Maharashtra (31.9 GW), Gujarat
(26.13 GW), Tamil Nadu (20.11 GW), Andhra Pradesh (17.18 Gw) and Uttar Pradesh (14.08 GW).
 Share of State Generating Utilities is highest with 39% followed by Private
Generating Utilities at 32% and Central Generating Utilities at 29%.
 Countries power portfolio mainly dominated by Coal based projects with
around 59% share followed by Hydro with 17%, Renewable Energy projects with 12%, Nuclear power with 2% and Diesel Projects with 1%.

Power India

Summary
Power India

POWER INDIA
Power, in the present edge, is the life blood for each & every economy around
the globe. It is an essential requirement for all facets of our life and has been
recognized as a basic human need. Socio-economic development of any country
depends upon development of this critical infrastructure.
Indian Power sector has been in the fore front of Indian growth story. With
huge captive coal reserves, significant potential for generation of power from
renewable energy sources, and a highly investor friendly Government policy
for setting-up green-field Power projects, Indian Power sector is abreast with
untapped opportunities. The growth of the economy and its global competitiveness hinges on the availability of reliable and quality power at competitive
rates.
POWER INDIA is putting an effort to bolster the sturdy growth of Indian Power
Sector by providing comprehensive supports in terms of latest happenings,
analysis, publications, links and other resources related to the Indian and Global Power Sector to the Power Professionals.

Power India

SERVICES
OFFERED

India's Power Generating Capacity - September 2013

  • 1.
    POWER INDIA India’s InstalledPower Capacity (September 2013) Executive Summary Analysis of Power Generating Capacity Region wise State wise Ownership wise Energy Sources wise Summary Connect with us November 6, 2013
  • 2.
    Power India DISCLAIMER Every effortis made to provide correct and updated information. POWER INDIA www.powerind.in Connect with us However, POWER INDIA takes no responsibility for content of any of the material posted , and will not be liable for, any reliance you place on information. POWER INDIA is not herein engaged in rendering professional advice and services to user of this report. POWER INDIA makes no warranties, expressed or implied, as to the ownership, accuracy, or adequacy of the content of this report. POWER INDIA shall not be liable for any indirect, incidental, consequential, or punitive damages or for lost revenues or profits, whether or not advised of the possibility of such damages or losses and regardless of the theory of liability. POWER INDIA hereby grants the user a personal, nonexclusive, nonrefundable, nontransferable license to use the report for research purposes only pursuant to the terms and conditions of this agreement. POWER INDIA retains exclusive and sole ownership of each report disseminated under this agreement. The user cannot engage in any unauthorized use, reproduction, distribution, publication or electronic transmission of this report or the information/ forecasts therein without the express written permission of POWER INDIA. No part of this report may be used or reproduced in any manner or in any form or by any means without mentioning its original source. For further enquiries, please contact: POWER INDIA sparksnetwork@gmail.com info@powerind.in Power India This document along with all the Reports published by the POWER INDIA are properties of POWER INDIA.
  • 3.
    Power India India havingthe second highest population in the world has the world’s fifthlargest electricity generation capacity. However, still the per capita consumption of electricity is one of the lowest in the world and owing to the multifold increase in the industrialization and other aspects of the economy the demand of power is expected to surge in the coming years. Due to these reasons, the power sector is high on priority for both the Government & Private bodies as it offers tremendous potential for investing companies based on the sheer size of the market and the returns available on investment capital. The Indian power sector is one of the most diversified sectors in the world. Power in India is generated from commercial sources like coal, lignite, natural gas, oil, hydro and nuclear power as well as other viable non-conventional sources like wind, solar, agriculture and domestic waste. The demand for electricity in the country has been growing at a rapid rate and is expected to increase further in the years to come. In order to meet the increasing requirement of electricity, massive addition to the installed generating capacity in the country is required. In this report, country’s total installed capacity as on the month ending of September 2013 has been analyzed and depicted in the tabular as well as graphical formats. Power India Executive Summary
  • 4.
    Power India Region Wise Power Sector in India has been divided into 5 basic regions;  Northern region comprise 9 states & Union Territories; Delhi, Haryana, Himachal Pradesh, Jammu & Kashmir, Punjab, Rajasthan, Uttar Pradesh, Uttarakhand & Chandigarh.  Western region comprises 7 states & Union Territories; Goa, Daman & Diu, Gujarat, Madhya Pradesh, Chhattisgarh, Maharashtra & Dadar and Nagar Haveli  Southern region comprises 6 states & Union Territories; Andhra Pradesh, Karnataka, Kerala, Tamil Nadu, NLC & Puducherry  Eastern region comprises 6 states & Union Territories; Bihar, Jharkhand, West Bengal, DVC, Orissa & Sikkim  North-Eastern region comprises 7 states & Union Territories; Assam, Arunachal Pradesh, Meghalaya, Tripura, Manipur, Nagaland & Mizoram  Apart from the above the island of Andaman & Nicobar and Lakshadweep are also the parts of Indian’s Power Sector.  The installed capacity of power projects for each of the above regions are depicted below. Region Western Capacity (MW) 78,757 Northern 61,301 Southern 56,823 Eastern 28,858 North-Eastern Islands Total 2,906 76 2,28,722  The pie-chart of the region wise capacity is depicted below. around 34% share; followed by Northern Region (27%), Southern Region (25%) and Eastern Region (13%).  North-Eastern & Islands region hare having less then 1% share in the total power portfolio of the country. Power India  As can be inferred from the pie-chart Western region tops the list with
  • 5.
    Power India State wise State wise installed capacity of the country is depicted in the below table.  Maharashtra tops the list with around 14% share followed by Gujarat, Tamil Nadu, Andhra Pradesh & Uttar Pradesh. SN State Installed Capacity (MW) Maharashtra 31,934 2 Gujarat 26,126 3 Tamil Nadu 20,112 4 Andhra Pradesh 17,175 5 Uttar Pradesh 14,079 6 Karnataka 13,818 7 Rajasthan 13,212 8 Madhya Pradesh 11,229 9 West Bengal 8,654 10 Haryana 8,220 11 Punjab 7,659 12 Delhi 7,429 13 Odisha 7,296 14 Central Unalloted 6,885 15 Chhatisgarh 6,862 16 DVC 6,839 17 Kerala 3,856 18 Himachal Pradesh 3,785 19 Uttrakhnad 2,566 20 Jharkhand 2,540 21 J&K 2,425 22 Bihar 1,868 23 Assam 1,140 24 Meghalaya 455 25 Tripura 433 26 Goa 430 27 Sikkim 305 28 Puducherry 282 29 Arunachal Pradesh 249 30 Manipur 179 31 Mizoram 150 32 Nagaland 117 33 Chandigarh 106 34 NLC 100 35 DNH 80 36 Andaman & Nicobar 65 37 Daman & Diu 48 38 lakshadweep 11 Grand Total 2,28,722 Power India 1
  • 6.
    Power India Ownership wise In India, the power projects are developed and executed mainly by three categories of players:  Central Power Generating Companies owned by the Central Government such as National Thermal Power Corporation (NTPC), National Hydro Power Corporation (NHPC) etc  State Power Generating Companies owned by the State Governments such as Mahagenco etc  Private Power Generating Companies owned by Private Players such as Tata Power, Reliance Power etc.  Share of each of the above developer categories in the overall power portfolio of the country are depicted in the below table: Ownership Central Private State Total Capacity (MW) 65,733 72,927 90,062 2,28,722  Pie-chart of the same depicting share of the parties are presented below: Power India  As can be seen, share of State Utilities is highest with 39% followed by Private Utilities at 32% whilst Central Utilities at 29%.
  • 7.
    Power India  Dueto a very high level of diversity in the availability of natural resources, the power sector of India is also highly diversified in the energy sources.  Most of energy sources being used in India are Coal, Gas, Nuclear, Diesel, Hydro and Renewable Energy such as Wind & Solar.  Below table depicts the installed capacity in terms of all the above energy sources available in the country. Energy Source Coal Gas Diesel Nuclear Hydro Renewable Energy Total Capacity (MW) 1,34,388 20,381 1,200 4,780 39,788 28,184 2,28,722  The percentage share of the above energy sources are depicted in the below pie-chart.  As can be seen, the power portfolio is mainly dominated by Coal based projects with around 59% share followed by Hydro with 17% share.  However, in recent times the share of Renewable Energy projects such as Wind & Solar has also been increased to 12% owing to various policy developments.  Share of Nuclear power and Diesel Projects stood at around 2% and 1% respectively. Power India Energy Source Wise
  • 8.
    Power India  India’stotal power generation capacity stood at around 228.72 GW.  Out of the 5 regions (and Islands), Western region tops the list with around 34% share; followed by Northern Region (27%), Southern Region (25%) and Eastern Region (13%).  The top 5 power generating states are Maharashtra (31.9 GW), Gujarat (26.13 GW), Tamil Nadu (20.11 GW), Andhra Pradesh (17.18 Gw) and Uttar Pradesh (14.08 GW).  Share of State Generating Utilities is highest with 39% followed by Private Generating Utilities at 32% and Central Generating Utilities at 29%.  Countries power portfolio mainly dominated by Coal based projects with around 59% share followed by Hydro with 17%, Renewable Energy projects with 12%, Nuclear power with 2% and Diesel Projects with 1%. Power India Summary
  • 9.
    Power India POWER INDIA Power,in the present edge, is the life blood for each & every economy around the globe. It is an essential requirement for all facets of our life and has been recognized as a basic human need. Socio-economic development of any country depends upon development of this critical infrastructure. Indian Power sector has been in the fore front of Indian growth story. With huge captive coal reserves, significant potential for generation of power from renewable energy sources, and a highly investor friendly Government policy for setting-up green-field Power projects, Indian Power sector is abreast with untapped opportunities. The growth of the economy and its global competitiveness hinges on the availability of reliable and quality power at competitive rates. POWER INDIA is putting an effort to bolster the sturdy growth of Indian Power Sector by providing comprehensive supports in terms of latest happenings, analysis, publications, links and other resources related to the Indian and Global Power Sector to the Power Professionals. Power India SERVICES OFFERED