Download to read offline


![THE POWER SECTOR – AT A GLANCE
4th largest
producer &
consumer of
electricity
Expected
CAGR – 7.5%
over 2015-16
to 2020
Robust
growth in
renewables
Favourable
policy
environment
5th largest
installed
capacity
[2,72,687 MW]](https://image.slidesharecdn.com/indianpower-150814081300-lva1-app6891/85/Indian-power-3-320.jpg)

![831
862
937
998
1072
FY 11 FY 12 FY 13 FY 14 FY 15 E
Demand for Power Growth Rate [In bn units]](https://image.slidesharecdn.com/indianpower-150814081300-lva1-app6891/85/Indian-power-5-320.jpg)
![1,142
1,223
1,319
1,425
1,541
FY 16 P FY 17 P FY 18 P FY 19 P FY 20 P
Projected Demand Growth for Power for next 5 Years [bn units]](https://image.slidesharecdn.com/indianpower-150814081300-lva1-app6891/85/Indian-power-6-320.jpg)


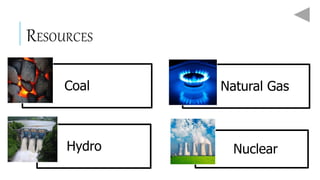


The document provides an overview of the Indian power sector. It discusses that India has the 4th largest installed power capacity globally and is expected to see 7.5% annual growth in electricity demand over the next few years. The power sector is dominated by thermal sources like coal, but renewable energy is growing robustly. Key players in the sector include central and private entities. Challenges include financial stress, lack of long-term power purchase agreements, delays in approvals, and constraints on fuel availability. The document outlines various growth drivers for the sector and recommends quick fixes like improving land acquisition and clearances to address challenges.