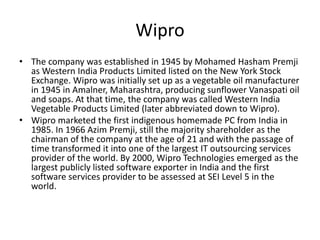
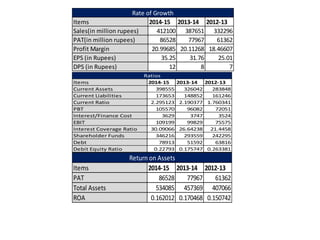
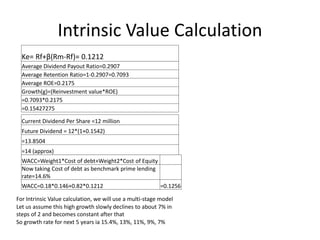
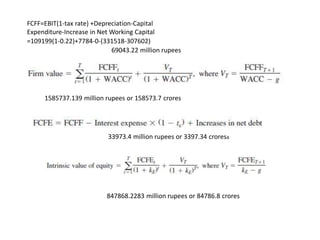
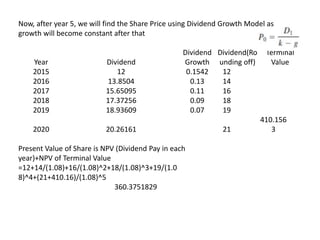
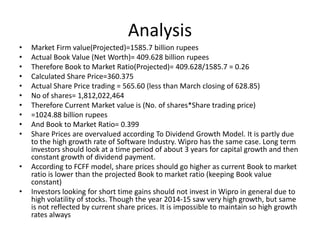
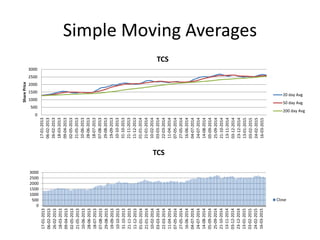
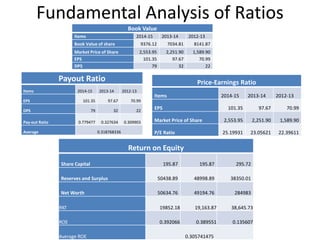
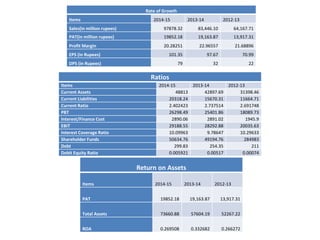
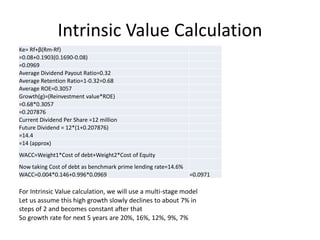
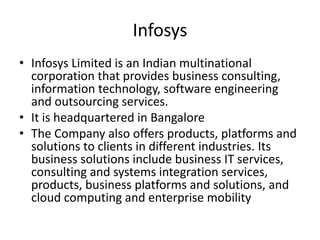
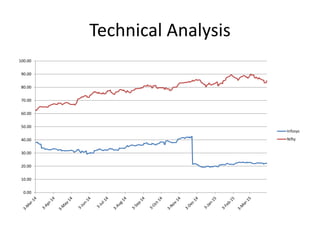
The document provides an analysis of major Indian IT companies Wipro, TCS, and Infosys. It discusses the background and growth of the Indian IT industry, key macroeconomic factors influencing the sector such as exchange rates and government initiatives, and provides an overview of Wipro and TCS including their history, financial performance, and stock analysis. Technical indicators and ratios are examined to evaluate the companies' growth trends and investment potential. The analysis finds that while the IT sector growth outlook remains positive, current stock prices of Wipro may be overvalued based on dividend growth models.
In this report you will be came to know about Tata Steel - when it was formed its future plans , its financial position based on the ratio analysis being done on the basis of their 3 years balance sheet and conclusion of the analysis
A Presentation on Bajaj Finance, consisting of Company Overview, Leadership, Share-holding pattern, Swot Analysis, Competition Analysis, Conclusion & A way forward.
Wipro India - Presentation on Company ProfileAbbas Jafri
A presentation on Wipro India Private Ltd.
PPT focuses on various key point:
1.Introduction
2.History
3. Board of Directors
4. Locations
5. Products and Services
6. Group of Companies
7. CSR
8. Clients
9. Placements
PPT. by Syed Abbas Amir Jafri
Financial Analysis of Axis Bank Services (MBA Finance)Avinash Labade
If any have Need Project Report please call +919011888598 and i will provide only Word File.
and
Project Cost is Rs 500/- Per Project
Send Me Payment Phone Pay or Google Pay
Indian IT industry analysis of 5 slides and company ( Infosys) analysis ( FY ...Saurabh Mittra
IT industry overview, key facts about the industry, market size(2015) and growing market size, government's initiative, company overview, key decisions taken by Board Of Directors, some financials as per IFRS AND U.S GAAP - standalone as well as consolidated taken from the annual report of FY 15, ratio analysis done for the standalone as well as consolidated financials and the future plan of the company.
Information Technology and Information Technology Enabled Services SectorVibrant Gujarat
Highlighting the value proposition of the ever growing IT-ITes Sector in India, this presentation gives an overall idea about the future of the sector in India as well as Gujarat. It mentions the various initiatives, incentives and schemes launched by the Government of India and the Government of Gujarat to promote business and investment in the sector.
India remains a preferred destination for information technology (IT) and information technology enabled services (ITeS) in the world. The Indian IT- business process management (BPM) sector is estimated to expand at a compounded annual growth rate (CAGR) of 9.5 per cent to reach US$ 300 billion by 2020. Over 2000-13, the sector has increased at a CAGR of 25 per cent.
Total exports from the IT- BPM sector (excluding hardware) are estimated at US$ 76 billion during FY13. Export of IT services has been the major contributor, accounting for 57.9 per cent of total IT exports.
Demand from emerging countries is expected to show strong growth going forward. Tax holidays are also extended to IT sector for software technology parks of India (STPI) and special economic zones (SEZs). Further, the country is providing procedural ease and single window clearance for setting up facilities. The country’s cost competitiveness in providing IT services, which is approximately 3-4 times cheaper than the US continues to be its USP in the global sourcing market.
Disruptive technologies present an entire new gamut of opportunities for IT firms in India. Cloud represents the largest opportunity under Social, Mobility, Analytics and Cloud (SMAC), increasing at a CAGR of approximately 30 per cent to around US$ 650–700 billion by 2020. Social media is the second most lucrative segment for IT firms, offering a US$ 250 billion market opportunity by 2020.
Marketing, Pricing and Distribution of Datsun GoNeelutpal Saha
Marketing for latest vehicle Datsun Go launched by Nissan. The ppt contains various means of distribution and promotional strategies which can be used by Nissan
how to sell pi coins effectively (from 50 - 100k pi)DOT TECH
Anywhere in the world, including Africa, America, and Europe, you can sell Pi Network Coins online and receive cash through online payment options.
Pi has not yet been launched on any exchange because we are currently using the confined Mainnet. The planned launch date for Pi is June 28, 2026.
Reselling to investors who want to hold until the mainnet launch in 2026 is currently the sole way to sell.
Consequently, right now. All you need to do is select the right pi network provider.
Who is a pi merchant?
An individual who buys coins from miners on the pi network and resells them to investors hoping to hang onto them until the mainnet is launched is known as a pi merchant.
debuts.
I'll provide you the Telegram username
@Pi_vendor_247
how to sell pi coins in all Africa Countries.DOT TECH
Yes. You can sell your pi network for other cryptocurrencies like Bitcoin, usdt , Ethereum and other currencies And this is done easily with the help from a pi merchant.
What is a pi merchant ?
Since pi is not launched yet in any exchange. The only way you can sell right now is through merchants.
A verified Pi merchant is someone who buys pi network coins from miners and resell them to investors looking forward to hold massive quantities of pi coins before mainnet launch in 2026.
I will leave the telegram contact of my personal pi merchant to trade with.
@Pi_vendor_247
If you are looking for a pi coin investor. Then look no further because I have the right one he is a pi vendor (he buy and resell to whales in China). I met him on a crypto conference and ever since I and my friends have sold more than 10k pi coins to him And he bought all and still want more. I will drop his telegram handle below just send him a message.
@Pi_vendor_247
Resume
• Real GDP growth slowed down due to problems with access to electricity caused by the destruction of manoeuvrable electricity generation by Russian drones and missiles.
• Exports and imports continued growing due to better logistics through the Ukrainian sea corridor and road. Polish farmers and drivers stopped blocking borders at the end of April.
• In April, both the Tax and Customs Services over-executed the revenue plan. Moreover, the NBU transferred twice the planned profit to the budget.
• The European side approved the Ukraine Plan, which the government adopted to determine indicators for the Ukraine Facility. That approval will allow Ukraine to receive a EUR 1.9 bn loan from the EU in May. At the same time, the EU provided Ukraine with a EUR 1.5 bn loan in April, as the government fulfilled five indicators under the Ukraine Plan.
• The USA has finally approved an aid package for Ukraine, which includes USD 7.8 bn of budget support; however, the conditions and timing of the assistance are still unknown.
• As in March, annual consumer inflation amounted to 3.2% yoy in April.
• At the April monetary policy meeting, the NBU again reduced the key policy rate from 14.5% to 13.5% per annum.
• Over the past four weeks, the hryvnia exchange rate has stabilized in the UAH 39-40 per USD range.
how can I sell my pi coins for cash in a pi APPDOT TECH
You can't sell your pi coins in the pi network app. because it is not listed yet on any exchange.
The only way you can sell is by trading your pi coins with an investor (a person looking forward to hold massive amounts of pi coins before mainnet launch) .
You don't need to meet the investor directly all the trades are done with a pi vendor/merchant (a person that buys the pi coins from miners and resell it to investors)
I Will leave The telegram contact of my personal pi vendor, if you are finding a legitimate one.
@Pi_vendor_247
#pi network
#pi coins
#money
what is the future of Pi Network currency.DOT TECH
The future of the Pi cryptocurrency is uncertain, and its success will depend on several factors. Pi is a relatively new cryptocurrency that aims to be user-friendly and accessible to a wide audience. Here are a few key considerations for its future:
Message: @Pi_vendor_247 on telegram if u want to sell PI COINS.
1. Mainnet Launch: As of my last knowledge update in January 2022, Pi was still in the testnet phase. Its success will depend on a successful transition to a mainnet, where actual transactions can take place.
2. User Adoption: Pi's success will be closely tied to user adoption. The more users who join the network and actively participate, the stronger the ecosystem can become.
3. Utility and Use Cases: For a cryptocurrency to thrive, it must offer utility and practical use cases. The Pi team has talked about various applications, including peer-to-peer transactions, smart contracts, and more. The development and implementation of these features will be essential.
4. Regulatory Environment: The regulatory environment for cryptocurrencies is evolving globally. How Pi navigates and complies with regulations in various jurisdictions will significantly impact its future.
5. Technology Development: The Pi network must continue to develop and improve its technology, security, and scalability to compete with established cryptocurrencies.
6. Community Engagement: The Pi community plays a critical role in its future. Engaged users can help build trust and grow the network.
7. Monetization and Sustainability: The Pi team's monetization strategy, such as fees, partnerships, or other revenue sources, will affect its long-term sustainability.
It's essential to approach Pi or any new cryptocurrency with caution and conduct due diligence. Cryptocurrency investments involve risks, and potential rewards can be uncertain. The success and future of Pi will depend on the collective efforts of its team, community, and the broader cryptocurrency market dynamics. It's advisable to stay updated on Pi's development and follow any updates from the official Pi Network website or announcements from the team.
US Economic Outlook - Being Decided - M Capital Group August 2021.pdfpchutichetpong
The U.S. economy is continuing its impressive recovery from the COVID-19 pandemic and not slowing down despite re-occurring bumps. The U.S. savings rate reached its highest ever recorded level at 34% in April 2020 and Americans seem ready to spend. The sectors that had been hurt the most by the pandemic specifically reduced consumer spending, like retail, leisure, hospitality, and travel, are now experiencing massive growth in revenue and job openings.
Could this growth lead to a “Roaring Twenties”? As quickly as the U.S. economy contracted, experiencing a 9.1% drop in economic output relative to the business cycle in Q2 2020, the largest in recorded history, it has rebounded beyond expectations. This surprising growth seems to be fueled by the U.S. government’s aggressive fiscal and monetary policies, and an increase in consumer spending as mobility restrictions are lifted. Unemployment rates between June 2020 and June 2021 decreased by 5.2%, while the demand for labor is increasing, coupled with increasing wages to incentivize Americans to rejoin the labor force. Schools and businesses are expected to fully reopen soon. In parallel, vaccination rates across the country and the world continue to rise, with full vaccination rates of 50% and 14.8% respectively.
However, it is not completely smooth sailing from here. According to M Capital Group, the main risks that threaten the continued growth of the U.S. economy are inflation, unsettled trade relations, and another wave of Covid-19 mutations that could shut down the world again. Have we learned from the past year of COVID-19 and adapted our economy accordingly?
“In order for the U.S. economy to continue growing, whether there is another wave or not, the U.S. needs to focus on diversifying supply chains, supporting business investment, and maintaining consumer spending,” says Grace Feeley, a research analyst at M Capital Group.
While the economic indicators are positive, the risks are coming closer to manifesting and threatening such growth. The new variants spreading throughout the world, Delta, Lambda, and Gamma, are vaccine-resistant and muddy the predictions made about the economy and health of the country. These variants bring back the feeling of uncertainty that has wreaked havoc not only on the stock market but the mindset of people around the world. MCG provides unique insight on how to mitigate these risks to possibly ensure a bright economic future.
Introduction to Indian Financial System ()Avanish Goel
The financial system of a country is an important tool for economic development of the country, as it helps in creation of wealth by linking savings with investments.
It facilitates the flow of funds form the households (savers) to business firms (investors) to aid in wealth creation and development of both the parties
Empowering the Unbanked: The Vital Role of NBFCs in Promoting Financial Inclu...Vighnesh Shashtri
In India, financial inclusion remains a critical challenge, with a significant portion of the population still unbanked. Non-Banking Financial Companies (NBFCs) have emerged as key players in bridging this gap by providing financial services to those often overlooked by traditional banking institutions. This article delves into how NBFCs are fostering financial inclusion and empowering the unbanked.
NO1 Uk Rohani Baba In Karachi Bangali Baba Karachi Online Amil Baba WorldWide...Amil baba
Contact with Dawood Bhai Just call on +92322-6382012 and we'll help you. We'll solve all your problems within 12 to 24 hours and with 101% guarantee and with astrology systematic. If you want to take any personal or professional advice then also you can call us on +92322-6382012 , ONLINE LOVE PROBLEM & Other all types of Daily Life Problem's.Then CALL or WHATSAPP us on +92322-6382012 and Get all these problems solutions here by Amil Baba DAWOOD BANGALI
#vashikaranspecialist #astrologer #palmistry #amliyaat #taweez #manpasandshadi #horoscope #spiritual #lovelife #lovespell #marriagespell#aamilbabainpakistan #amilbabainkarachi #powerfullblackmagicspell #kalajadumantarspecialist #realamilbaba #AmilbabainPakistan #astrologerincanada #astrologerindubai #lovespellsmaster #kalajaduspecialist #lovespellsthatwork #aamilbabainlahore#blackmagicformarriage #aamilbaba #kalajadu #kalailam #taweez #wazifaexpert #jadumantar #vashikaranspecialist #astrologer #palmistry #amliyaat #taweez #manpasandshadi #horoscope #spiritual #lovelife #lovespell #marriagespell#aamilbabainpakistan #amilbabainkarachi #powerfullblackmagicspell #kalajadumantarspecialist #realamilbaba #AmilbabainPakistan #astrologerincanada #astrologerindubai #lovespellsmaster #kalajaduspecialist #lovespellsthatwork #aamilbabainlahore #blackmagicforlove #blackmagicformarriage #aamilbaba #kalajadu #kalailam #taweez #wazifaexpert #jadumantar #vashikaranspecialist #astrologer #palmistry #amliyaat #taweez #manpasandshadi #horoscope #spiritual #lovelife #lovespell #marriagespell#aamilbabainpakistan #amilbabainkarachi #powerfullblackmagicspell #kalajadumantarspecialist #realamilbaba #AmilbabainPakistan #astrologerincanada #astrologerindubai #lovespellsmaster #kalajaduspecialist #lovespellsthatwork #aamilbabainlahore #Amilbabainuk #amilbabainspain #amilbabaindubai #Amilbabainnorway #amilbabainkrachi #amilbabainlahore #amilbabaingujranwalan #amilbabainislamabad
The secret way to sell pi coins effortlessly.DOT TECH
Well as we all know pi isn't launched yet. But you can still sell your pi coins effortlessly because some whales in China are interested in holding massive pi coins. And they are willing to pay good money for it. If you are interested in selling I will leave a contact for you. Just telegram this number below. I sold about 3000 pi coins to him and he paid me immediately.
Telegram: @Pi_vendor_247
how to swap pi coins to foreign currency withdrawable.DOT TECH
As of my last update, Pi is still in the testing phase and is not tradable on any exchanges.
However, Pi Network has announced plans to launch its Testnet and Mainnet in the future, which may include listing Pi on exchanges.
The current method for selling pi coins involves exchanging them with a pi vendor who purchases pi coins for investment reasons.
If you want to sell your pi coins, reach out to a pi vendor and sell them to anyone looking to sell pi coins from any country around the globe.
Below is the contact information for my personal pi vendor.
Telegram: @Pi_vendor_247
Turin Startup Ecosystem 2024 - Ricerca sulle Startup e il Sistema dell'Innov...Quotidiano Piemontese
Turin Startup Ecosystem 2024
Una ricerca de il Club degli Investitori, in collaborazione con ToTeM Torino Tech Map e con il supporto della ESCP Business School e di Growth Capital
what is the best method to sell pi coins in 2024DOT TECH
The best way to sell your pi coins safely is trading with an exchange..but since pi is not launched in any exchange, and second option is through a VERIFIED pi merchant.
Who is a pi merchant?
A pi merchant is someone who buys pi coins from miners and pioneers and resell them to Investors looking forward to hold massive amounts before mainnet launch in 2026.
I will leave the telegram contact of my personal pi merchant to trade pi coins with.
@Pi_vendor_247
2. Background
• India is the world's largest sourcing destination for the information
technology (IT) industry, accounting for approximately 52 per cent
of the US$ 124-130 billion market.
• The industry employs about 10 million Indians and continues to
contribute significantly to the social and economic transformation
in the country.
• The IT industry has not only transformed India's image on the global
platform, but has also fuelled economic growth by energizing the
higher education sector especially in engineering and computer
science.
• India's cost competitiveness in providing IT services, which is
approximately 3-4 times cheaper than the US, continues to be its
unique selling proposition (USP) in the global sourcing market.
3. Macroeconomic Factors
• Labour arbitrage has been the competitive edge of the Indian
software sector over the last few years. However, the focus has now
shifted to providing value to clients beyond cost savings.
• The new Indian government is emphasizing on better technology
enabled delivery mechanisms for a multitude of government
projects.
• Government Initiatives: The adoption of key technologies across
sectors spurred by the 'Digital India Initiative' could help boost
India's gross domestic product (GDP) by US$ 550 billion to US$ 1
trillion by 2025.
• Policy and Promotion: In the electronics and IT sector, 100% FDI is
permitted under the automatic route. The major fiscal incentives
provided by the Government of India in this sector have been for
export-oriented units (EOU), software technology parks (STP) and
special economic zones (SEZ).
4. • Exchange Rate: Recent changes in global economy such as recession
and looming threat of deflation in the US and Europe has
contributed to the weakening of the USD against major other
currencies including the rupee. This has affected India’s export
sector, especially information technology sector because sixty seven
percent of their revenues come from US and about ninety percent
of exports are invoiced in USD.
• Business Cycle: While the business model has enabled Indian
software companies to transit smoothly from software "body-
shopping" services to off-shore software development in India, it
has also made them vulnerable to the business cycles in client
countries.
• Inflation: The nature of inflation in India is mainly cost push
inflation, which leads to rise in rise in factor costs such as land,
labor and capital. Since the Indian IT industry is more dependent on
Manpower, the cost of HR increases significantly in the form of
salaries. This rise in cost in the IT industry is compensated by the
depreciation in the value of rupee. Therefore, Indian IT industry is
largely unaffected by inflation unless there is an external factor like
global economic slowdown etc.
5. Wipro
• The company was established in 1945 by Mohamed Hasham Premji
as Western India Products Limited listed on the New York Stock
Exchange. Wipro was initially set up as a vegetable oil manufacturer
in 1945 in Amalner, Maharashtra, producing sunflower Vanaspati oil
and soaps. At that time, the company was called Western India
Vegetable Products Limited (later abbreviated down to Wipro).
• Wipro marketed the first indigenous homemade PC from India in
1985. In 1966 Azim Premji, still the majority shareholder as the
chairman of the company at the age of 21 and with the passage of
time transformed it into one of the largest IT outsourcing services
provider of the world. By 2000, Wipro Technologies emerged as the
largest publicly listed software exporter in India and the first
software services provider to be assessed at SEI Level 5 in the
world.
9. Fundamental Analysis of Ratiosin million rupees
Items 2014-15 2013-14 2012-13
Book Value 166 140 116
Market Price of Share 628.85 543.2 473.15
EPS 35.25 31.76 25.01
DPS 12 8 7
Book Value
Items 2014-15 2013-14 2012-13
EPS 35.25 31.76 25.01
DPS 12 8 7
Pay-out Ratio 0.340426 0.251889 0.279888
Average 0.290734248
Payout Ratio
in million rupees
Items 2014-15 2013-14 2012-13
Share Capital 4937 4932 4926
Reserves and Surplus 341279 288627 237369
Net Worth 409628 344886 284983
PAT 86528 77967 61362
ROE 0.211236 0.226066 0.215318
Average ROE 0.21753989
Return on Equity
Items 2014-15 2013-14 2012-13
EPS 35.25 31.76 25.01
MarketPrice of Share 628.85 543.2 473.15
P/ERatio 17.83972 17.10327 18.91843
Price-Earnings Ratio
10. Items 2014-15 2013-14 2012-13
Sales(in million rupees) 412100 387651 332296
PAT(in million rupees) 86528 77967 61362
Profit Margin 20.99685 20.11268 18.46607
EPS (in Rupees) 35.25 31.76 25.01
DPS (in Rupees) 12 8 7
Rate of Growth
Items 2014-15 2013-14 2012-13
Current Assets 398555 326042 283848
Current Liabilities 173653 148852 161246
Current Ratio 2.295123 2.190377 1.760341
PBT 105570 96082 72051
Interest/Finance Cost 3629 3747 3524
EBIT 109199 99829 75575
Interest Coverage Ratio 30.09066 26.64238 21.4458
Shareholder Funds 346216 293559 242295
Debt 78913 51592 63816
Debit Equity Ratio 0.22793 0.175747 0.263381
Ratios
Items 2014-15 2013-14 2012-13
PAT 86528 77967 61362
Total Assets 534085 457369 407066
ROA 0.162012 0.170468 0.150742
Return on Assets
11. Intrinsic Value Calculation
Ke= Rf+β(Rm-Rf)= 0.1212
Average Dividend Payout Ratio=0.2907
Average Retention Ratio=1-0.2907=0.7093
Average ROE=0.2175
Growth(g)=(Reinvestment value*ROE)
=0.7093*0.2175
=0.15427275
Current Dividend Per Share =12 million
Future Dividend = 12*(1+0.1542)
=13.8504
=14 (approx)
WACC=Weight1*Cost of debt+Weight2*Cost of Equity
Now taking Cost of debt as benchmark prime lending
rate=14.6%
WACC=0.18*0.146+0.82*0.1212 =0.1256
For Intrinsic Value calculation, we will use a multi-stage model
Let us assume this high growth slowly declines to about 7% in
steps of 2 and becomes constant after that
So growth rate for next 5 years ia 15.4%, 13%, 11%, 9%, 7%
12. FCFF=EBIT(1-tax rate) +Depreciation-Capital
Expenditure-Increase in Net Working Capital
=109199(1-0.22)+7784-0-(331518-307602)
69043.22 million rupees
1585737.139 million rupees or 158573.7 crores
33973.4 million rupees or 3397.34 crores4
847868.2283 million rupees or 84786.8 crores
13. Now, after year 5, we will find the Share Price using Dividend Growth Model as
growth will become constant after that
Year Dividend
Dividend
Growth
Dividend(Ro
unding off)
Terminal
Value
2015 12 0.1542 12
2016 13.8504 0.13 14
2017 15.65095 0.11 16
2018 17.37256 0.09 18
2019 18.93609 0.07 19
2020 20.26161 21
410.156
3
Present Value of Share is NPV (Dividend Pay in each
year)+NPV of Terminal Value
=12+14/(1.08)+16/(1.08)^2+18/(1.08)^3+19/(1.0
8)^4+(21+410.16)/(1.08)^5
360.3751829
14. Analysis
• Market Firm value(Projected)=1585.7 billion rupees
• Actual Book Value (Net Worth)= 409.628 billion rupees
• Therefore Book to Market Ratio(Projected)= 409.628/1585.7 = 0.26
• Calculated Share Price=360.375
• Actual Share Price trading = 565.60 (less than March closing of 628.85)
• No of shares= 1,812,022,464
• Therefore Current Market value is (No. of shares*Share trading price)
• =1024.88 billion rupees
• And Book to Market Ratio= 0.399
• Share Prices are overvalued according To Dividend Growth Model. It is partly due
to the high growth rate of Software Industry. Wipro has the same case. Long term
investors should look at a time period of about 3 years for capital growth and then
constant growth of dividend payment.
• According to FCFF model, share prices should go higher as current Book to market
ratio is lower than the projected Book to market ratio (keeping Book value
constant)
• Investors looking for short time gains should not invest in Wipro in general due to
high volatility of stocks. Though the year 2014-15 saw very high growth, but same
is not reflected by current share prices. It is impossible to maintain so high growth
rates always
15. TCS
• Tata Consultancy Services Limited (TCS) is an Indian multinational
information technology (IT) service, consulting and business
solutions company headquartered in Mumbai, Maharashtra. TCS
operates in 46 countries.
• It is a subsidiary of the Tata Group and is listed on the Bombay
Stock Exchange and the National Stock Exchange of India. TCS is one
of the largest Indian companies by market capitalization ($80
billion) and is the largest India-based IT services company by 2013
revenues.
• TCS is now placed among the ‘Big 4’ most valuable IT services
brands worldwide. In 2013, TCS is ranked 57th overall in the Forbes
World's Most Innovative Companies ranking, making it both the
highest-ranked IT services company and the first Indian company. It
is the world's 10th largest IT services provider, measured by the
revenues.
19. Fundamental Analysis of Ratios
Book Value
Items 2014-15 2013-14 2012-13
Book Value of share 9376.12 7034.81 8141.87
Market Price of Share 2,553.95 2,251.90 1,589.90
EPS 101.35 97.67 70.99
DPS 79 32 22
Payout Ratio
Items 2014-15 2013-14 2012-13
EPS 101.35 97.67 70.99
DPS 79 32 22
Pay-out Ratio 0.779477 0.327634 0.309903
Average 0.318768336
Price-Earnings Ratio
Items 2014-15 2013-14 2012-13
EPS 101.35 97.67 70.99
Market Price of Share 2,553.95 2,251.90 1,589.90
P/E Ratio 25.19931 23.05621 22.39611
Return on Equity
Share Capital 195.87 195.87 295.72
Reserves and Surplus 50438.89 48998.89 38350.01
Net Worth 50634.76 49194.76 284983
PAT 19852.18 19,163.87 38,645.73
ROE 0.392066 0.389551 0.135607
Average ROE 0.305741475
20. Rate of Growth
Items 2014-15 2013-14 2012-13
Sales(in million rupees) 97878.32 83,446.10 64,167.71
PAT(in million rupees) 19852.18 19,163.87 13,917.31
Profit Margin 20.28251 22.96557 21.68896
EPS (in Rupees) 101.35 97.67 70.99
DPS (in Rupees) 79 32 22
Ratios
Items 2014-15 2013-14 2012-13
Current Assets 48813 42897.69 31398.46
Current Liabilities 20318.24 15670.31 11664.71
Current Ratio 2.402423 2.737514 2.691748
PBT 26298.49 25401.86 18089.73
Interest/Finance Cost 2890.06 2891.02 1945.9
EBIT 29188.55 28292.88 20035.63
Interest Coverage Ratio 10.09963 9.78647 10.29633
Shareholder Funds 50634.76 49194.76 284983
Debt 299.83 254.35 211
Debit Equity Ratio 0.005921 0.00517 0.00074
Return on Assets
Items 2014-15 2013-14 2012-13
PAT 19852.18 19,163.87 13,917.31
Total Assets 73660.88 57604.19 52267.22
ROA 0.269508 0.332682 0.266272
21. Intrinsic Value Calculation
For Intrinsic Value calculation, we will use a multi-stage model
Let us assume this high growth slowly declines to about 7% in
steps of 2 and becomes constant after that
So growth rate for next 5 years are 20%, 16%, 12%, 9%, 7%
Ke= Rf+β(Rm-Rf)
=0.08+0.1903(0.1690-0.08)
=0.0969
Average Dividend Payout Ratio=0.32
Average Retention Ratio=1-0.32=0.68
Average ROE=0.3057
Growth(g)=(Reinvestment value*ROE)
=0.68*0.3057
=0.207876
Current Dividend Per Share =12 million
Future Dividend = 12*(1+0.207876)
=14.4
=14 (approx)
WACC=Weight1*Cost of debt+Weight2*Cost of Equity
Now taking Cost of debt as benchmark prime lending rate=14.6%
WACC=0.004*0.146+0.996*0.0969 =0.0971
23. Now, after year 5, we will find the Share Price using Dividend Growth Model as
growth will become constant after that
Year Dividend
Dividend
Growth
Dividend(Rou
nding off) Terminal Value
2015 39 0.2 39
2016 46.8 0.16 47
2017 54.288 0.12 54
2018 60.80256 0.09 61
2019 66.27479 0.07 66
2020 70.91403 71
1386.718
75
Present Value of Share is NPV (Dividend Pay in each
year)+NPV of Terminal Value
=79+47/(1.08)+54/(1.08)^2+61/(1.08)^3+66/(
1.08)^4+(71+1386.72)/(1.08)^5
1257.85029
24. Analysis
• Market Firm value(Projected)= 1185932.939 cr rupees
• Actual Book Value (Net Worth)= 50634.76 cr rupees
• Therefore Book to Market Ratio(Projected)= 50634.76 /1185932.94 = 0.04
• Calculated Share Price=1257.85
• Actual Share Price trading = 2550
• No of shares= 1,958,727,979
• Therefore Current Market value is (No. of shares*Share trading price)
• =49947.56 Cr
• And Book to Market Ratio= 50634.76/49947.56 = 1.013
• The projected share price according to the Dividend growth model is
almost half of the present value, but the current Book to Market ratio is
more than 1 showing that the shares are undervalued. Again from the
FCFF model, we can see the projected Book to market ratio is 0.04 and the
shares are undervalued. Thus the two models give same results. The fact is
TCS with its current growth rate is undervalued in the market and
investors should buy shares. But after a while the share prices will dip and
reach equilibrium. According to our analysis, it is an attractive proposition
for short time till the growth curve dips.
25. Infosys
• Infosys Limited is an Indian multinational
corporation that provides business consulting,
information technology, software engineering
and outsourcing services.
• It is headquartered in Bangalore
• The Company also offers products, platforms and
solutions to clients in different industries. Its
business solutions include business IT services,
consulting and systems integration services,
products, business platforms and solutions, and
cloud computing and enterprise mobility
29. Analysis of ratios
Book Value
Items 2014-15 2013-14 2012-13
Book Value 418.54 736.64 627.95
Market Price of Share 1963.5 3119.10 2811
EPS 105.91 178.4 158.75
DPS 59.5 63 42
Payout Ratio
Items 2014-15 2013-14 2012-13
EPS 105.91 178.4 158.75
DPS 59.5 63 42
Pay-out Ratio 0.562 0.353 0.265
Average 0.39
Return on Equity
Items 2014-15 2013-14 2012-13
Share Capital 574 286 287
Reserves and Surplus 47494 41806 35772
Net Worth 48068 42092 36059
PAT 12164 10194 9116
ROE 0.25 0.24 0.25
Average ROE 0.25
30. Analysis of ratios
Rate of Growth
Items 2014-15 2013-14 2012-13
Sales(in Cr rupees) 412100 44341 36765
PAT(in Cr rupees) 12164 10194 9116
EPS (in Rupees) 105.91 178.4 158.75
DPS (in Rupees) 59.5 63 42
Ratios
Items 2014-15 2013-14 2012-13
Current Assets 33095 28689 26127
Current Liabilities 5700 4503 3181
Current Ratio 5.81 6.37 8.21
PBT 16798 14002 12357
Dividend/Interest
Income 5111 3618 2412
EBIT 21909 17620 14769
Shareholder Funds 574 286 287
Weight (Equity) 1 1 1
Price-Earnings Ratio
Items 2014-15 2013-14 2012-13
EPS 105.91 178.4 158.75
Market Price of Share 5.3 4.46 4.6
P/E Ratio 19.98 40 34.51
Return on Assets
Items 2014-15 2013-14 2012-13
PAT 12164 10194 9116
Total Assets 48068 42092 36059
ROA 0.253 0.242 0.253
31. Intrinsic Value CalculationKe= Rf+β(Rm-Rf)
=0.08+0.7581(0.1690-0.08)
0.1474709
Average Dividend Payout Ratio=0.39
Average Retention Ratio=1-0.39=0.61
Average ROE=0.25
Growth(g)=(Reinvestment value*ROE)
=0.61*0.25
0.1525
Current Dividend Per Share =59.5
Future Dividend = 59.5*(1+0.1525)
68.57375
=69 (approx)
For Intrinsic Value calculation, we will use a multi-stage model
Let us assume this high growth slowly declines to about 7% in steps of 2 and becomes constant after that
So growth rate for next 5 years ia 15.25%, 13%, 11%, 9%, 7%
FCFF=EBIT(1-tax rate) +Depreciation-Capital Expenditure-Increase in Net Working Capital
=21909(1-0.22)+913+0-0 Taking Corporate Tax rate =22%
18002.02
Now
1087223.69
Now, after year 5, we will find the Share Price using Dividend Growth Model as growth will become constant after that
Year Dividend Dividend Growth Dividend(Rounding off)Terminal Value
2015 59.5 0.1522 59.5
2016 68.5559 0.13 69
2017 77.46817 0.11 77
2018 85.98967 0.09 86
2019 93.72874 0.07 94
2020 100.2897 100 1953.125
Present Value of Share is NPV (Dividend Pay in each year)+NPV of Terminal Value
=59.5+69/(1.08)+77/(1.08)^2+86/(1.08)^3+94/(1.08)^4+(100+1953.125)/(1.08)^5
1724.088733
2(1+0.152)/(1+.1474)+18002.02(1+0.13)(1.152)/(1+.1474)^2 + 18002.02(1+0.11)(1.13)(1.152)/(1+.1474)^3+18002.02(1+0.09)(1.11)(1.13)(1.152)/(1+.1474)^4 + 18002.02(1.07)(1+0.09)(1.11)(1.13)(1.152)/(1+.1474)^5 +18002.02(1+0.07)^2(1.09)(1.11)(1.13)(1.152)/((.1474
32. Analysis
• Market Firm value(Projected)= 1087223.69 cr rupees
• Actual Book Value (Net Worth)= 48068 cr rupees
• Therefore Book to Market Ratio(Projected)= 48068 /1087223.69 = 0.04
• Calculated Share Price= Rs 1724.08
• Actual Share Price trading = Rs 1090.70
• No of shares= 1,14,84,72,332
• Therefore Current Market value is (No. of shares*Share trading price)
• =125263.88 Cr
• And Book to Market Ratio= 48068/125263.88 = 0.38
• The projected share price according to the Dividend growth model and
discounted cash flow model shows that the current market price of the
share is undervalued and it will continue to rise in future.
• Also according to FCFF model, it is undervalued as well, since so we advise
investors to buy the stock at current period and hold for a while.