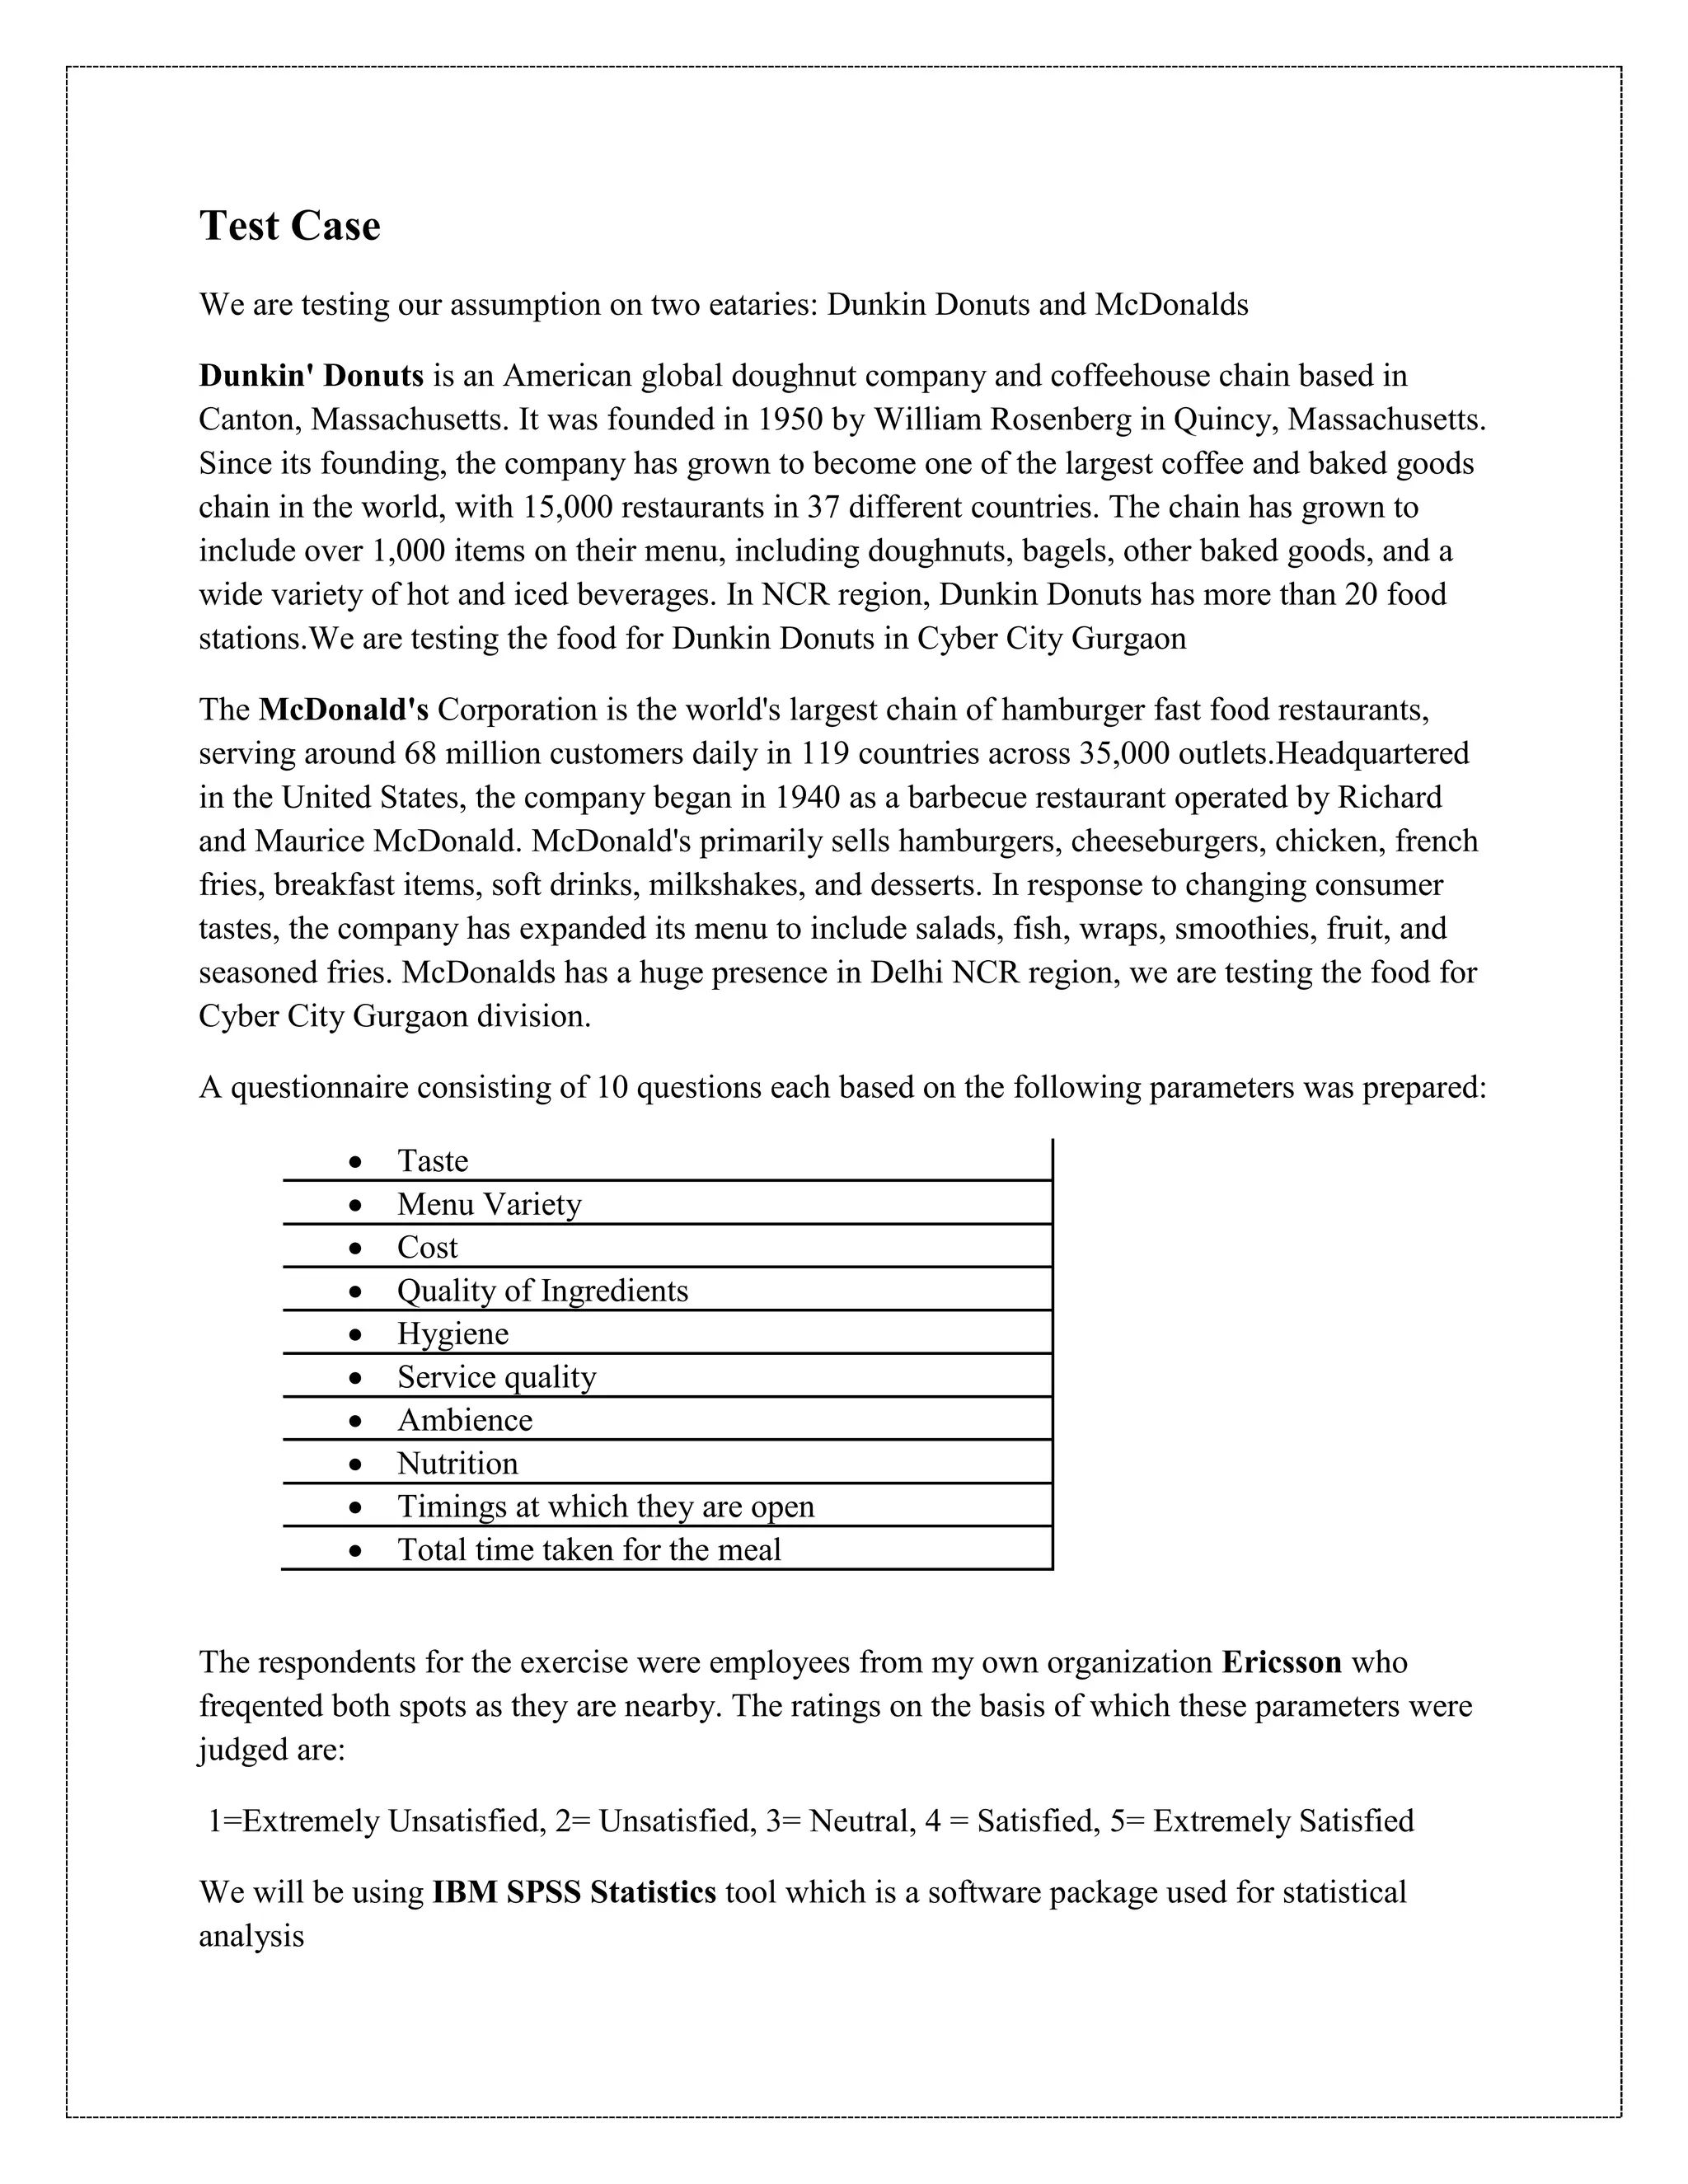
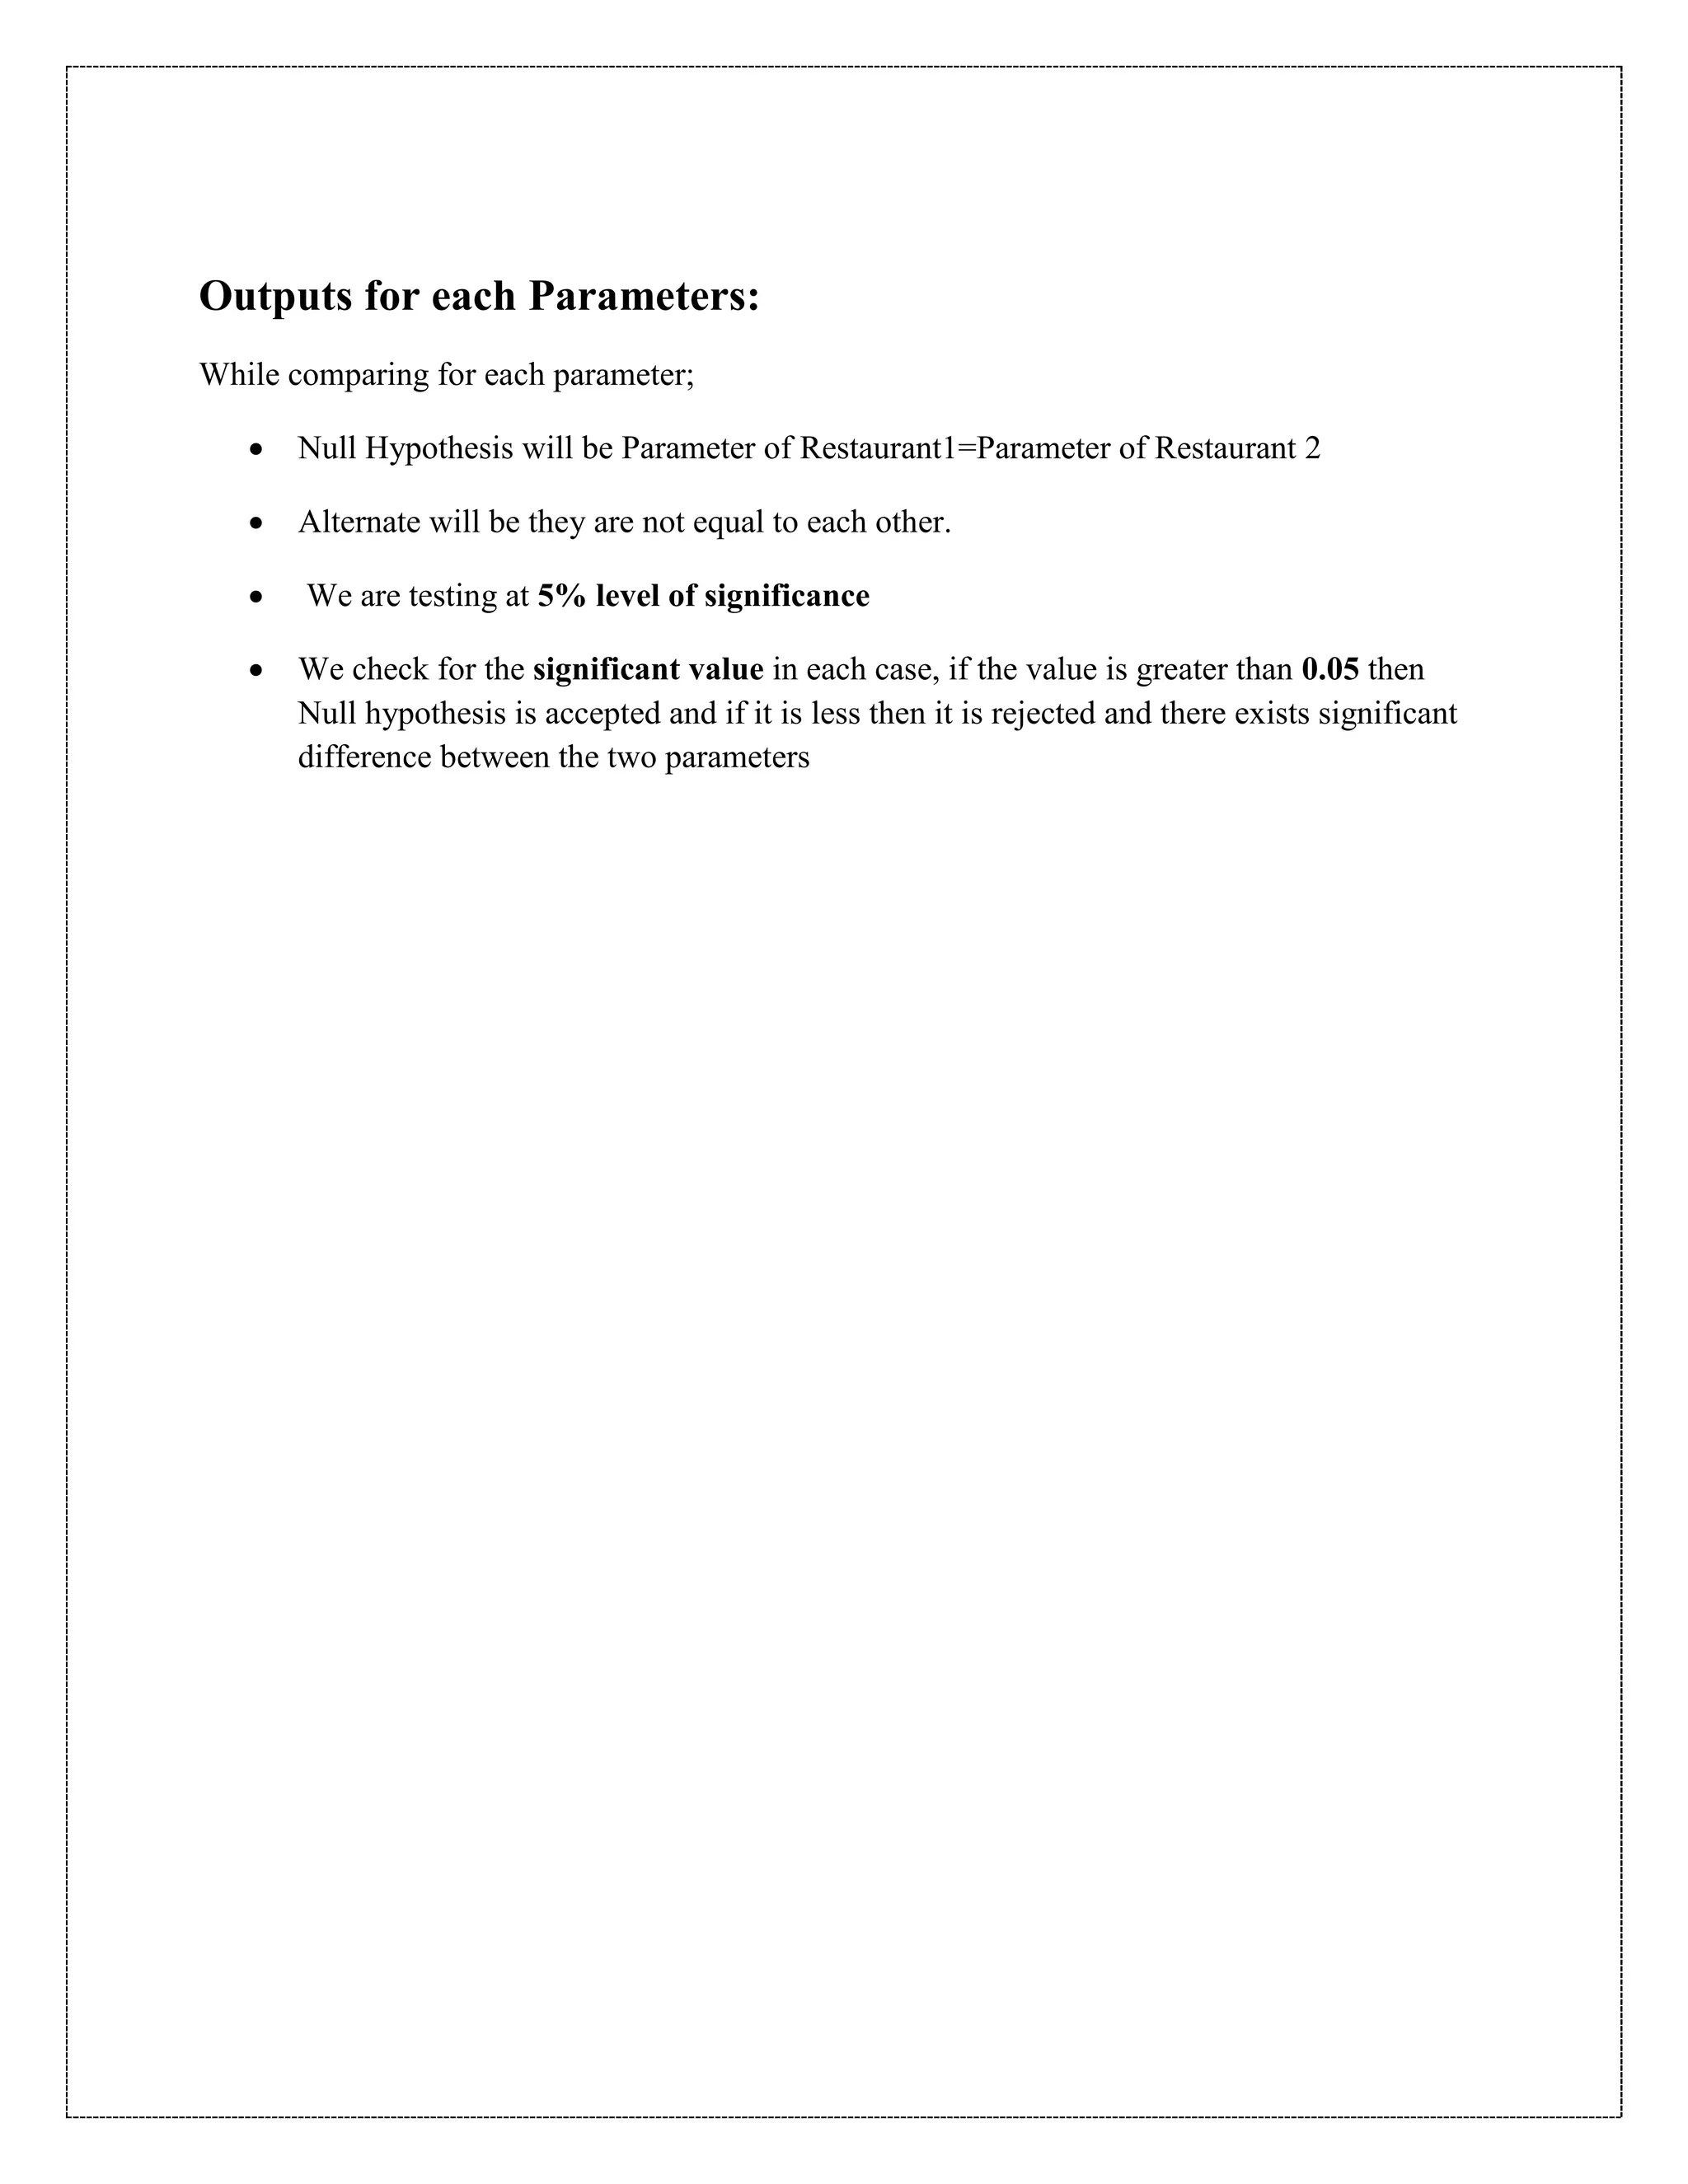
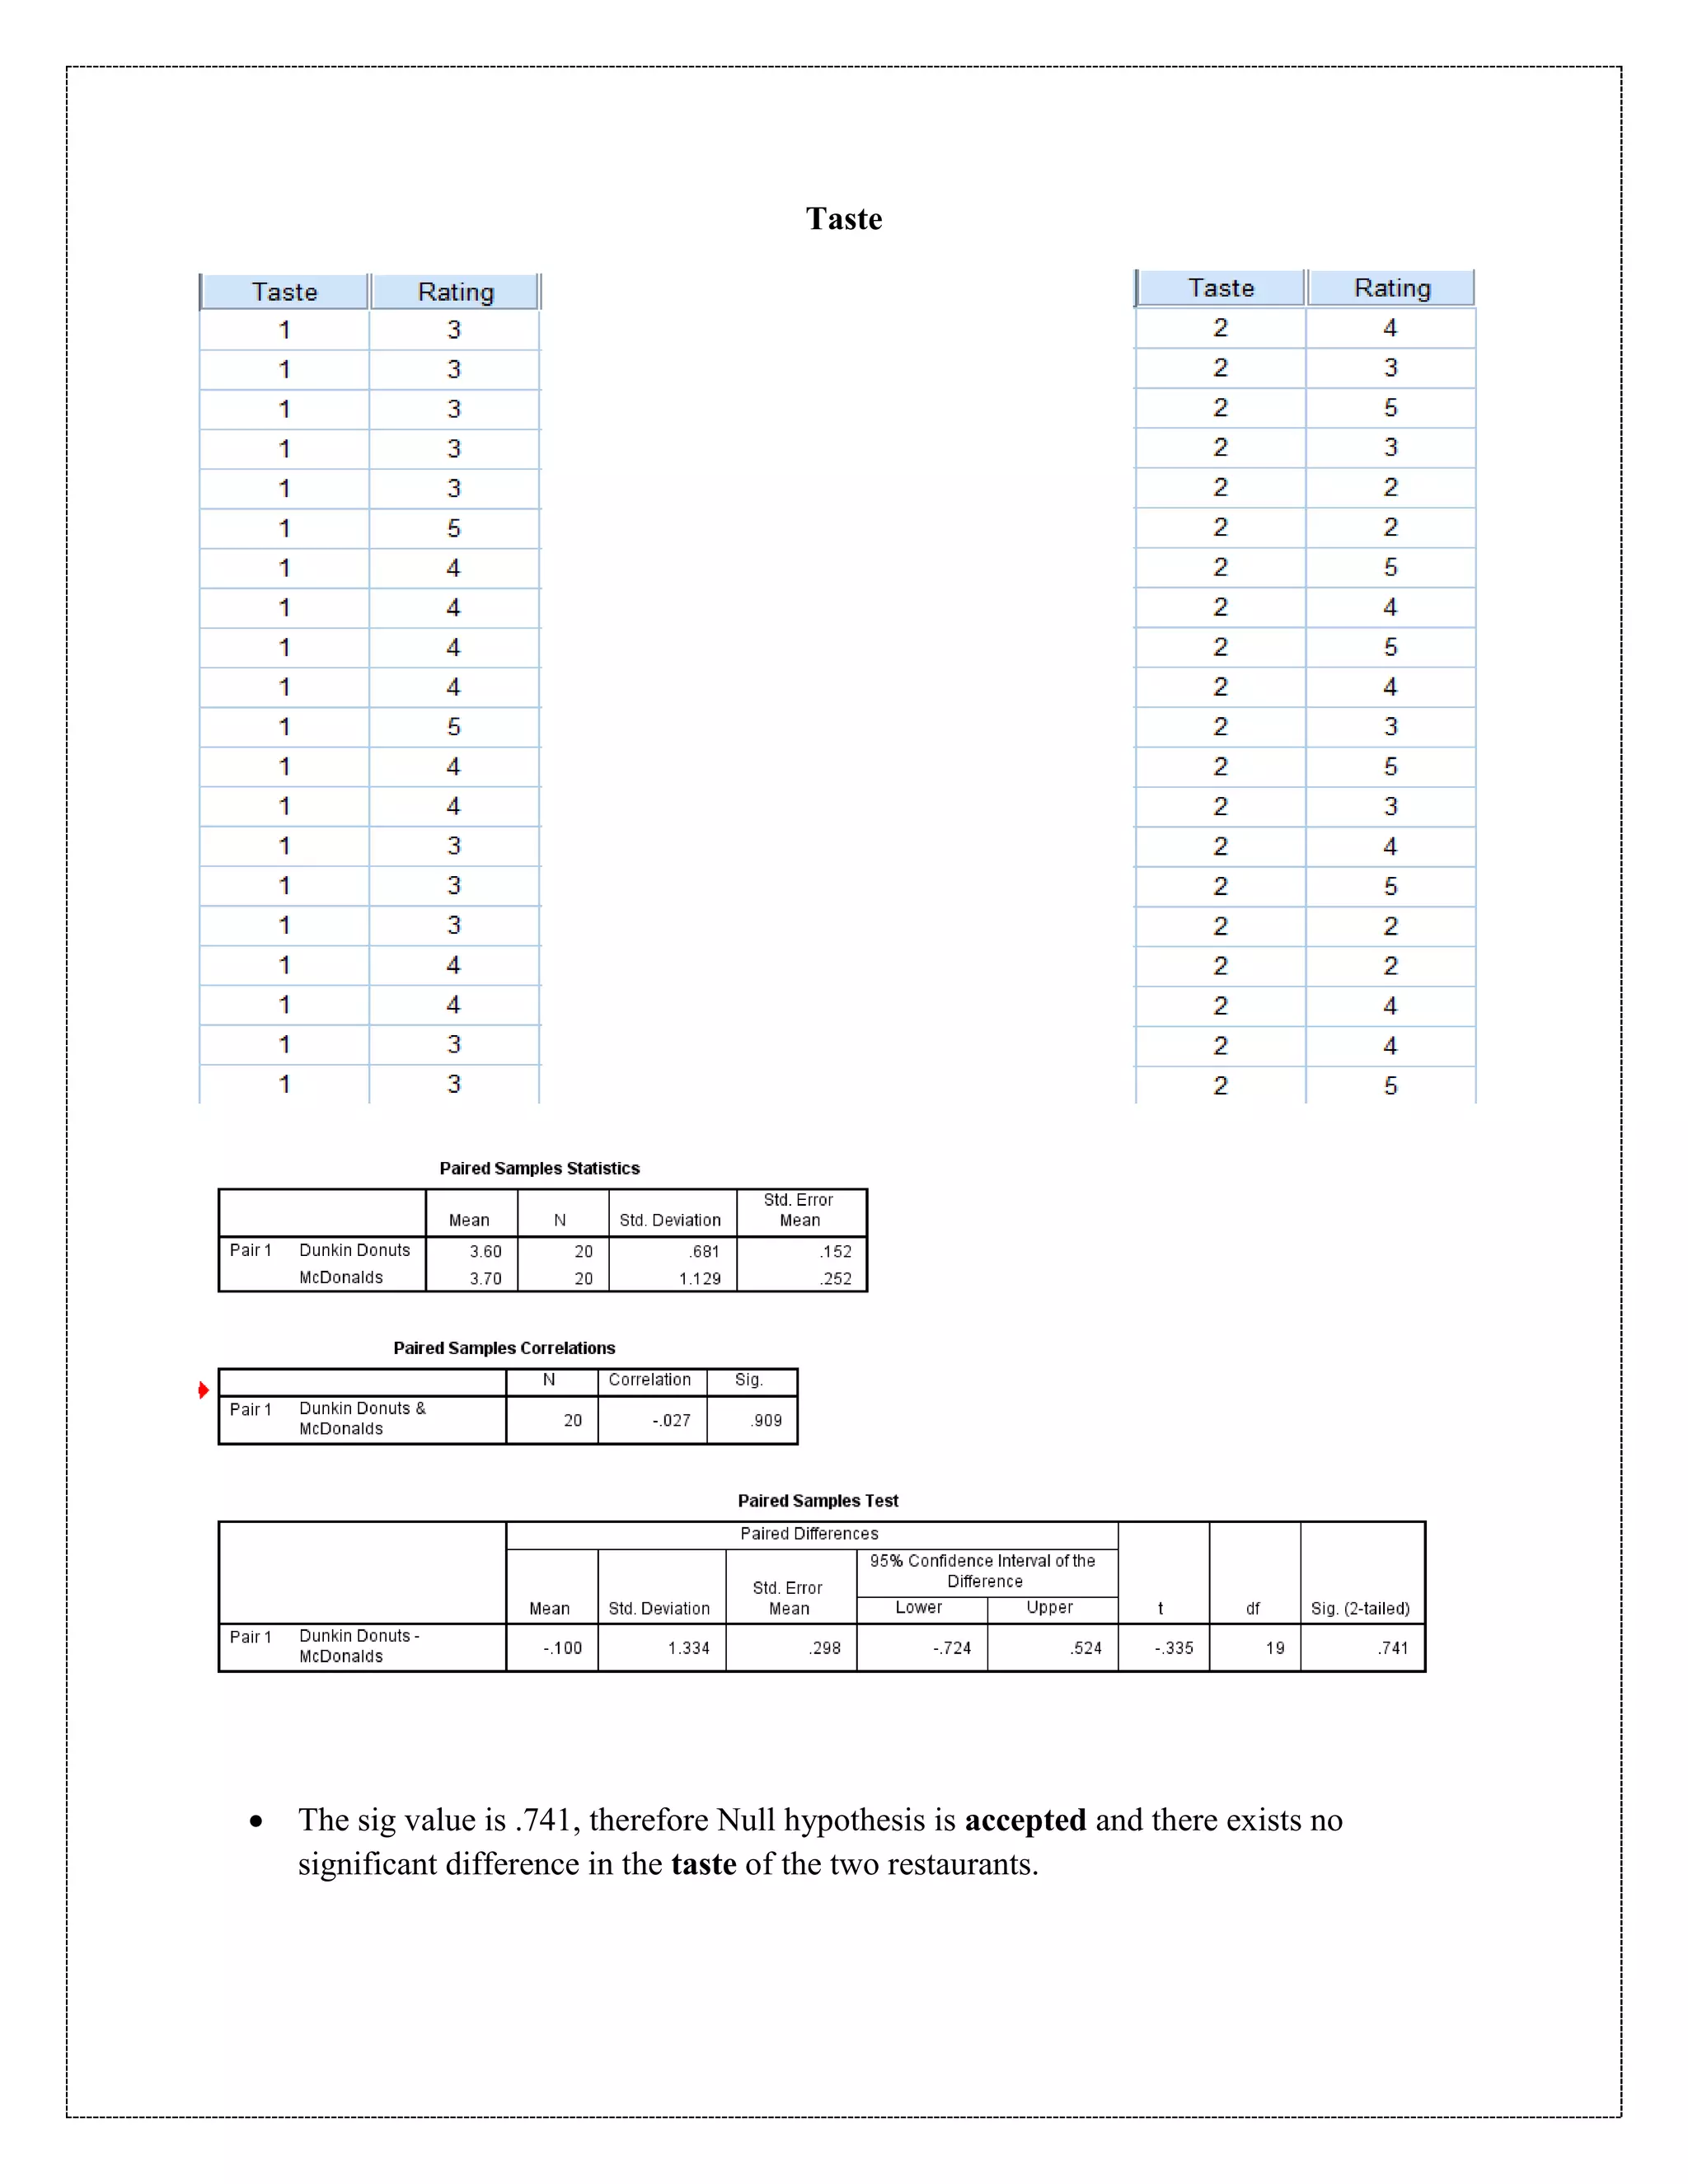
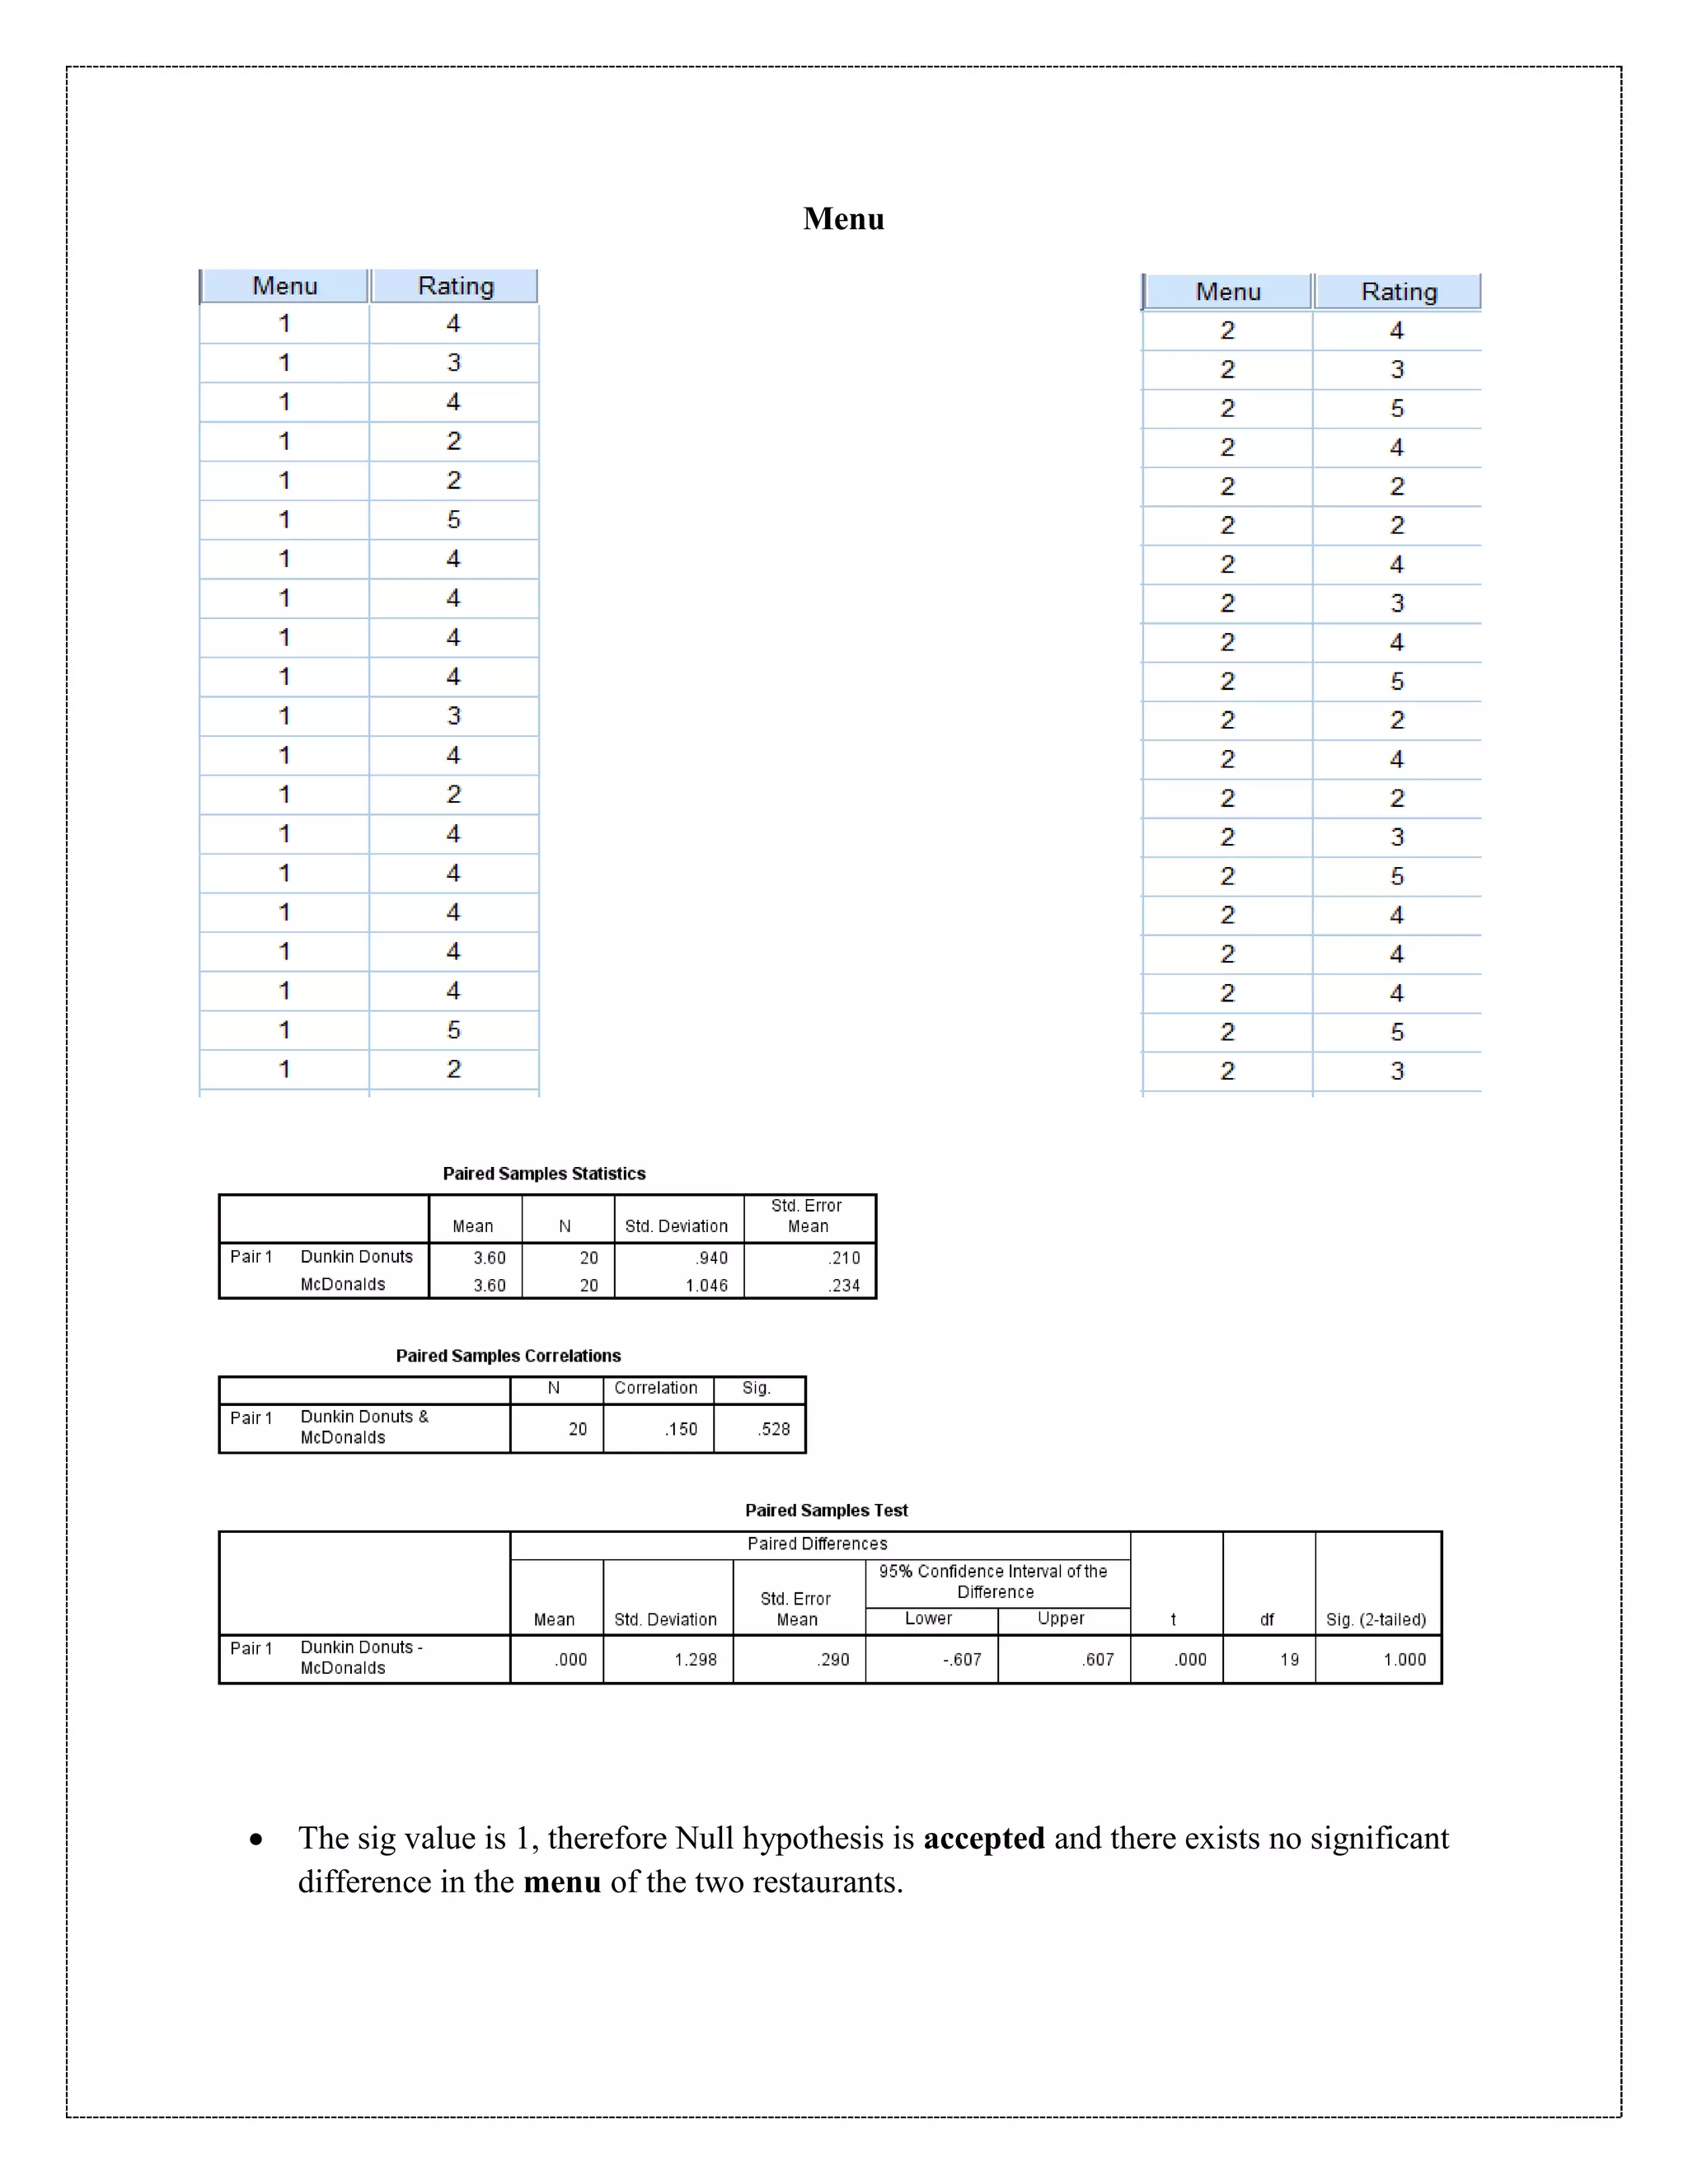
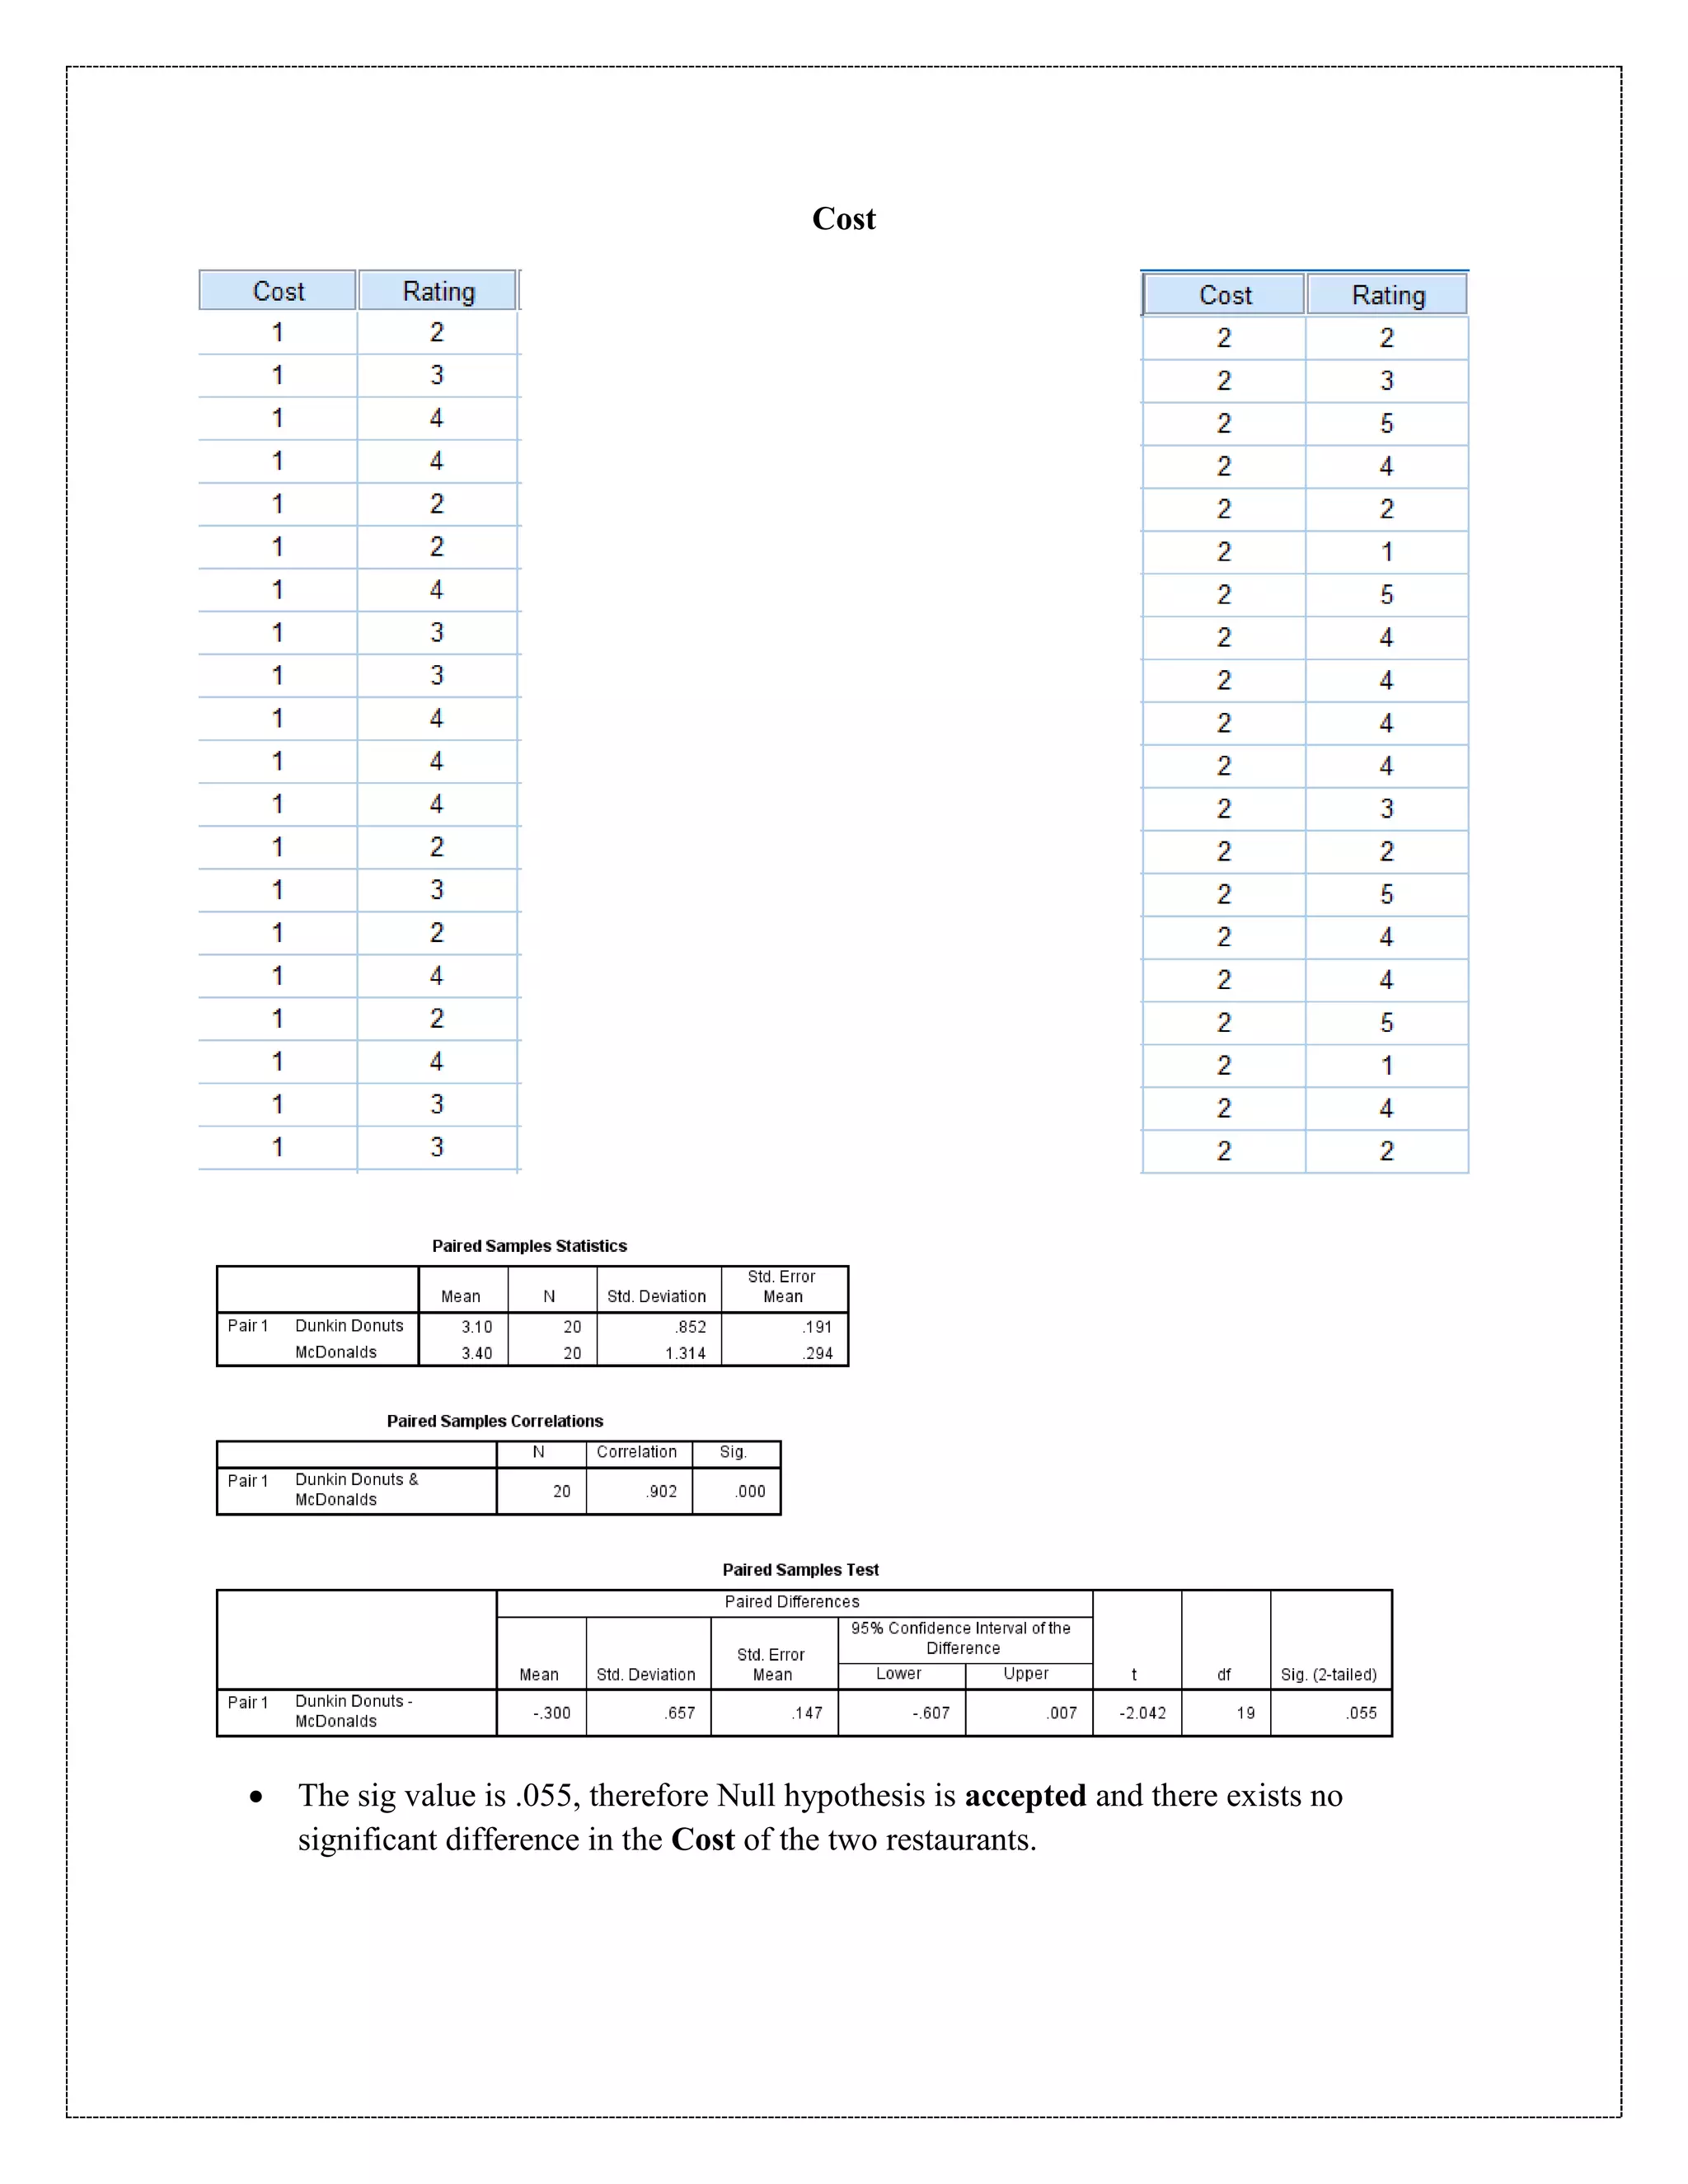
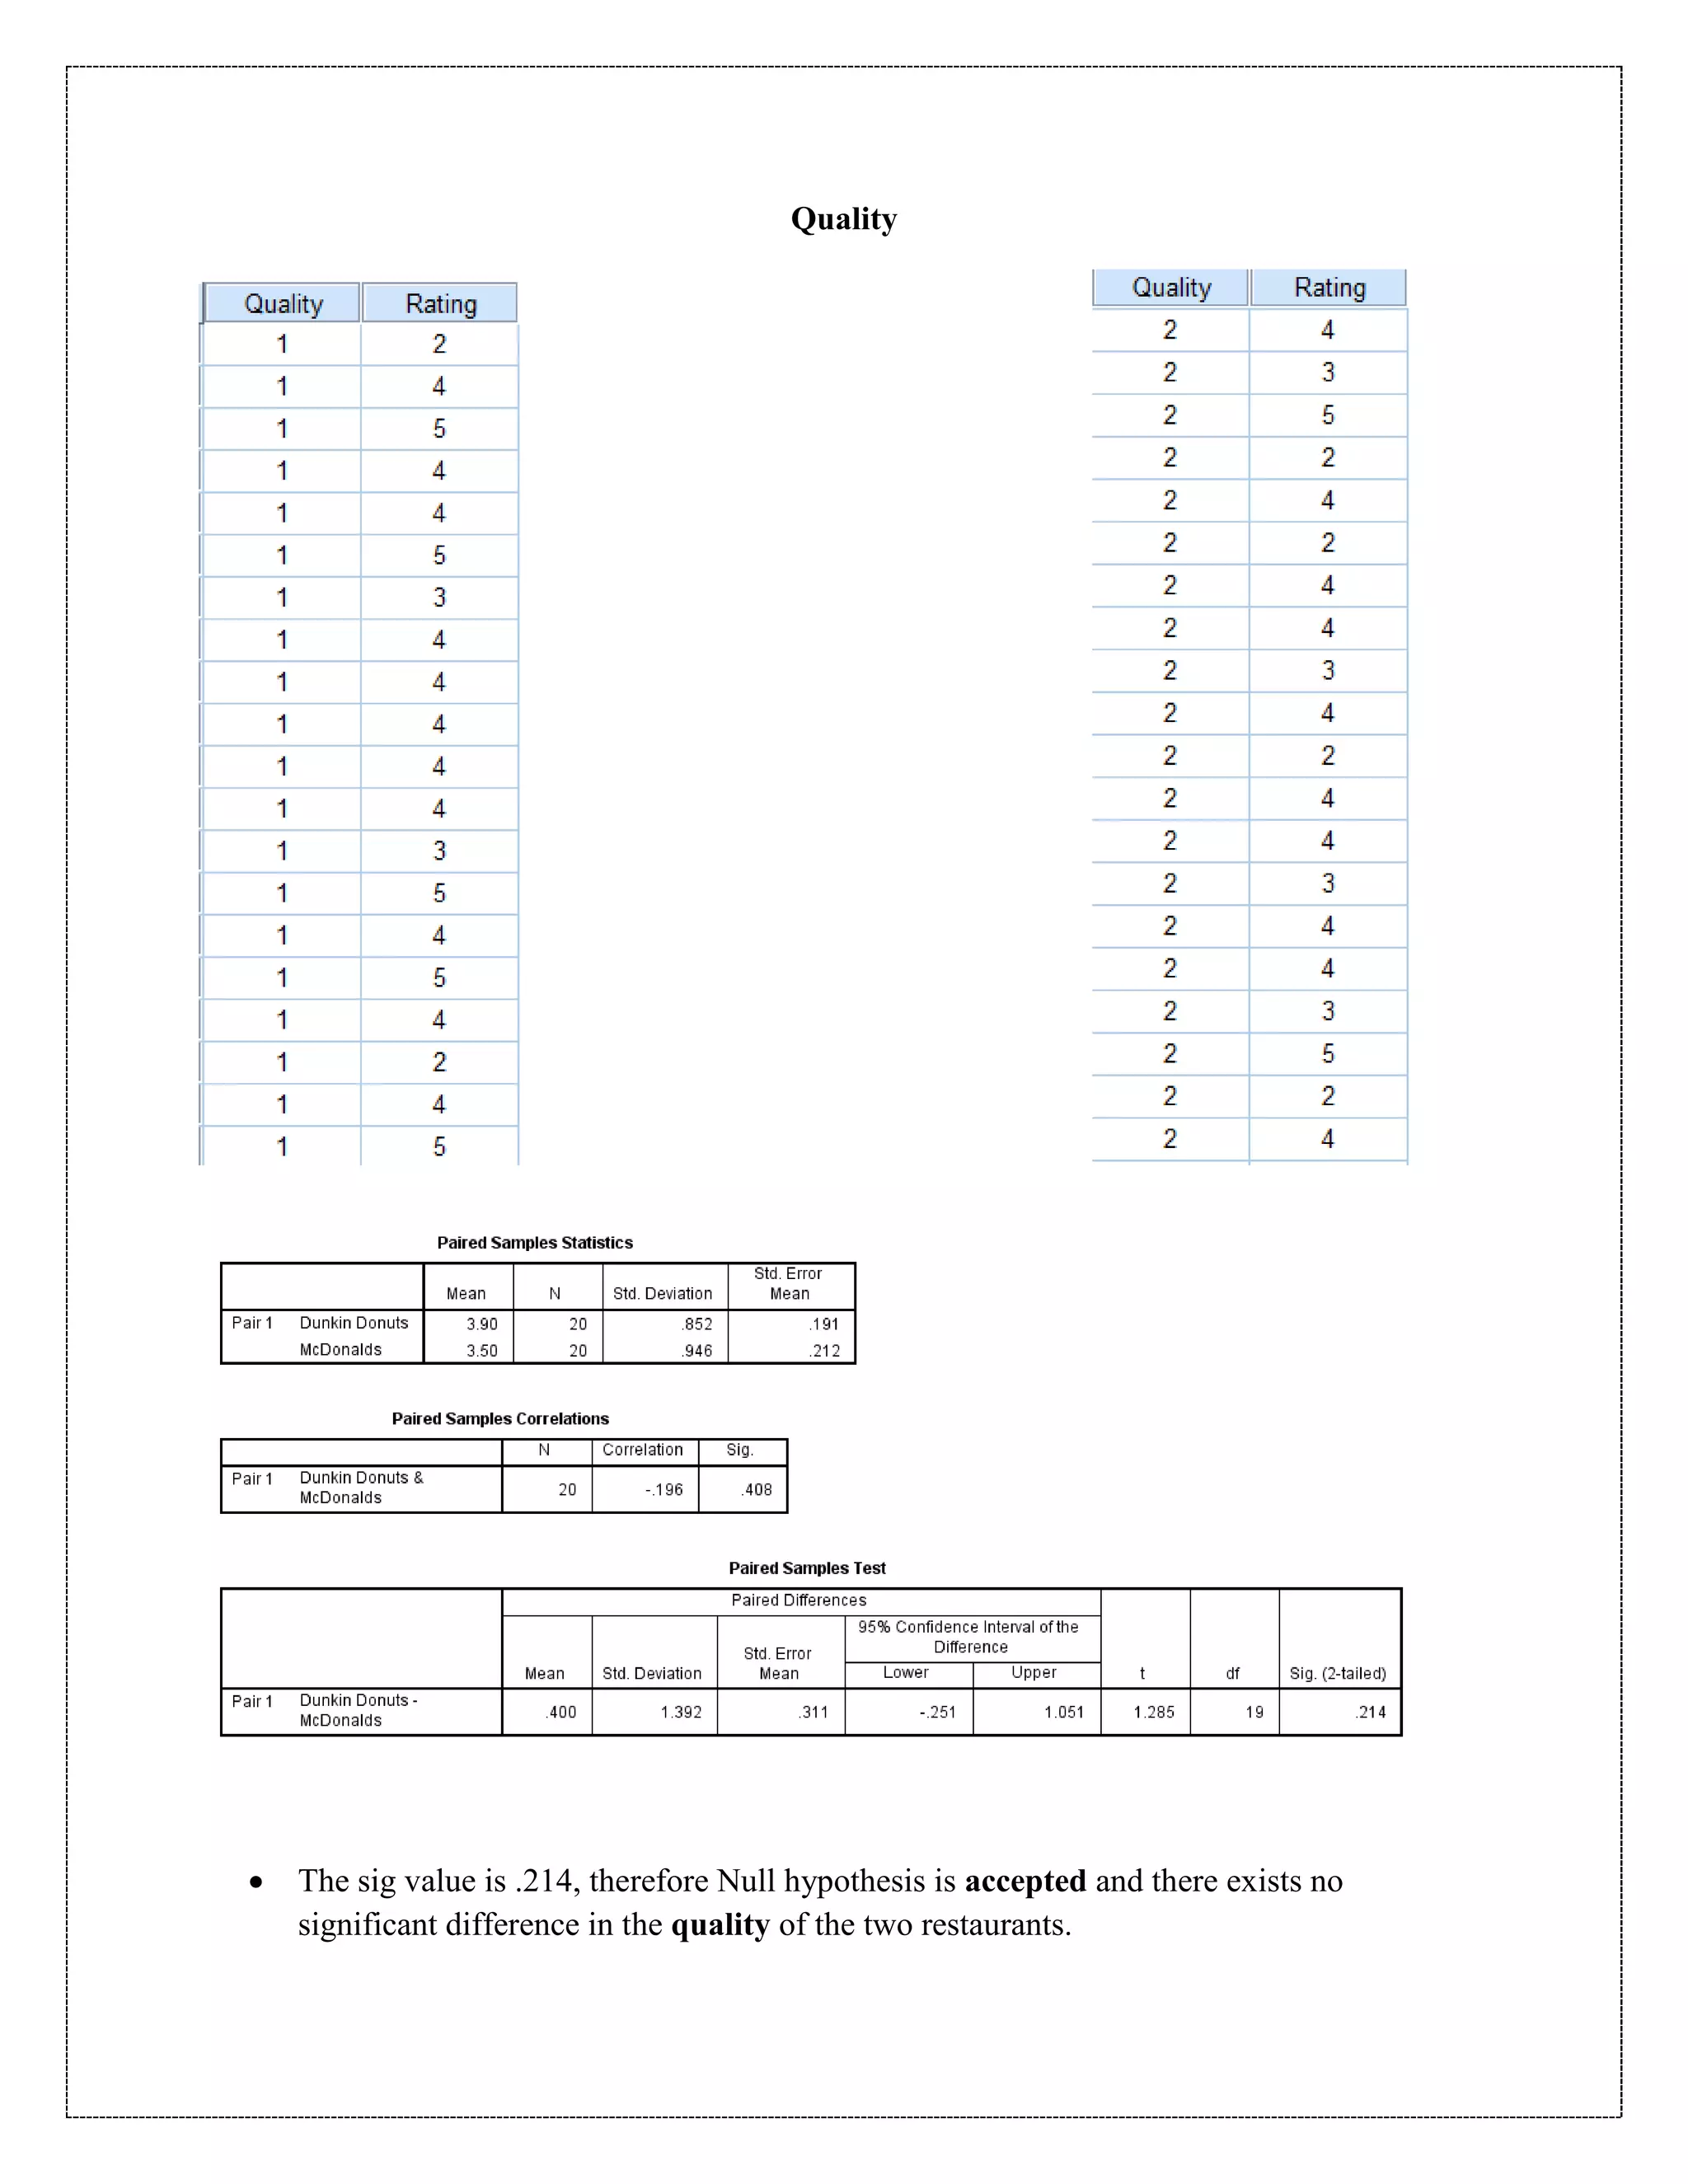
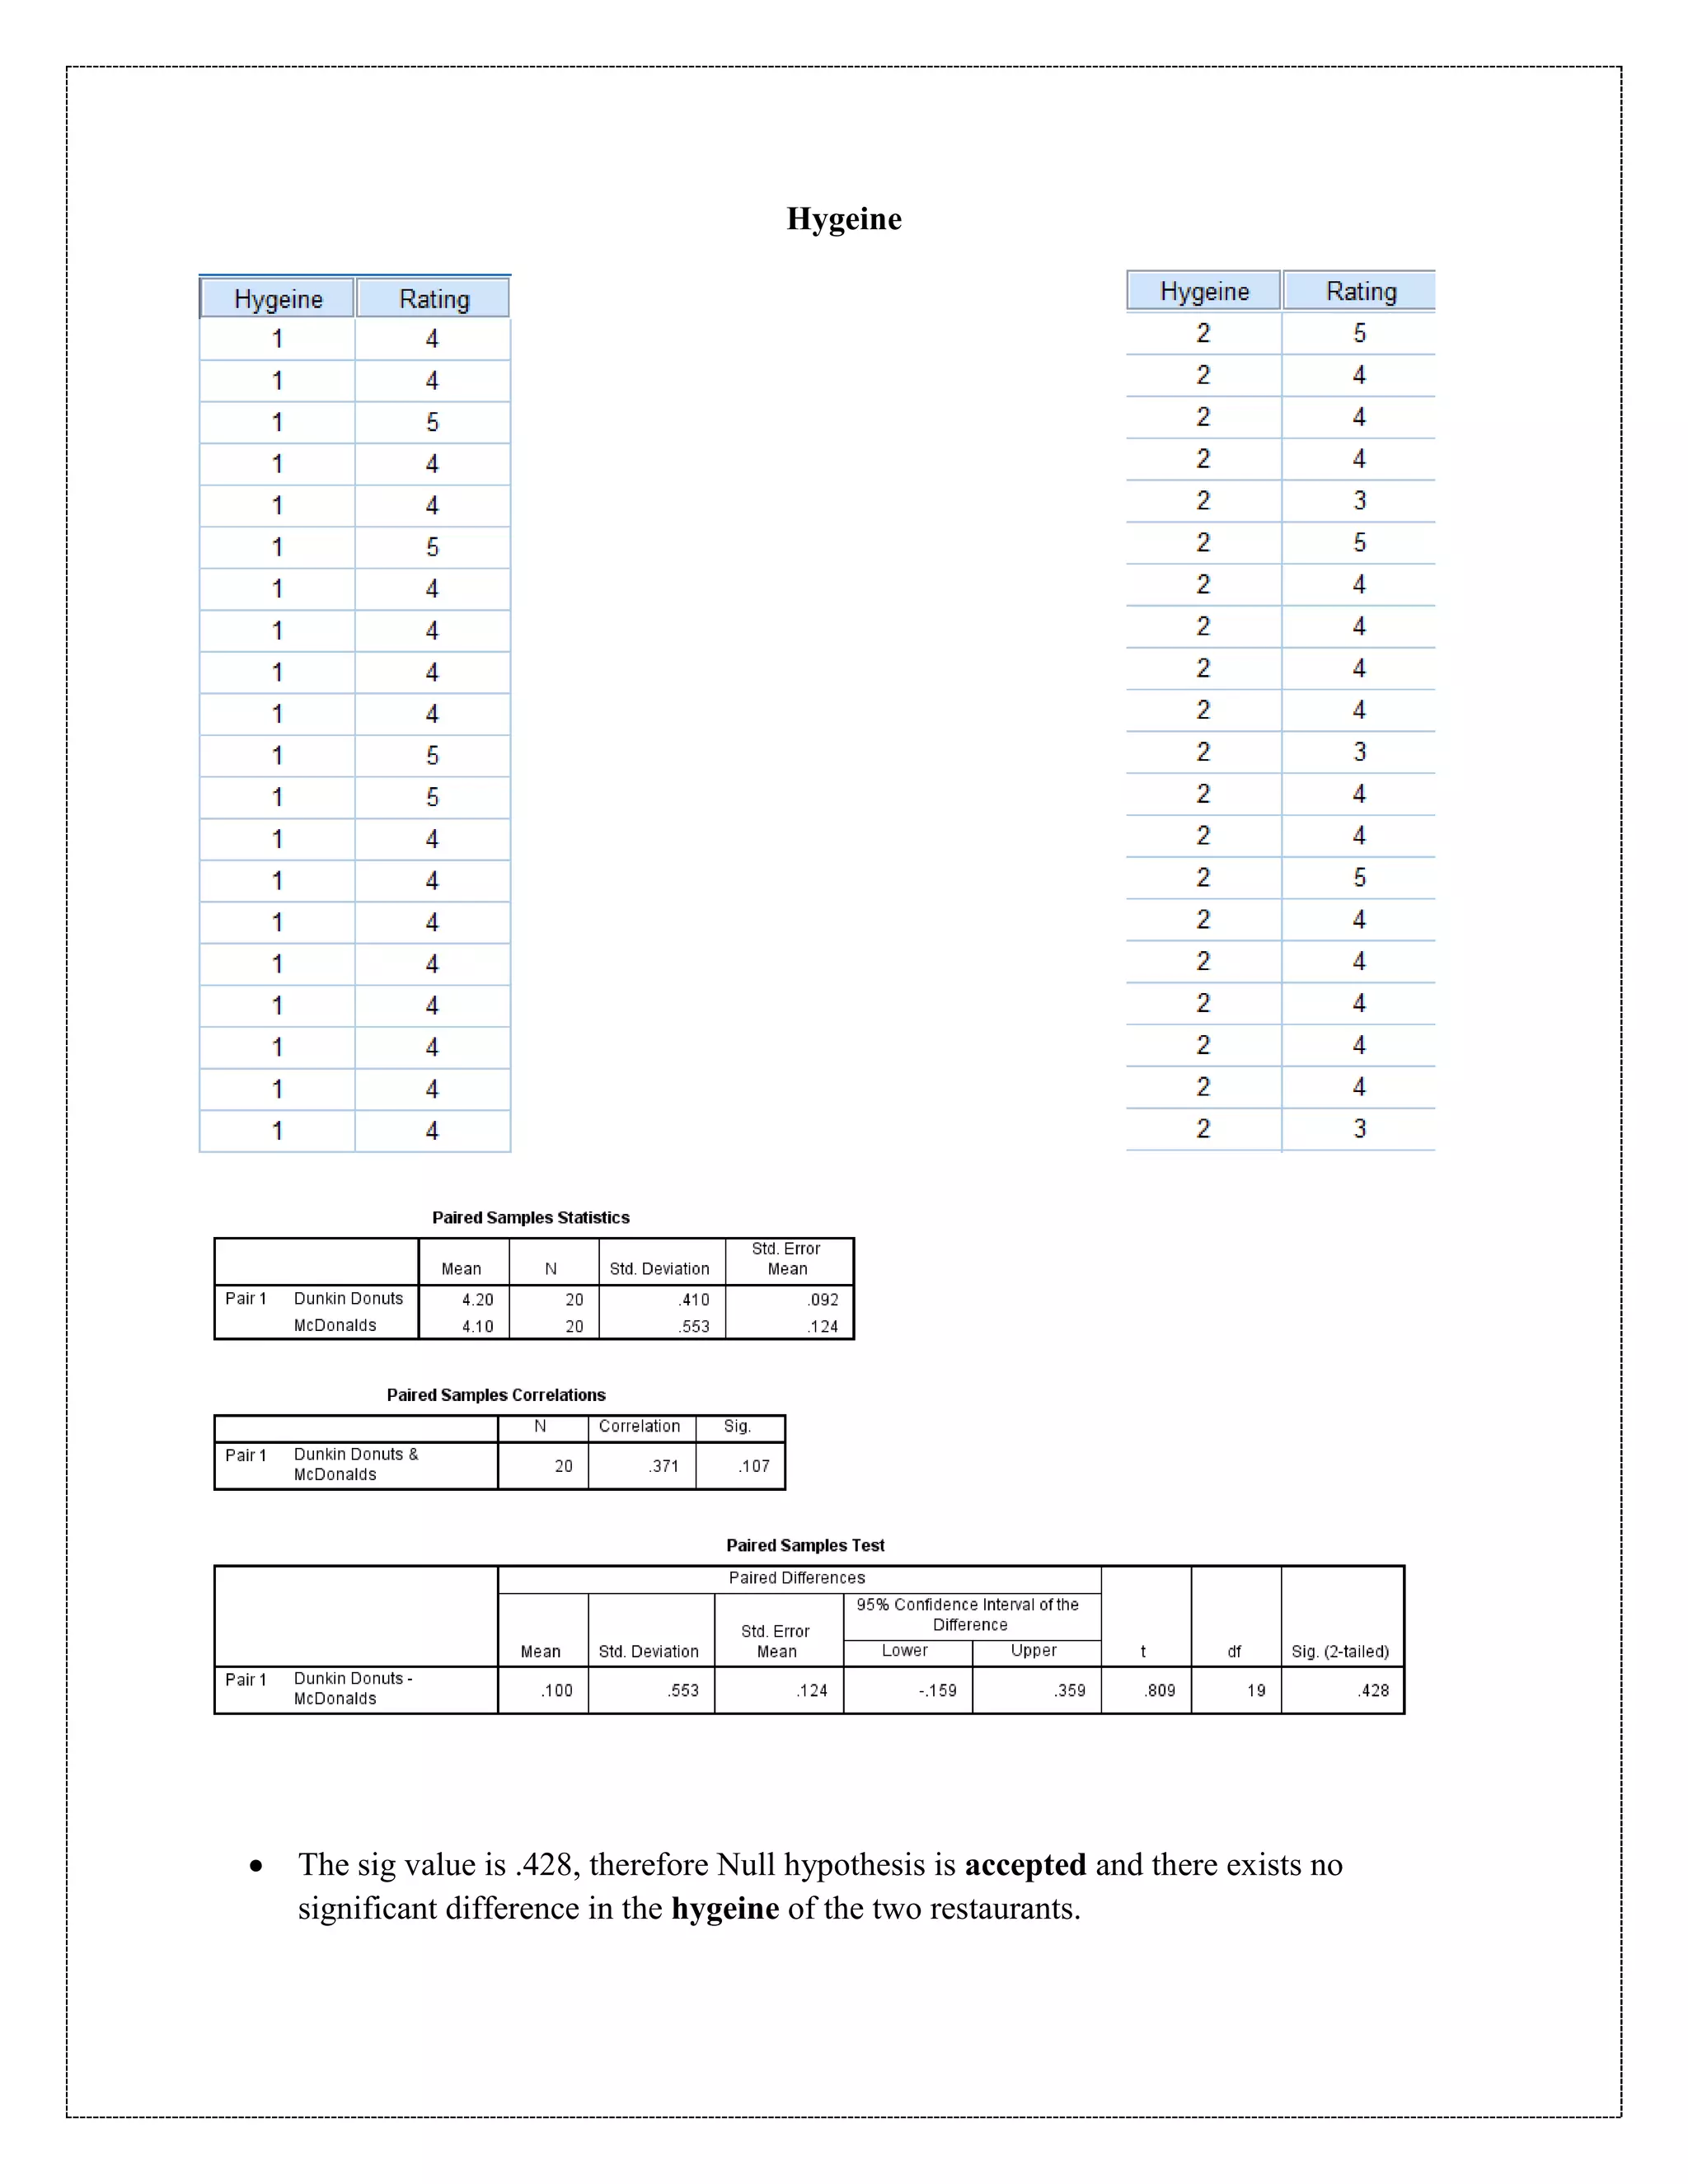
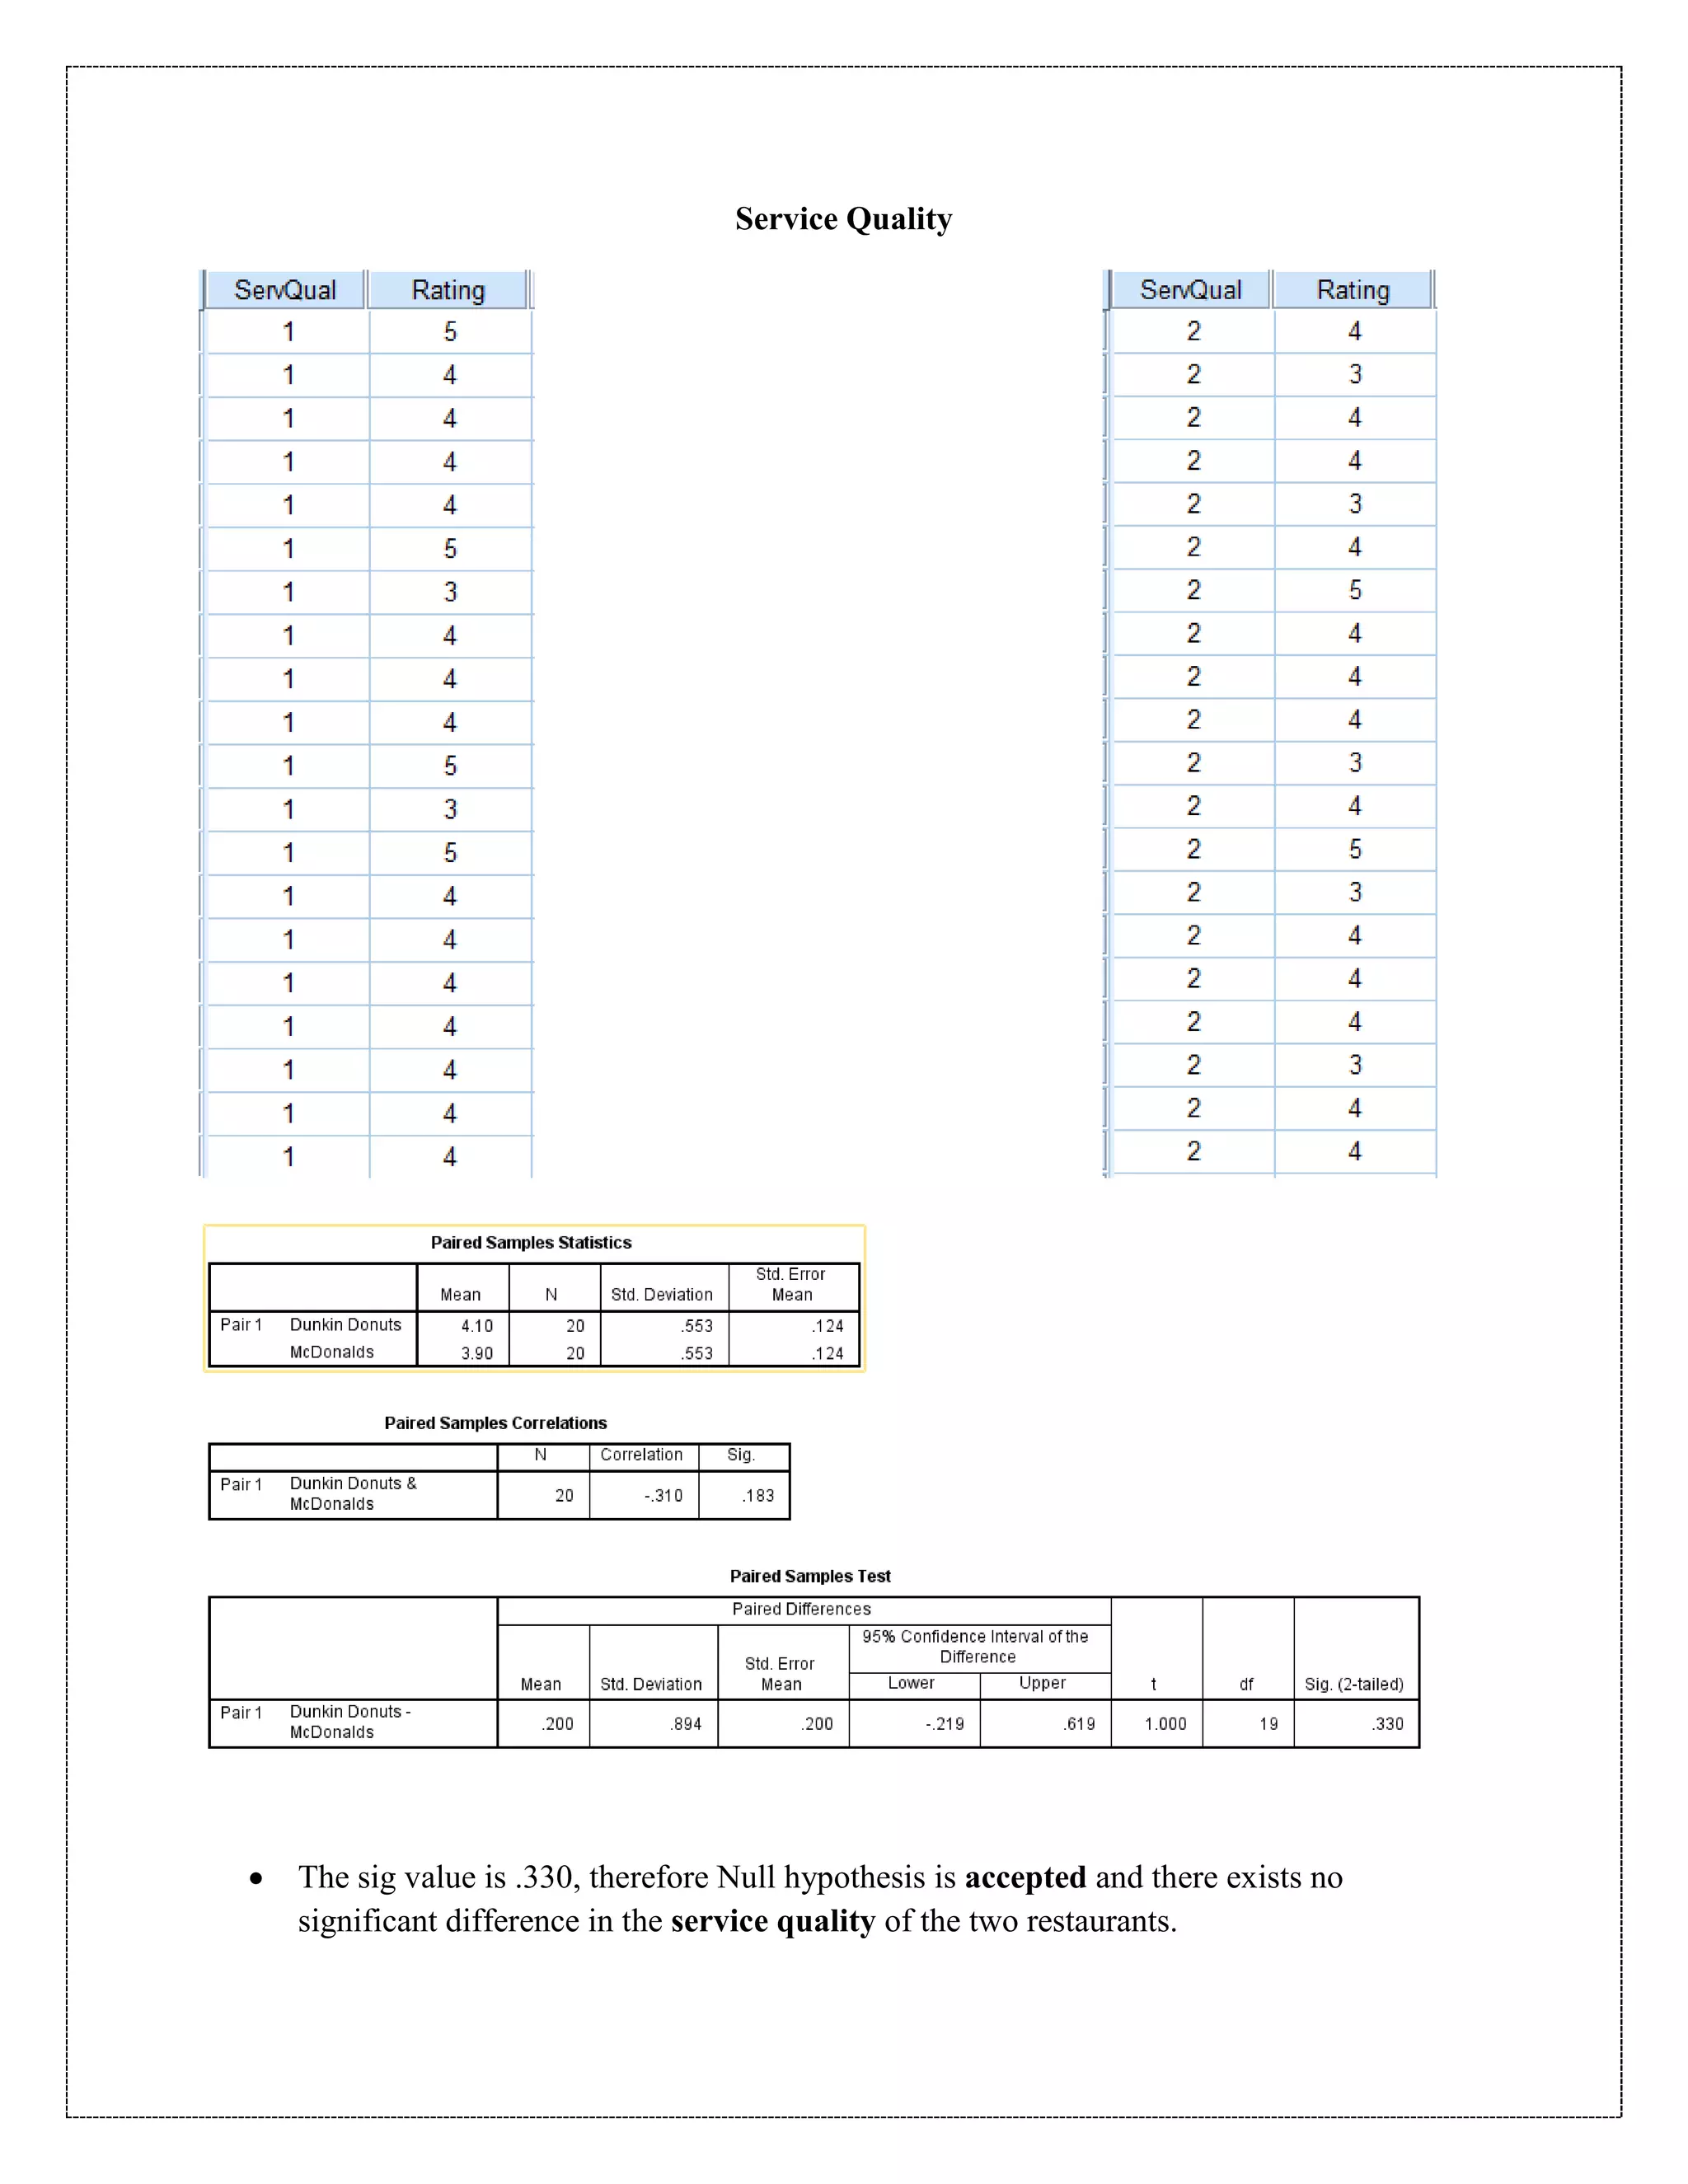
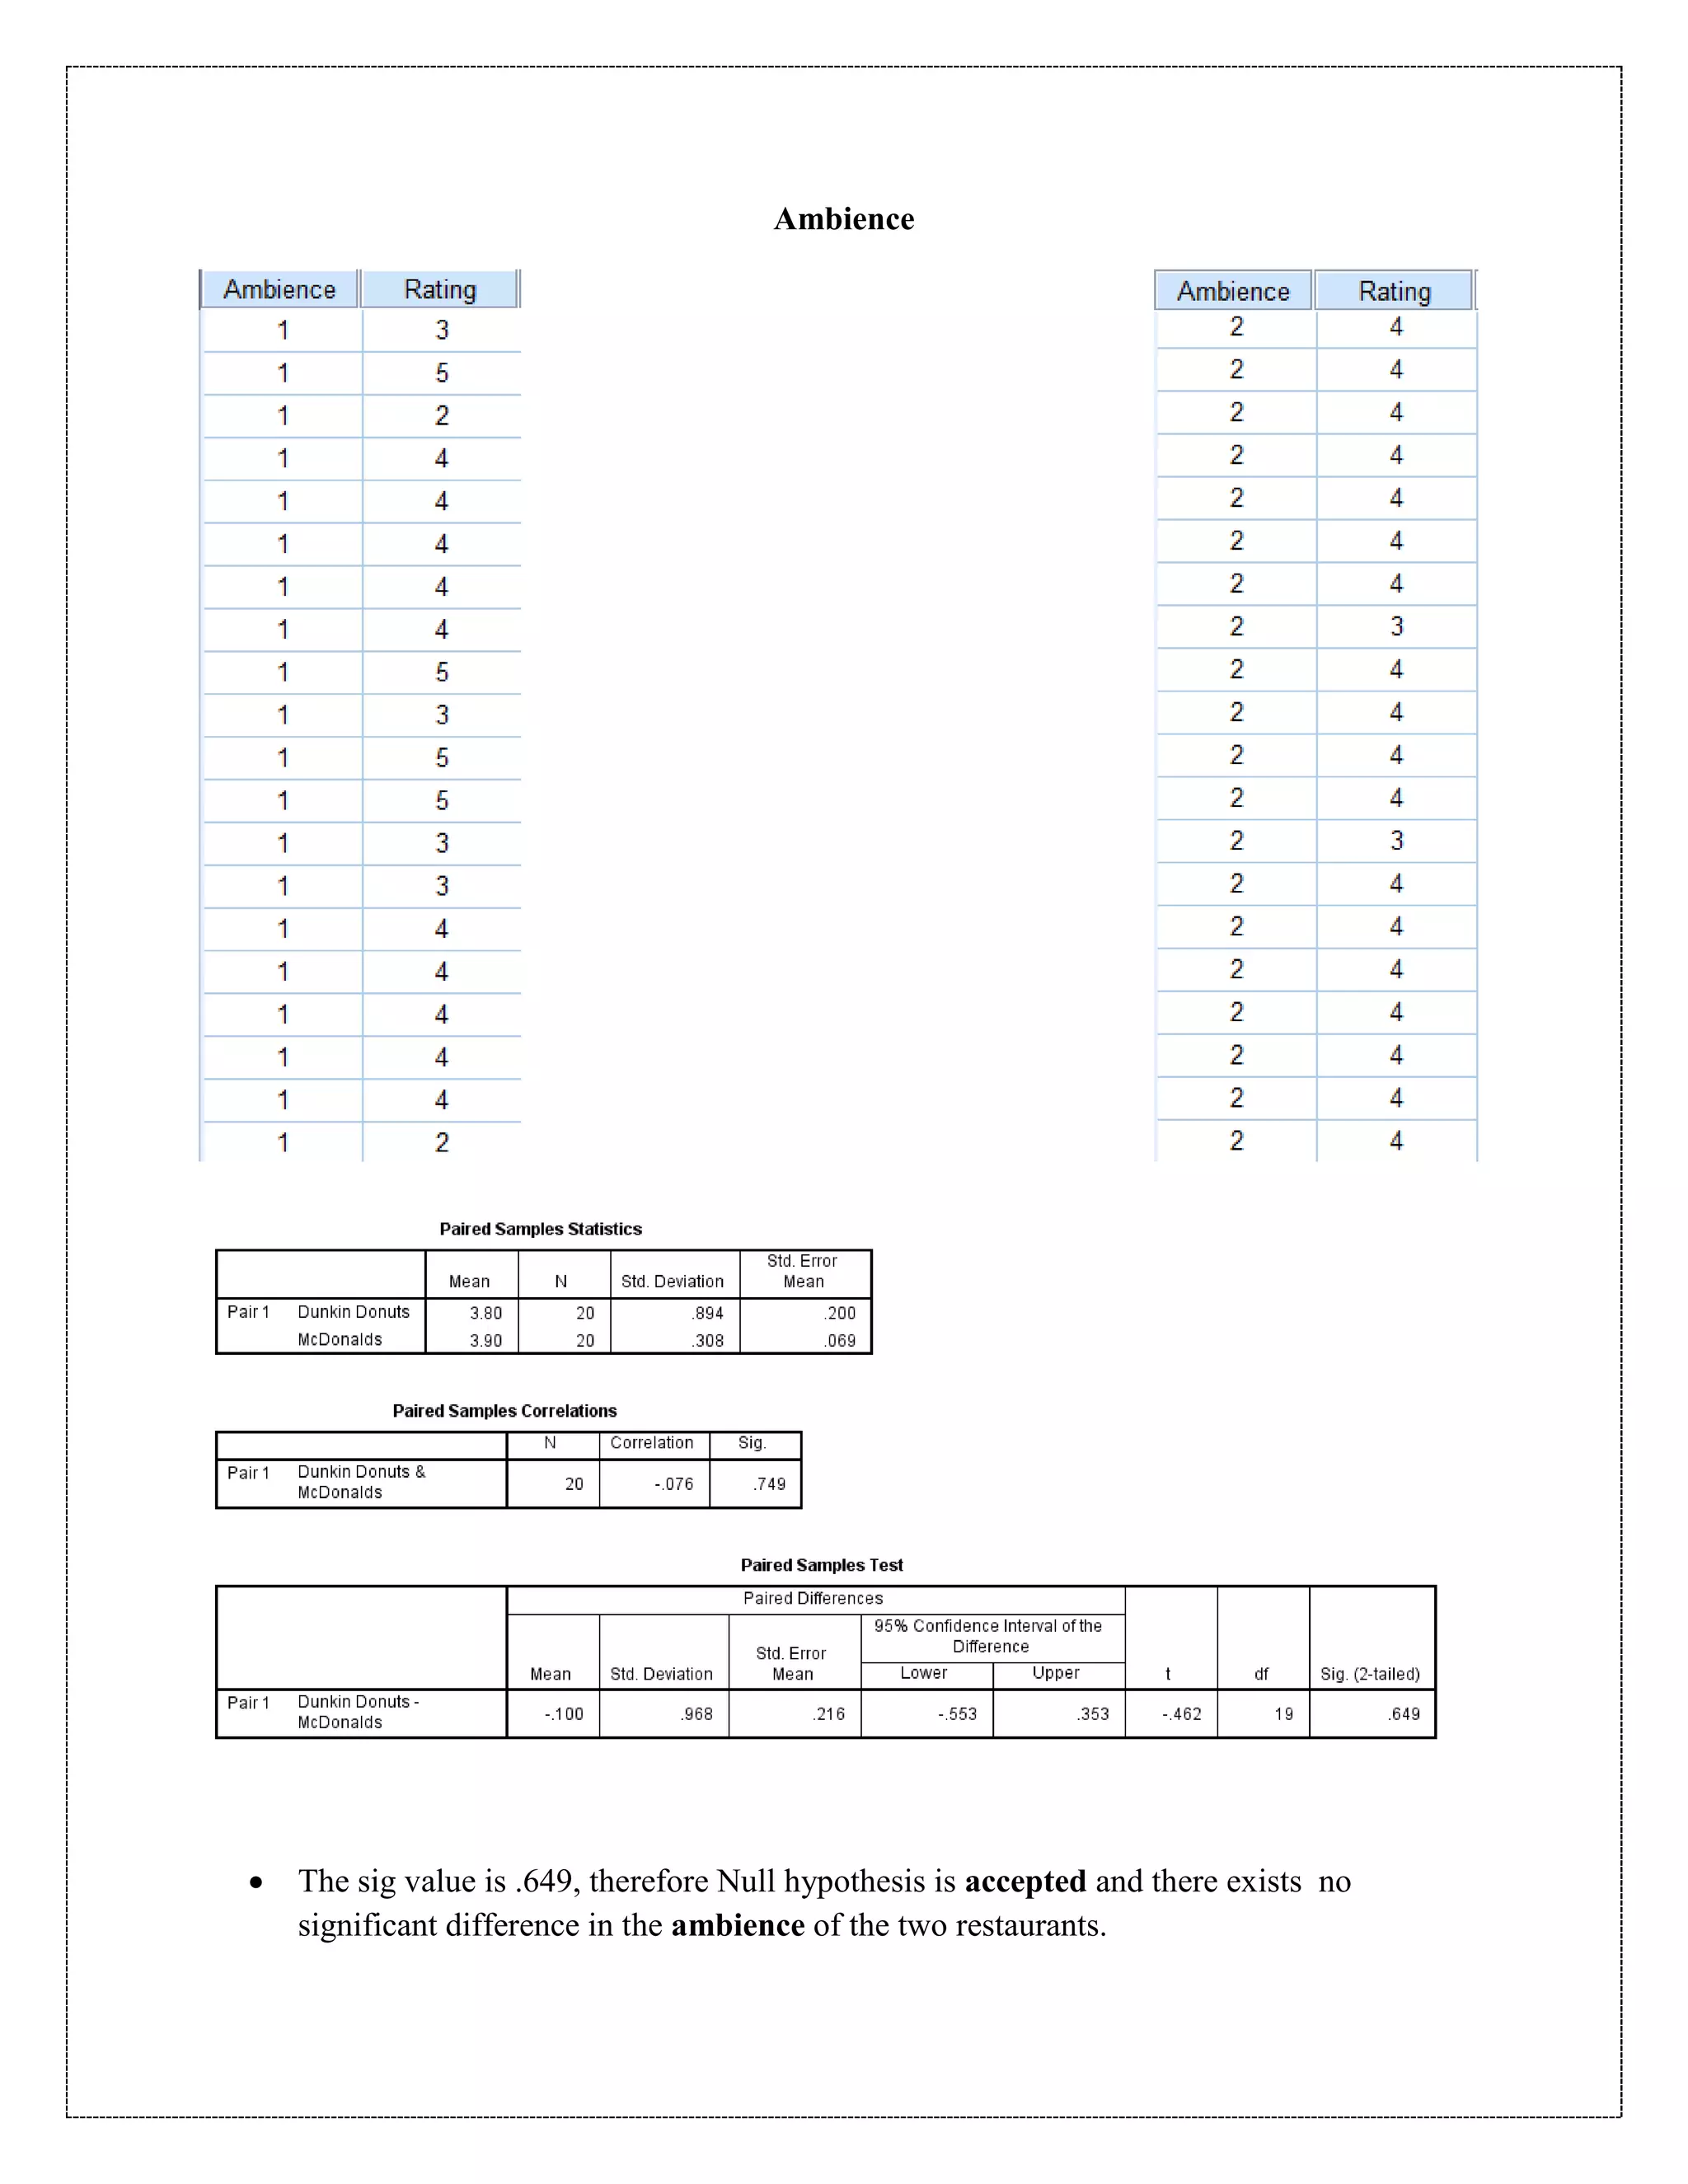
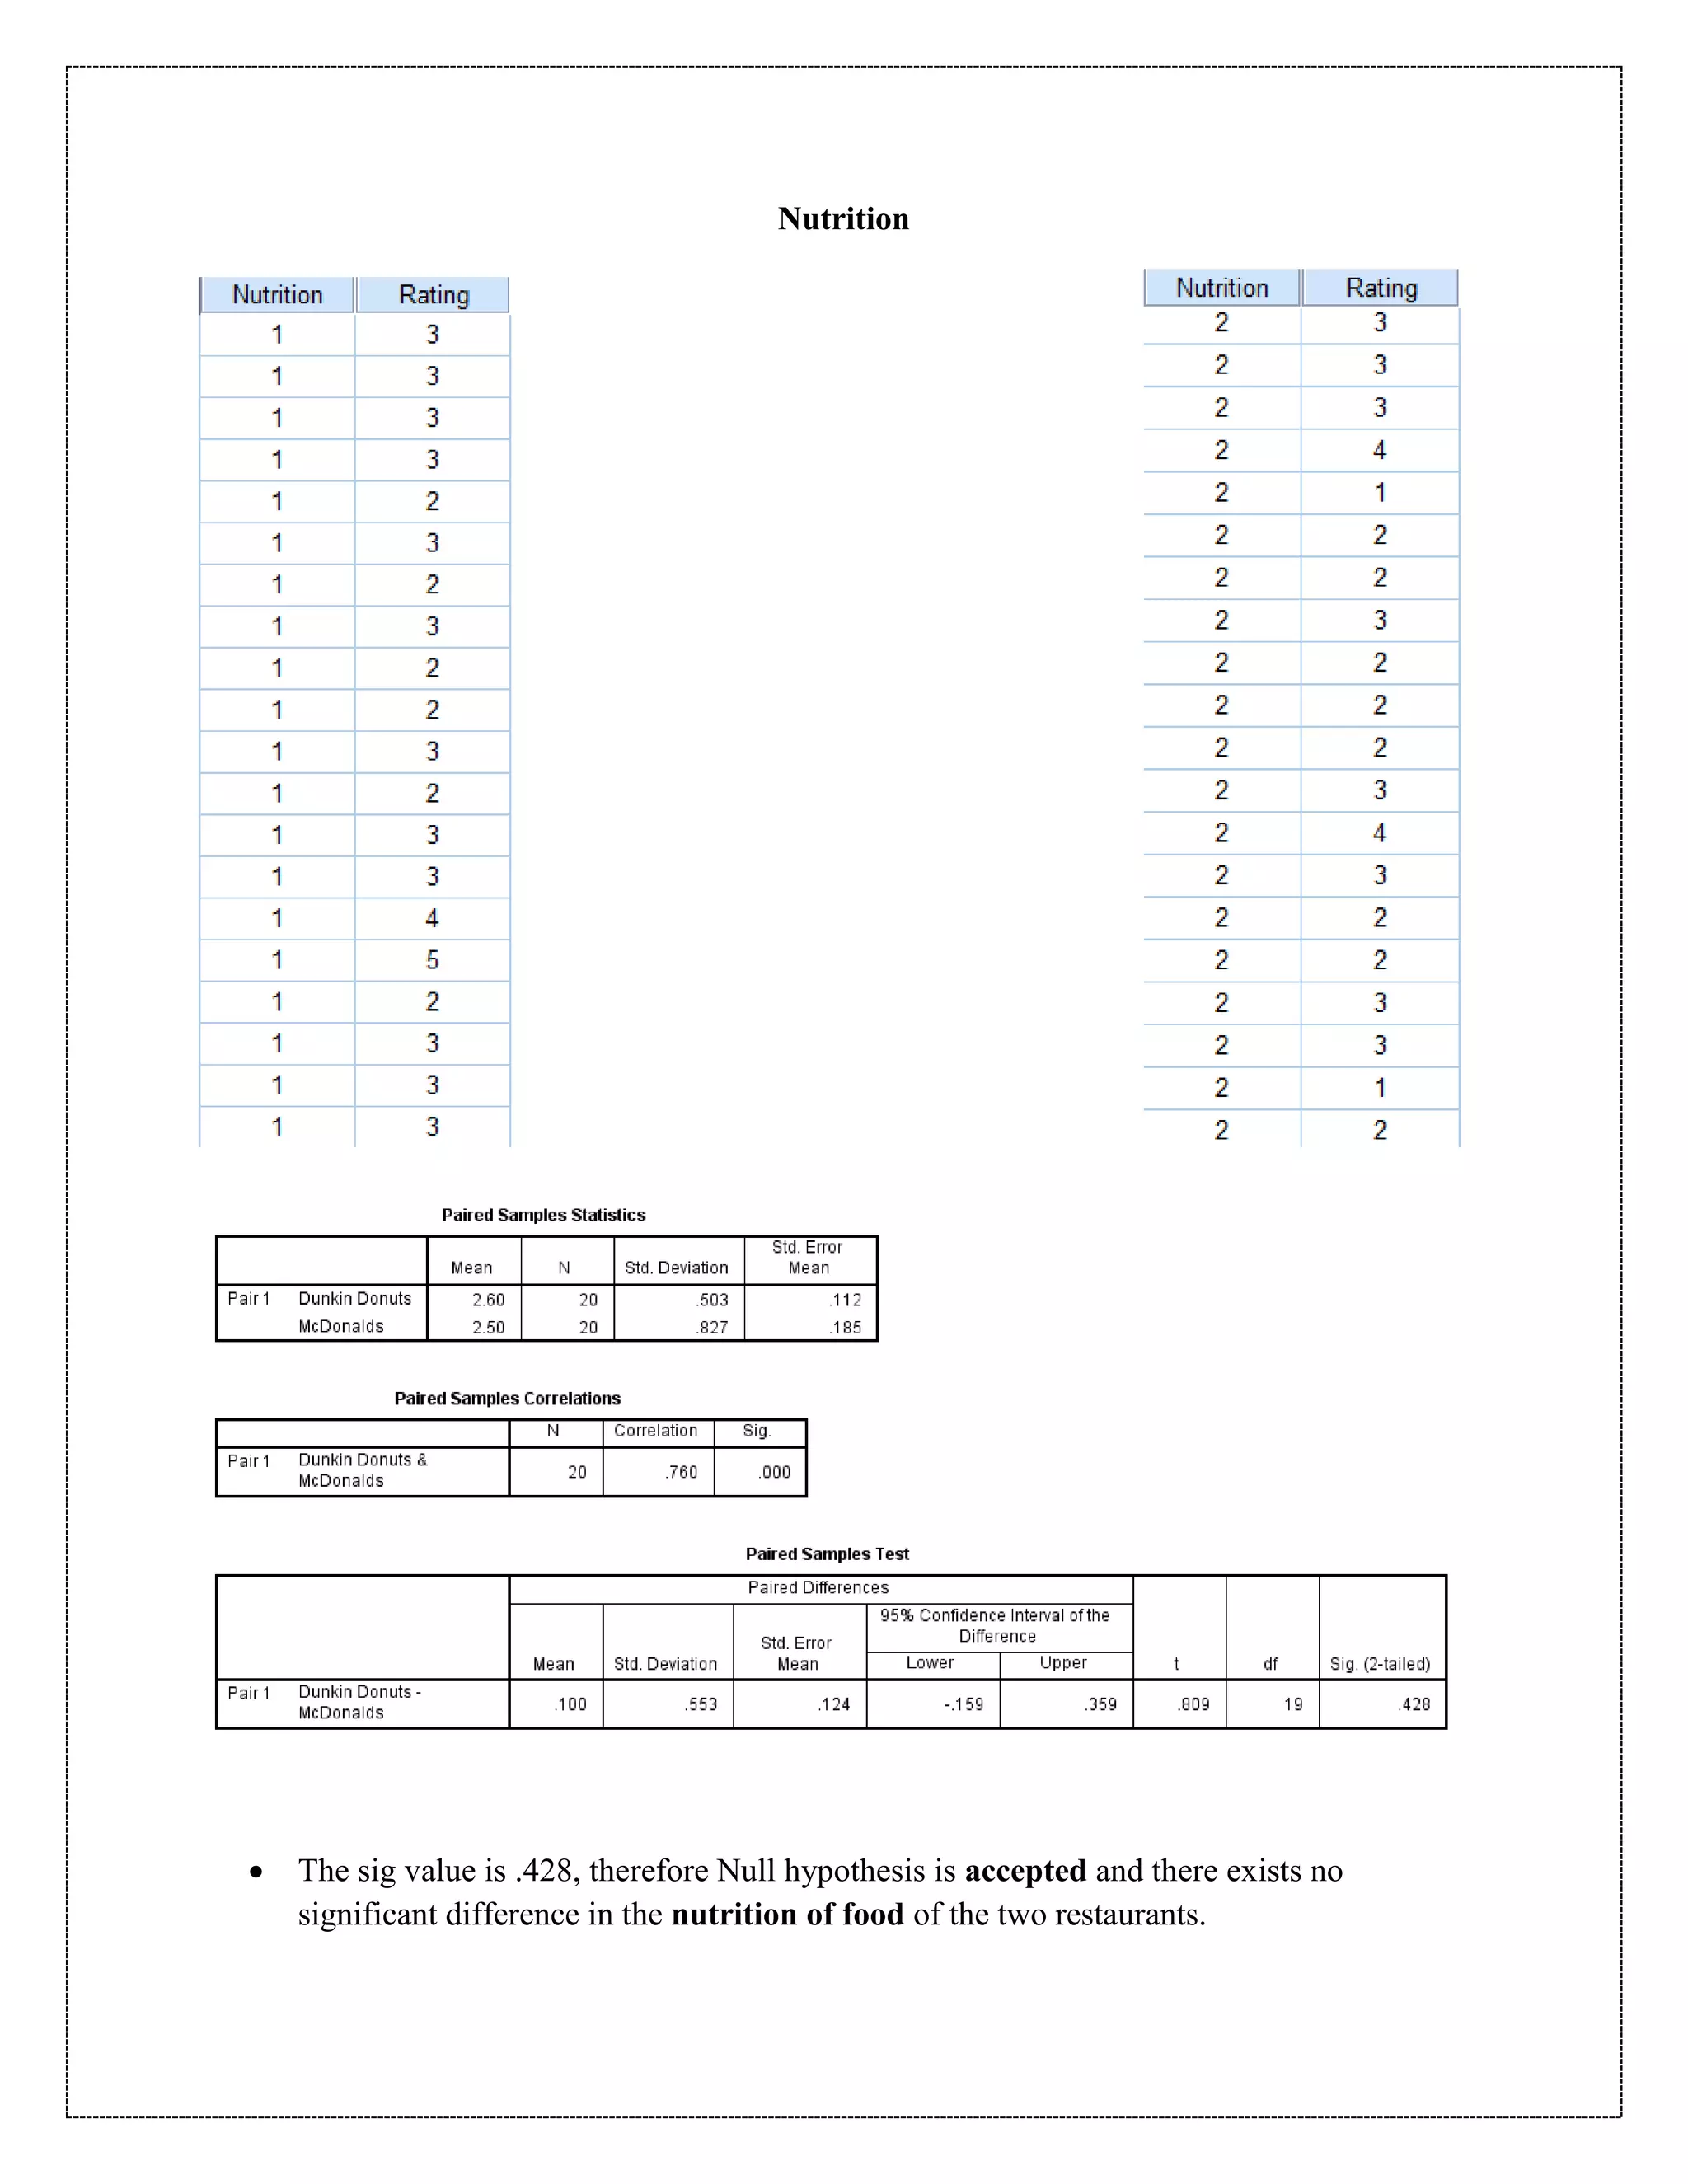
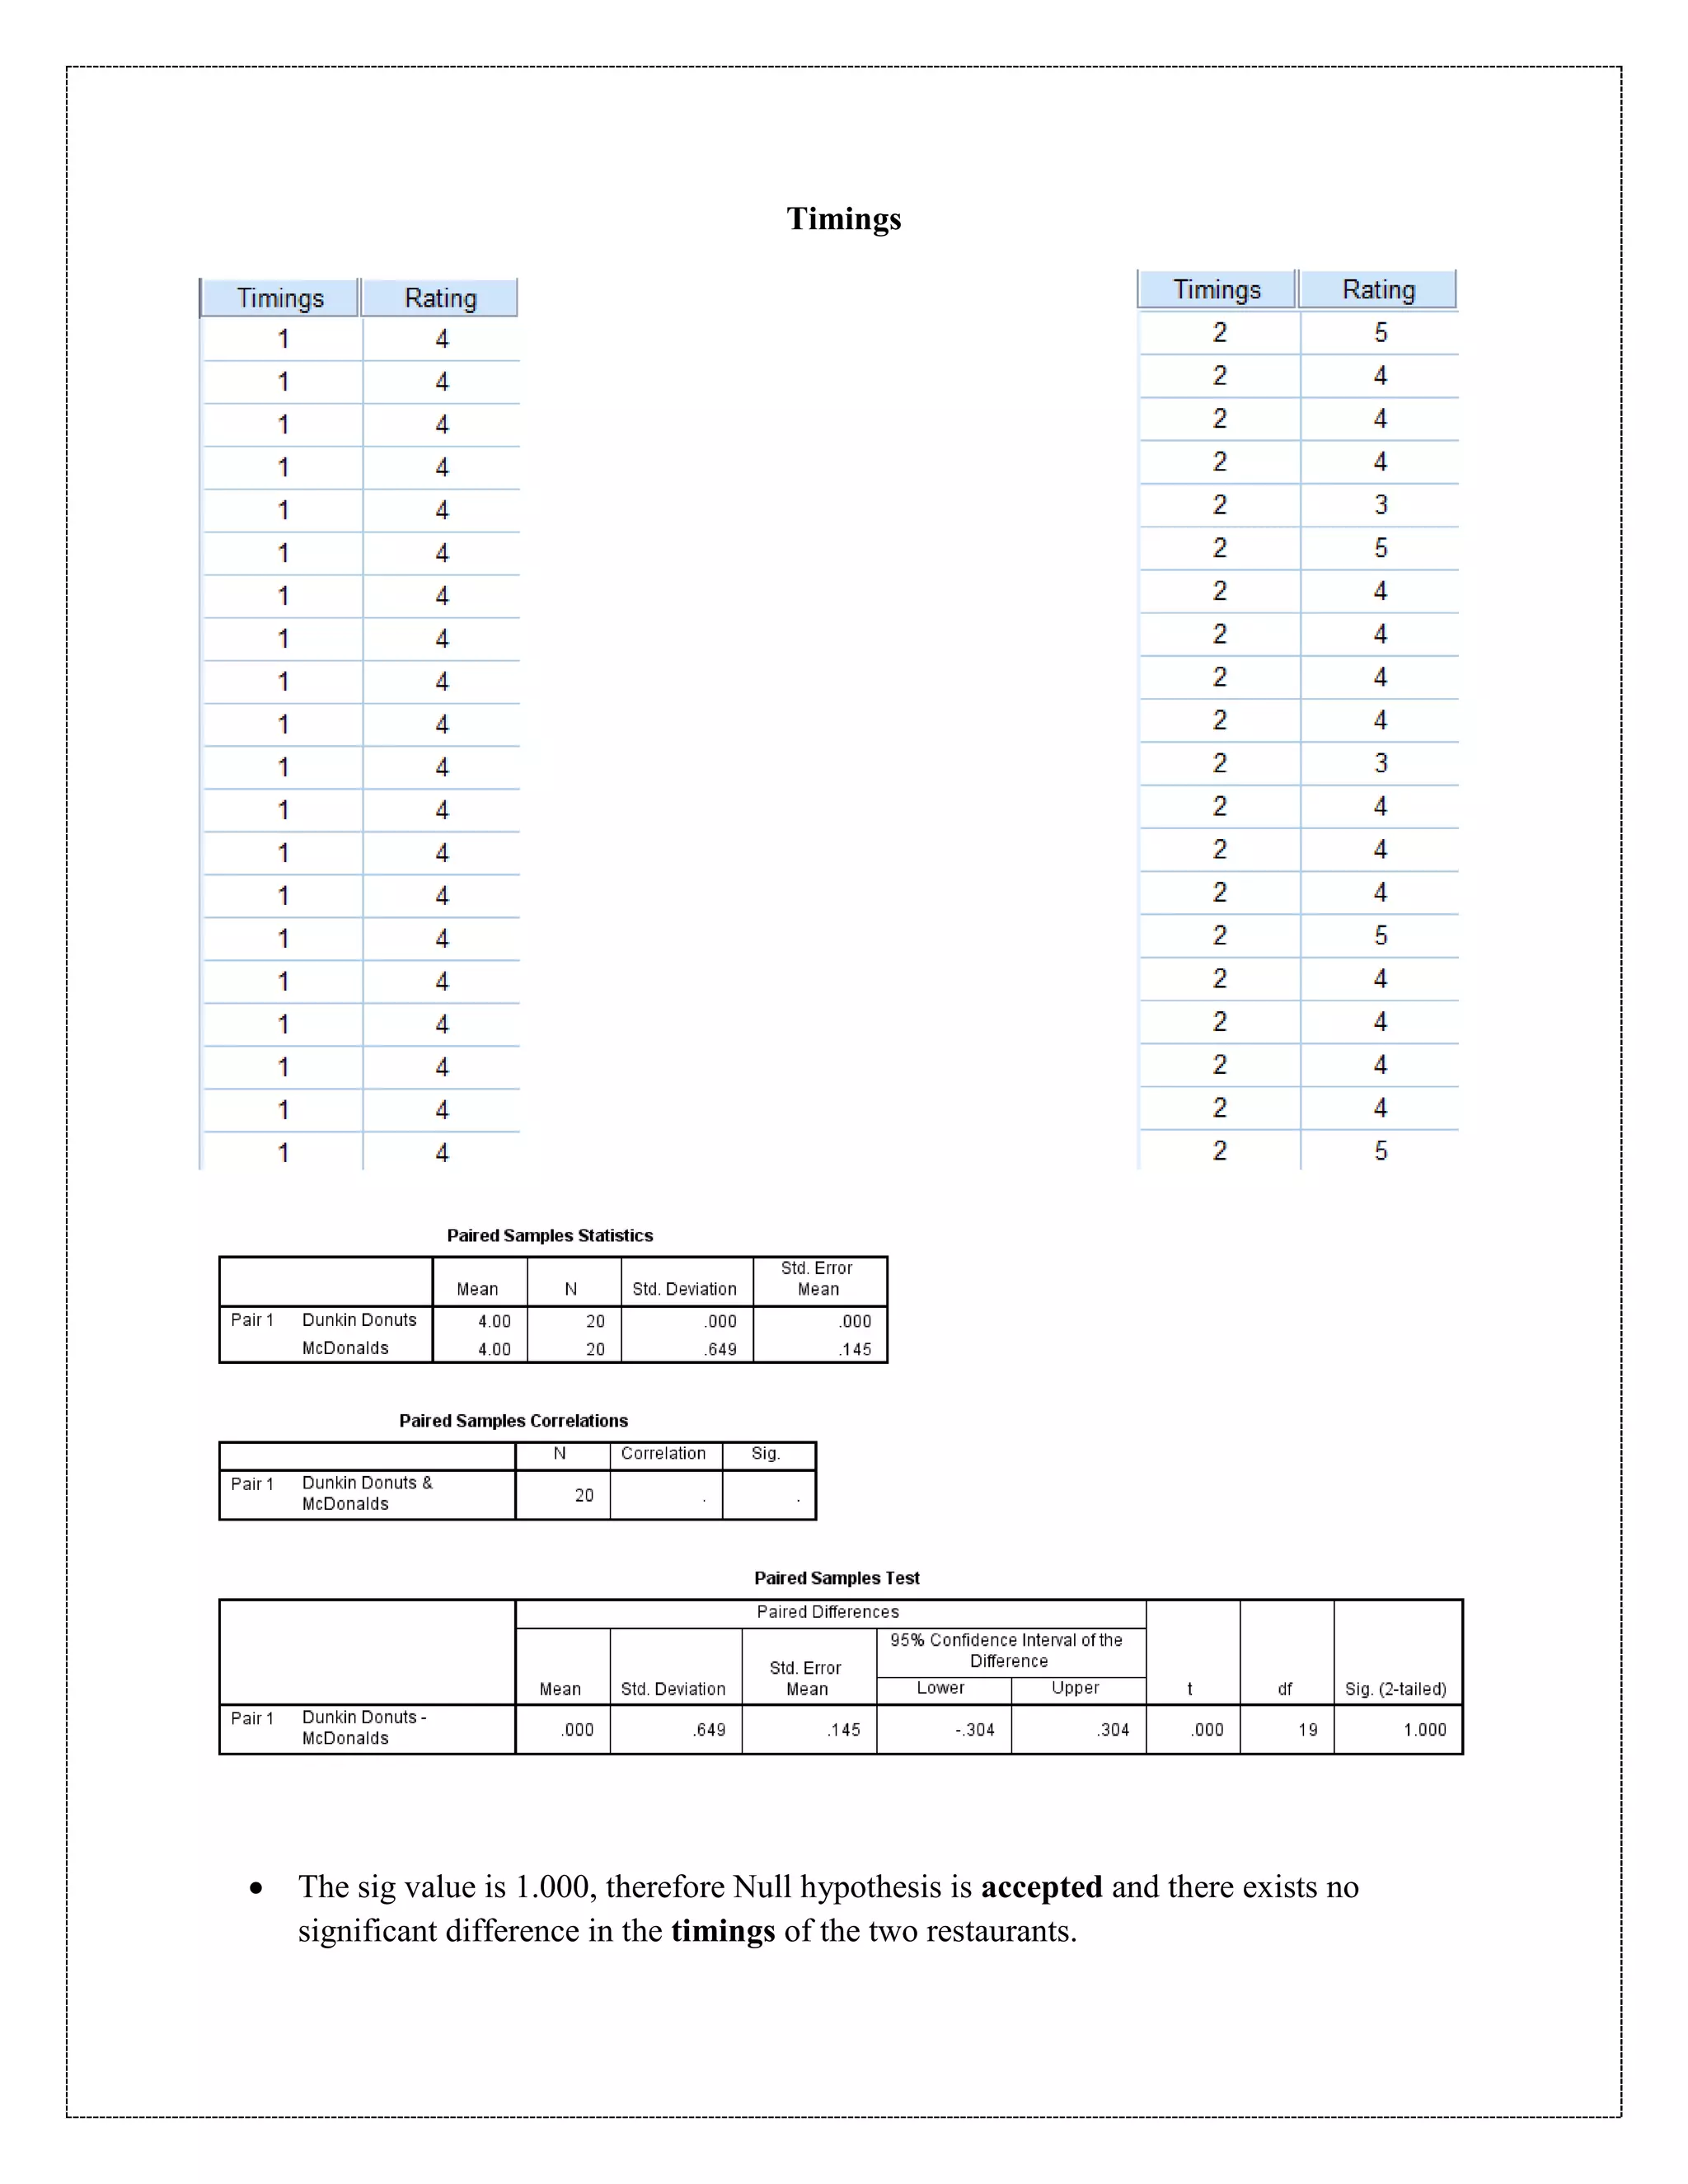
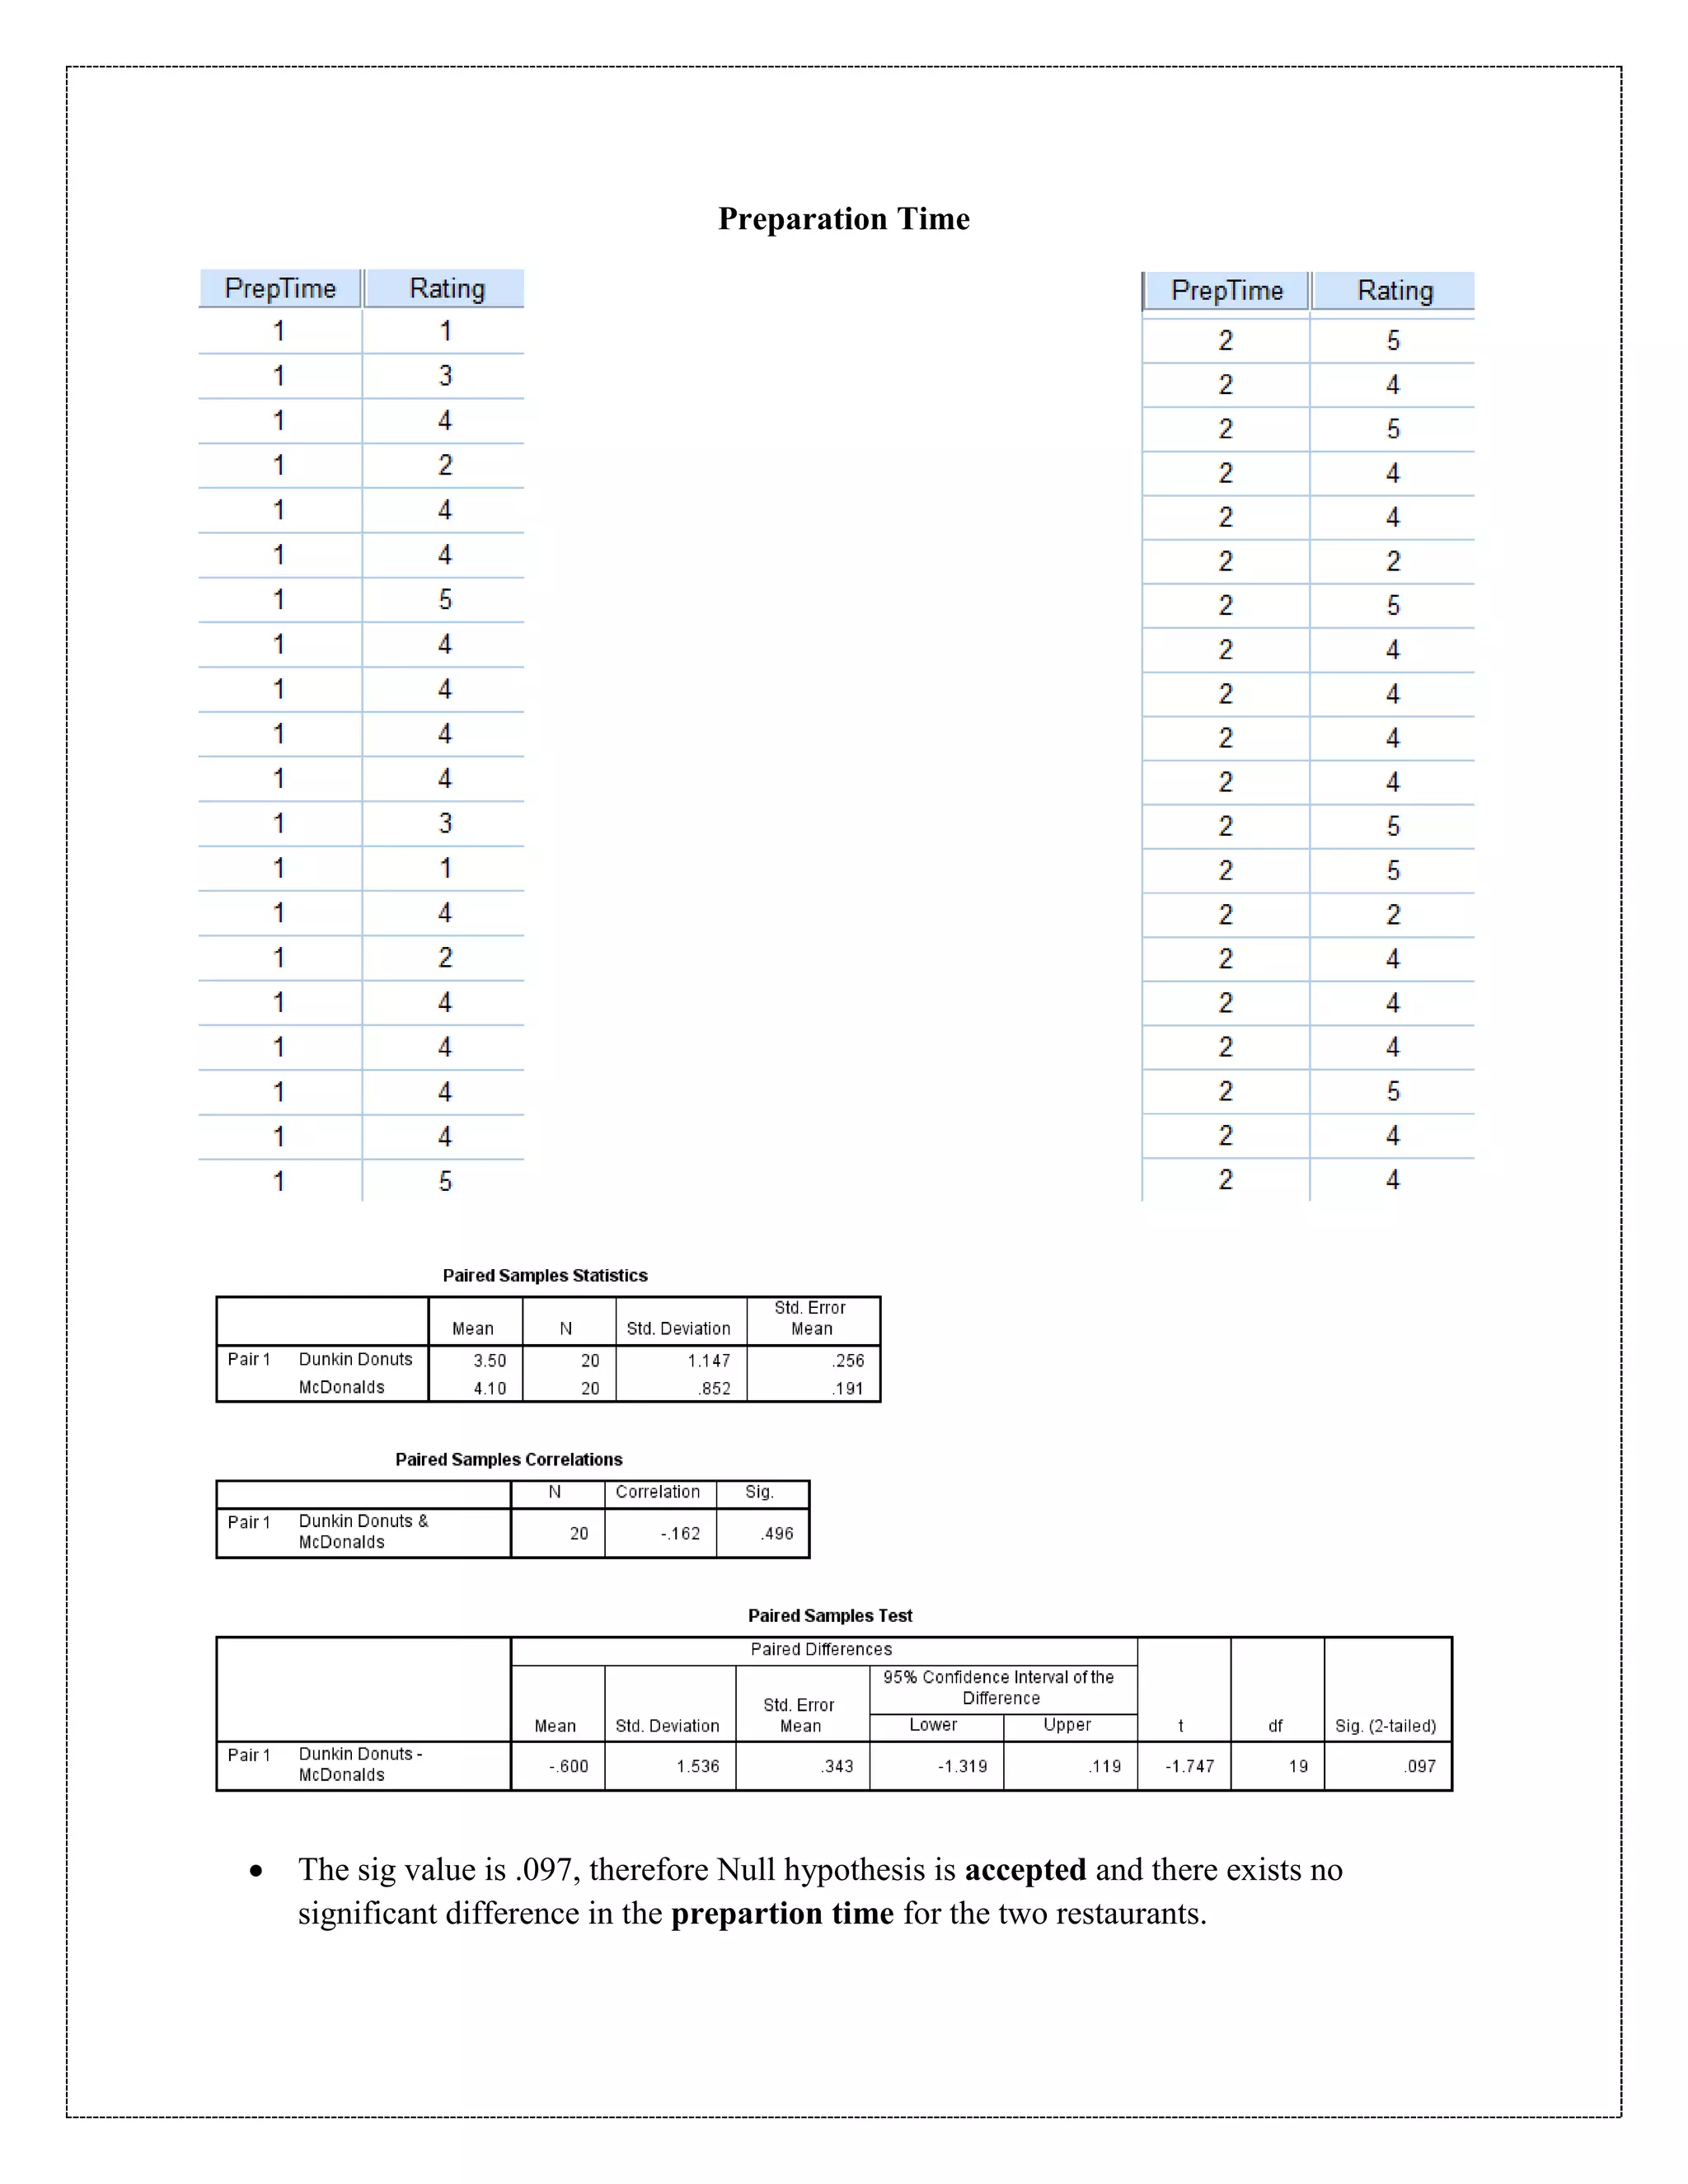
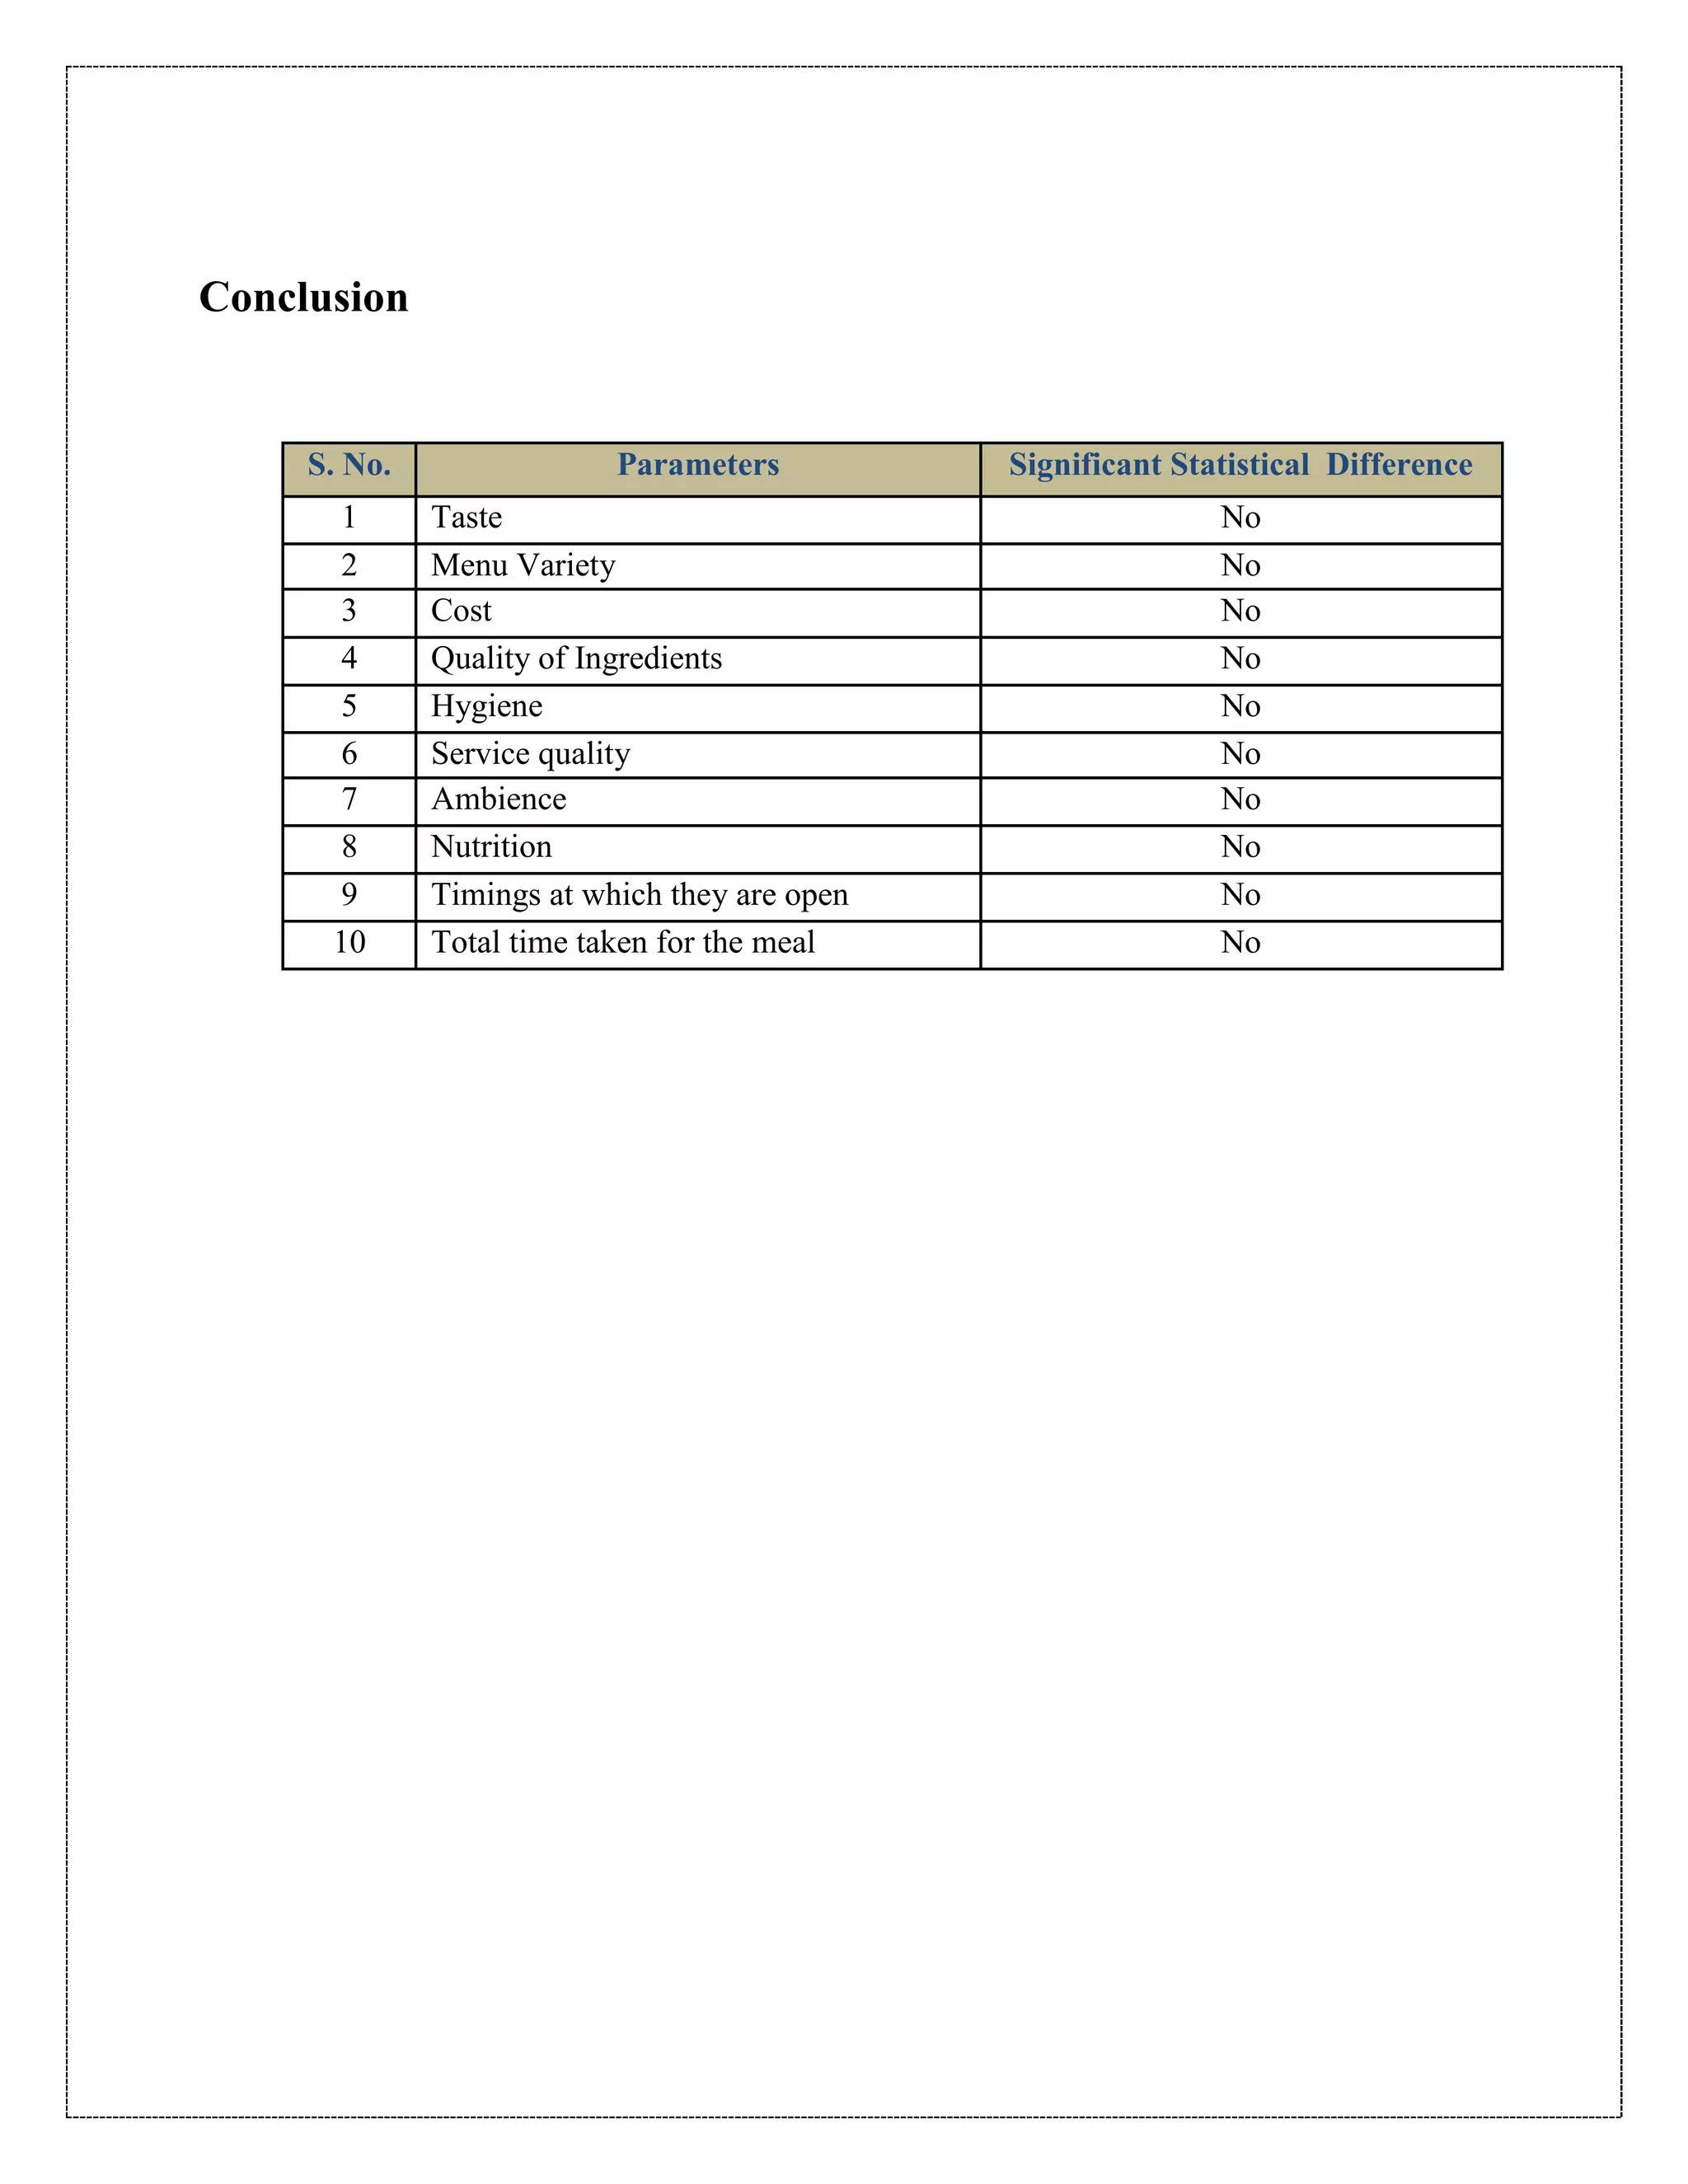
FORE SCHOOL OF MANAGEMENT
Project
To understand the significant
difference between variables of two
different food providing agencies
Business Research Methods
Neelutpal Saha
Roll No-222012
Introduction
A t-test is any statistical hypothesis test in which the test statistic follows a t distribution if the
null hypothesis is supported. It can be used to determine if two sets of data are significantly
different from each other, and is most commonly applied when the test statistic would follow a
normal distribution if the value of a scaling term in the test statistic were known.
There are three methods of t-test
 One-sample t-test
 Paired sample t-test
 Independent sample t-test
The Paired-Samples T Test procedure compares the means of two variables for a single group.
The procedure computes the differences between values of the two variables for each case and
tests whether the average differs from 0.
The Test Statistic
The test statistic in either case is t. Here is the formula for t.
M is the sample mean and μ0 is the hypothetical mean. For a paired-samples t-test, M is the
mean of the difference scores and μ0 is 0. SD is the standard deviation (of the difference scores
in the case of a paired-samples t-test) and N is the number of subjects in the sample.
The p Value
p is the probability of getting a t value at least as extreme as the one we get if the null hypothesis
were true. When doing t-tests by hand, however, we typically do not figure out the exact p
value. Instead, we just figure out whether or not p is lower than your criterion for deciding
whether or not our t value is extreme or unusual. This is our α level, which is usually set to 5%
(sometimes expressed as .05).
Data: For each paired test, we specify two quantitative variables (interval level of measurement
or ratio level of measurement). For a matched-pairs or case-control study, the response for each
test subject and its matched control subject must be in the same case in the data file.
Assumptions: Observations for each pair should be made under the same conditions. The mean
differences should be normally distributed. Variances of each variable can be equal or unequal.
Test Case
We are testing our assumption on two eataries: Dunkin Donuts and McDonalds
Dunkin' Donuts is an American global doughnut company and coffeehouse chain based in
Canton, Massachusetts. It was founded in 1950 by William Rosenberg in Quincy, Massachusetts.
Since its founding, the company has grown to become one of the largest coffee and baked goods
chain in the world, with 15,000 restaurants in 37 different countries. The chain has grown to
include over 1,000 items on their menu, including doughnuts, bagels, other baked goods, and a
wide variety of hot and iced beverages. In NCR region, Dunkin Donuts has more than 20 food
stations.We are testing the food for Dunkin Donuts in Cyber City Gurgaon
The McDonald's Corporation is the world's largest chain of hamburger fast food restaurants,
serving around 68 million customers daily in 119 countries across 35,000 outlets.Headquartered
in the United States, the company began in 1940 as a barbecue restaurant operated by Richard
and Maurice McDonald. McDonald's primarily sells hamburgers, cheeseburgers, chicken, french
fries, breakfast items, soft drinks, milkshakes, and desserts. In response to changing consumer
tastes, the company has expanded its menu to include salads, fish, wraps, smoothies, fruit, and
seasoned fries. McDonalds has a huge presence in Delhi NCR region, we are testing the food for
Cyber City Gurgaon division.
A questionnaire consisting of 10 questions each based on the following parameters was prepared:
 Taste
 Menu Variety
 Cost
 Quality of Ingredients
 Hygiene
 Service quality
 Ambience
 Nutrition
 Timings at which they are open
 Total time taken for the meal
The respondents for the exercise were employees from my own organization Ericsson who
freqented both spots as they are nearby. The ratings on the basis of which these parameters were
judged are:
1=Extremely Unsatisfied, 2= Unsatisfied, 3= Neutral, 4 = Satisfied, 5= Extremely Satisfied
We will be using IBM SPSS Statistics tool which is a software package used for statistical
analysis
Defining the Variables and Test method
 First we need to define the variables in SPSS in variable view in the following way:
 Next we define the ratings given for ‘Taste’ by each respondent for Dunkin Donut (given by
Taste1) and McDonalds (given by Taste2) in the following manner:
 We go to the ‘Analyze’ tab then click ‘Compare Means’ and then apply ‘Paired Samples T-test’
Outputs for each Parameters:
While comparing for each parameter;
 Null Hypothesis will be Parameter of Restaurant1=Parameter of Restaurant 2
 Alternate will be they are not equal to each other.
 We are testing at 5% level of significance
 We check for the significant value in each case, if the value is greater than 0.05 then
Null hypothesis is accepted and if it is less then it is rejected and there exists significant
difference between the two parameters
Taste
 The sig value is .741, therefore Null hypothesis is accepted and there exists no
significant difference in the taste of the two restaurants.
Menu
 The sig value is 1, therefore Null hypothesis is accepted and there exists no significant
difference in the menu of the two restaurants.
Cost
 The sig value is .055, therefore Null hypothesis is accepted and there exists no
significant difference in the Cost of the two restaurants.
Quality
 The sig value is .214, therefore Null hypothesis is accepted and there exists no
significant difference in the quality of the two restaurants.
Hygeine
 The sig value is .428, therefore Null hypothesis is accepted and there exists no
significant difference in the hygeine of the two restaurants.
Service Quality
 The sig value is .330, therefore Null hypothesis is accepted and there exists no
significant difference in the service quality of the two restaurants.
Ambience
 The sig value is .649, therefore Null hypothesis is accepted and there exists no
significant difference in the ambience of the two restaurants.
Nutrition
 The sig value is .428, therefore Null hypothesis is accepted and there exists no
significant difference in the nutrition of food of the two restaurants.
Timings
 The sig value is 1.000, therefore Null hypothesis is accepted and there exists no
significant difference in the timings of the two restaurants.
Preparation Time
 The sig value is .097, therefore Null hypothesis is accepted and there exists no
significant difference in the prepartion time for the two restaurants.
Conclusion
S. No. Parameters Significant Statistical Difference
1 Taste No
2 Menu Variety No
3 Cost No
4 Quality of Ingredients No
5 Hygiene No
6 Service quality No
7 Ambience No
8 Nutrition No
9 Timings at which they are open No
10 Total time taken for the meal No

Business Research Methods T Test

  • 1.
    FORE SCHOOL OFMANAGEMENT Project To understand the significant difference between variables of two different food providing agencies Business Research Methods Neelutpal Saha Roll No-222012
  • 2.
    Introduction A t-test isany statistical hypothesis test in which the test statistic follows a t distribution if the null hypothesis is supported. It can be used to determine if two sets of data are significantly different from each other, and is most commonly applied when the test statistic would follow a normal distribution if the value of a scaling term in the test statistic were known. There are three methods of t-test  One-sample t-test  Paired sample t-test  Independent sample t-test The Paired-Samples T Test procedure compares the means of two variables for a single group. The procedure computes the differences between values of the two variables for each case and tests whether the average differs from 0. The Test Statistic The test statistic in either case is t. Here is the formula for t. M is the sample mean and μ0 is the hypothetical mean. For a paired-samples t-test, M is the mean of the difference scores and μ0 is 0. SD is the standard deviation (of the difference scores in the case of a paired-samples t-test) and N is the number of subjects in the sample. The p Value p is the probability of getting a t value at least as extreme as the one we get if the null hypothesis were true. When doing t-tests by hand, however, we typically do not figure out the exact p value. Instead, we just figure out whether or not p is lower than your criterion for deciding whether or not our t value is extreme or unusual. This is our α level, which is usually set to 5% (sometimes expressed as .05). Data: For each paired test, we specify two quantitative variables (interval level of measurement or ratio level of measurement). For a matched-pairs or case-control study, the response for each test subject and its matched control subject must be in the same case in the data file. Assumptions: Observations for each pair should be made under the same conditions. The mean differences should be normally distributed. Variances of each variable can be equal or unequal.
  • 3.
    Test Case We aretesting our assumption on two eataries: Dunkin Donuts and McDonalds Dunkin' Donuts is an American global doughnut company and coffeehouse chain based in Canton, Massachusetts. It was founded in 1950 by William Rosenberg in Quincy, Massachusetts. Since its founding, the company has grown to become one of the largest coffee and baked goods chain in the world, with 15,000 restaurants in 37 different countries. The chain has grown to include over 1,000 items on their menu, including doughnuts, bagels, other baked goods, and a wide variety of hot and iced beverages. In NCR region, Dunkin Donuts has more than 20 food stations.We are testing the food for Dunkin Donuts in Cyber City Gurgaon The McDonald's Corporation is the world's largest chain of hamburger fast food restaurants, serving around 68 million customers daily in 119 countries across 35,000 outlets.Headquartered in the United States, the company began in 1940 as a barbecue restaurant operated by Richard and Maurice McDonald. McDonald's primarily sells hamburgers, cheeseburgers, chicken, french fries, breakfast items, soft drinks, milkshakes, and desserts. In response to changing consumer tastes, the company has expanded its menu to include salads, fish, wraps, smoothies, fruit, and seasoned fries. McDonalds has a huge presence in Delhi NCR region, we are testing the food for Cyber City Gurgaon division. A questionnaire consisting of 10 questions each based on the following parameters was prepared:  Taste  Menu Variety  Cost  Quality of Ingredients  Hygiene  Service quality  Ambience  Nutrition  Timings at which they are open  Total time taken for the meal The respondents for the exercise were employees from my own organization Ericsson who freqented both spots as they are nearby. The ratings on the basis of which these parameters were judged are: 1=Extremely Unsatisfied, 2= Unsatisfied, 3= Neutral, 4 = Satisfied, 5= Extremely Satisfied We will be using IBM SPSS Statistics tool which is a software package used for statistical analysis
  • 4.
    Defining the Variablesand Test method  First we need to define the variables in SPSS in variable view in the following way:  Next we define the ratings given for ‘Taste’ by each respondent for Dunkin Donut (given by Taste1) and McDonalds (given by Taste2) in the following manner:  We go to the ‘Analyze’ tab then click ‘Compare Means’ and then apply ‘Paired Samples T-test’
  • 5.
    Outputs for eachParameters: While comparing for each parameter;  Null Hypothesis will be Parameter of Restaurant1=Parameter of Restaurant 2  Alternate will be they are not equal to each other.  We are testing at 5% level of significance  We check for the significant value in each case, if the value is greater than 0.05 then Null hypothesis is accepted and if it is less then it is rejected and there exists significant difference between the two parameters
  • 6.
    Taste  The sigvalue is .741, therefore Null hypothesis is accepted and there exists no significant difference in the taste of the two restaurants.
  • 7.
    Menu  The sigvalue is 1, therefore Null hypothesis is accepted and there exists no significant difference in the menu of the two restaurants.
  • 8.
    Cost  The sigvalue is .055, therefore Null hypothesis is accepted and there exists no significant difference in the Cost of the two restaurants.
  • 9.
    Quality  The sigvalue is .214, therefore Null hypothesis is accepted and there exists no significant difference in the quality of the two restaurants.
  • 10.
    Hygeine  The sigvalue is .428, therefore Null hypothesis is accepted and there exists no significant difference in the hygeine of the two restaurants.
  • 11.
    Service Quality  Thesig value is .330, therefore Null hypothesis is accepted and there exists no significant difference in the service quality of the two restaurants.
  • 12.
    Ambience  The sigvalue is .649, therefore Null hypothesis is accepted and there exists no significant difference in the ambience of the two restaurants.
  • 13.
    Nutrition  The sigvalue is .428, therefore Null hypothesis is accepted and there exists no significant difference in the nutrition of food of the two restaurants.
  • 14.
    Timings  The sigvalue is 1.000, therefore Null hypothesis is accepted and there exists no significant difference in the timings of the two restaurants.
  • 15.
    Preparation Time  Thesig value is .097, therefore Null hypothesis is accepted and there exists no significant difference in the prepartion time for the two restaurants.
  • 16.
    Conclusion S. No. ParametersSignificant Statistical Difference 1 Taste No 2 Menu Variety No 3 Cost No 4 Quality of Ingredients No 5 Hygiene No 6 Service quality No 7 Ambience No 8 Nutrition No 9 Timings at which they are open No 10 Total time taken for the meal No