Download to read offline
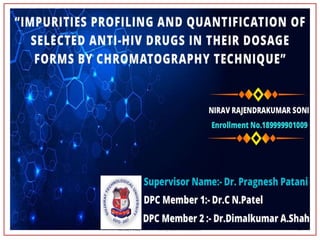

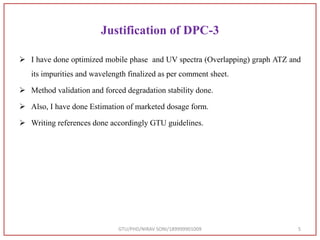
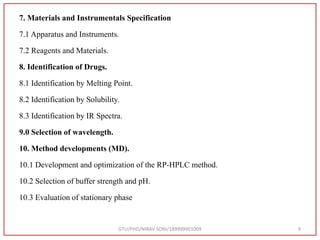

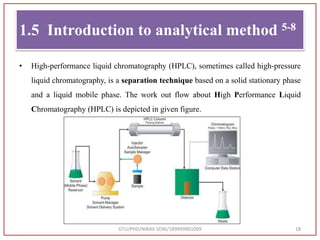
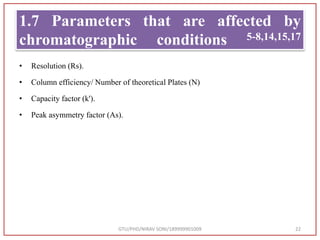
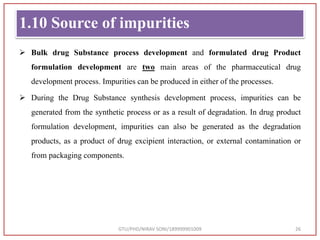
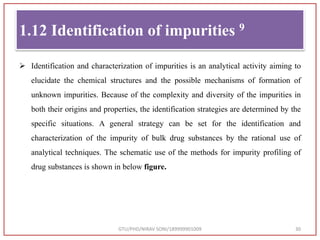

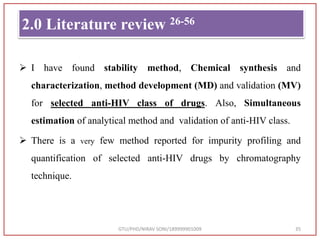


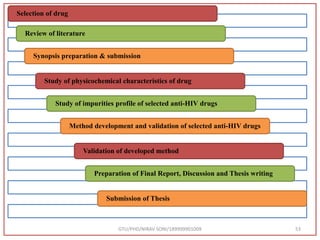

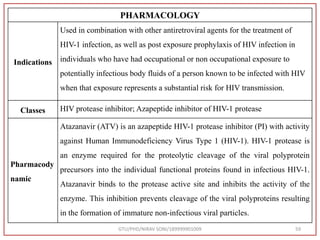
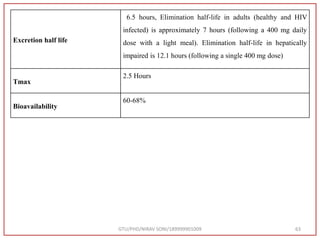
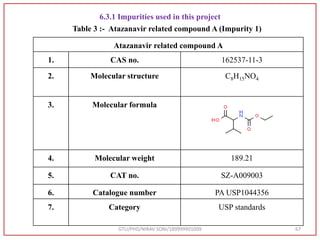
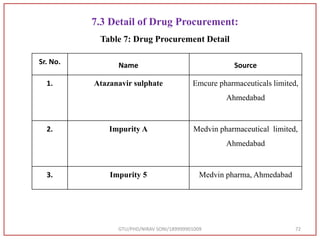
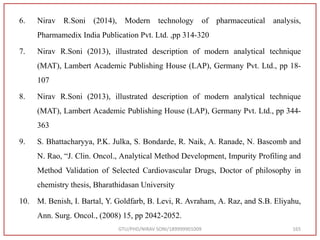
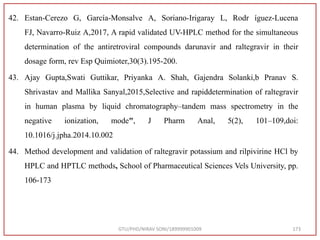
![State Solid
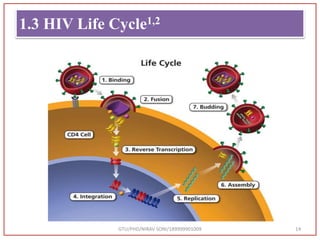
Melting point 195-209 °C
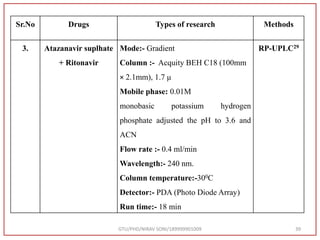
Experimental
properties
Log P:- 4.36
Mol. Weight
Average: 802.934 g/mol
Monoisotopic: 802.35712729
IUPAC Name
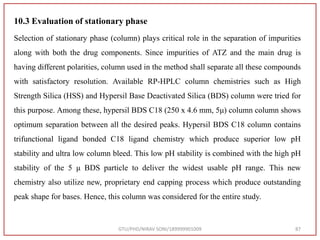
(Methyl N-[(2S)-1-[[(2S,3S)-3-hydroxy-4-[[[(2S)-2-(methoxy
carbonylamino)-3,3-dimethylbutanoyl]amino]-[(4-pyridin-2-
yl phenyl)methyl]amino]-1-phenylbutan-2-l]amino]-3,3-
dimethyl-1-oxobutan-2-yl]carbamate
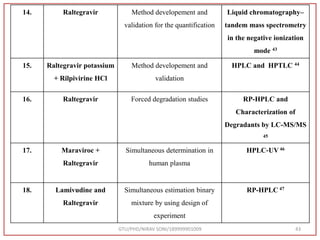
GTU/PHD/NIRAV SONI/189999901009 57](https://image.slidesharecdn.com/dpc-niravsoni-220226175624/85/Impurities-profiling-of-ATZ-57-320.jpg)
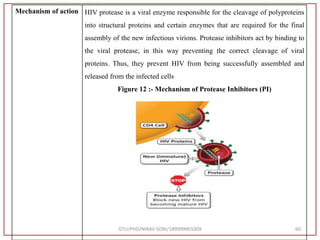
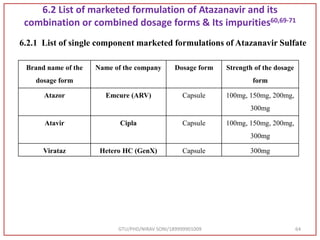
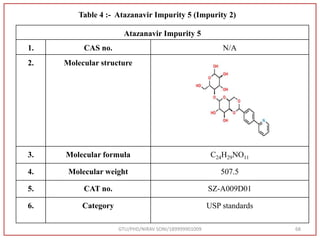
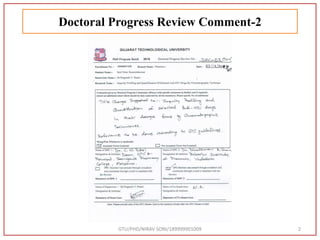
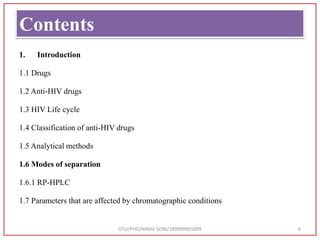
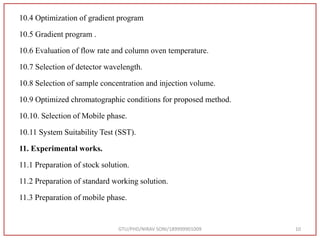
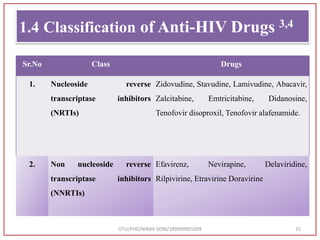
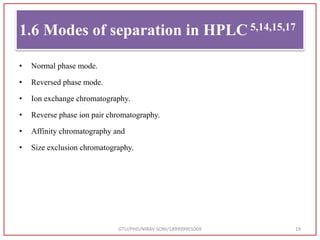
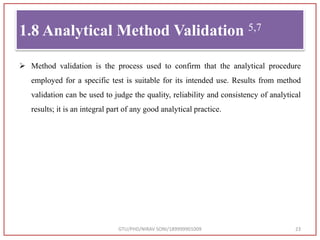
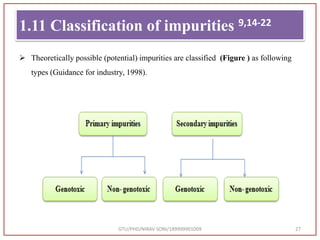
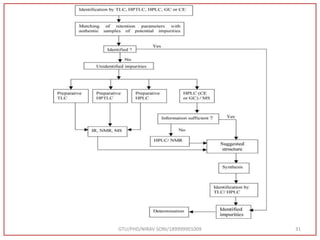
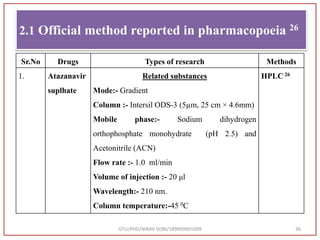
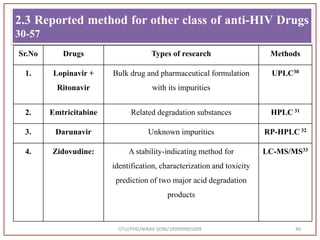
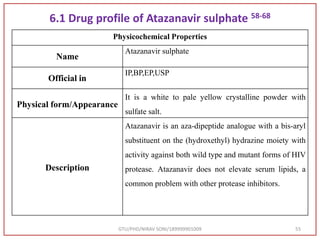
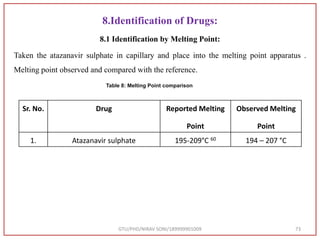
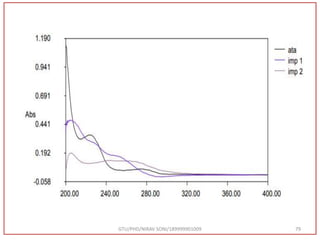
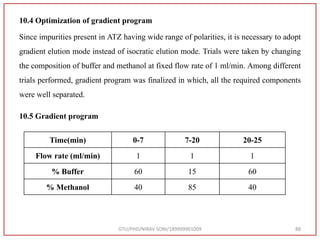
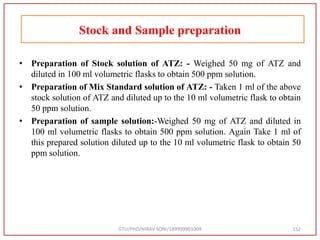
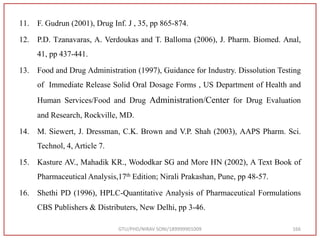
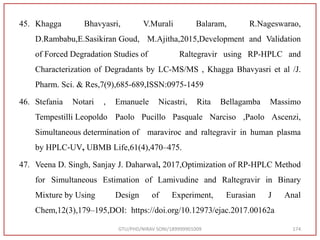
![7. Materials and Instrumentals Specification:
7.1 Apparatus and Instruments:
Table 5: Apparatus and Instruments List
GTU/PHD/NIRAV SONI/189999901009 69
Sr. No. Name Description
1. UV Spectrophotometer Systronics 119
2. HPLC Shimadzu [with power stream]
Column:- C18 Hypersil BDS
(250mm × 4.6mm × 5μm)
Pump:- LC-20 AT
Syringe:- Rheodyne injector valve with 20.0 μl
loop
Detector:- PDA 600 UV Detector
Software:- Spinchrom](https://image.slidesharecdn.com/dpc-niravsoni-220226175624/85/Impurities-profiling-of-ATZ-69-320.jpg)
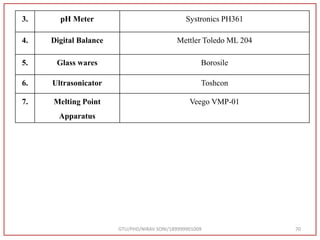
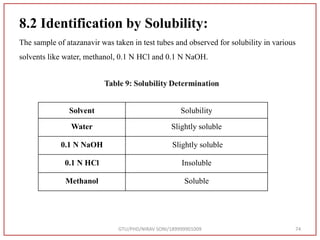

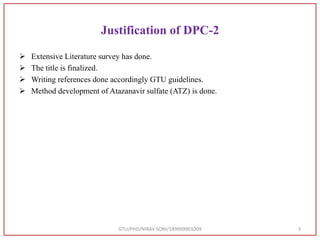
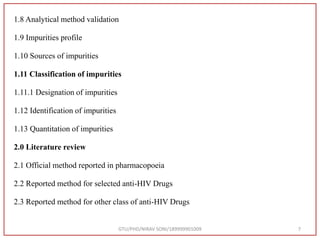
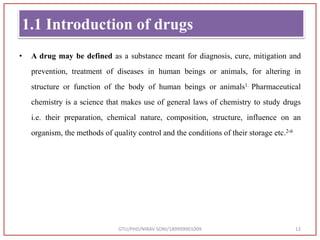
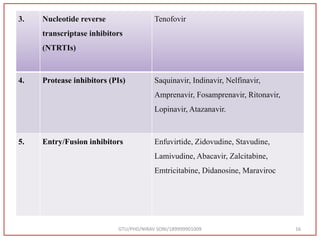
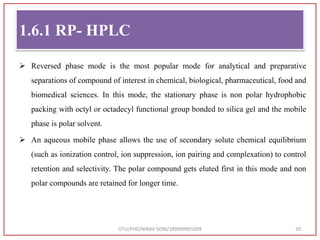
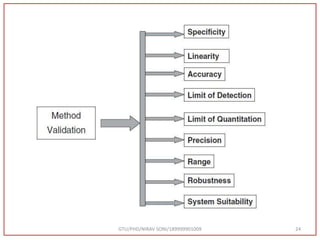
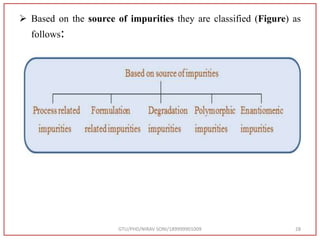
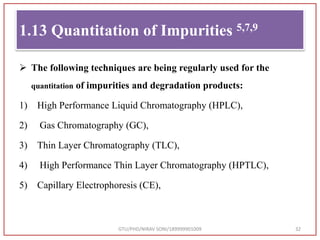
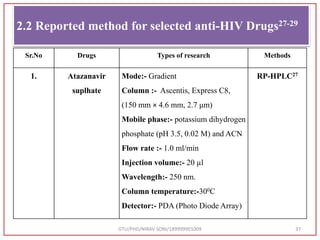
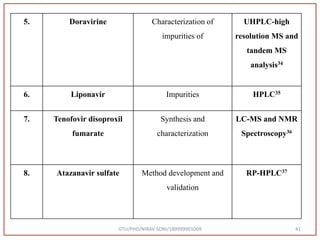
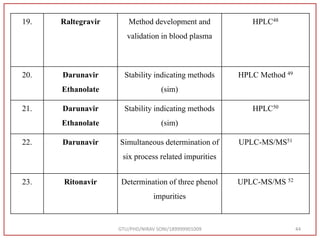
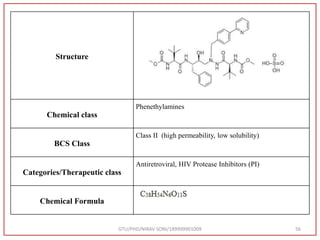
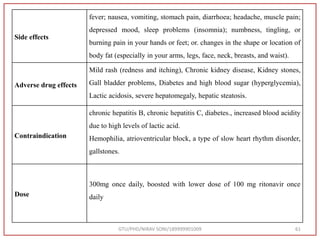
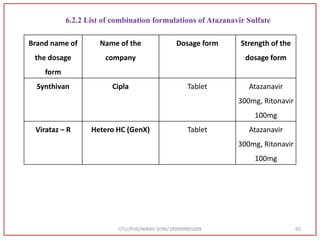
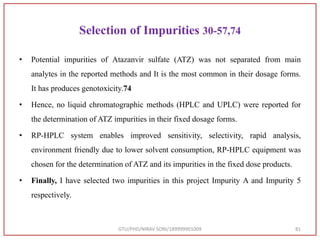
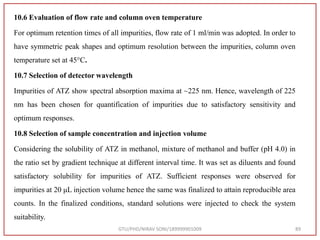
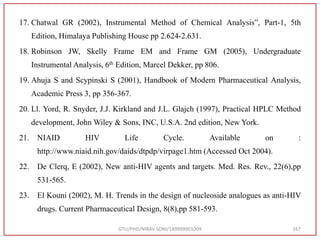
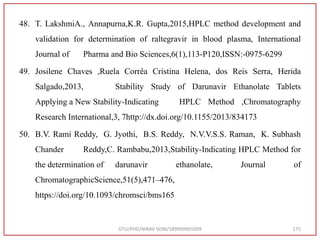
![Type of vibration Observed frequency value (cm-1) Standard Value (cm-1) [72]
C=O stretching 1731 1870-1540
C=C stretching 1540 1670-1600
N-H bending 1600 1650-1580
C-O Stretching 1069 1400-1000
GTU/PHD/NIRAV SONI/189999901009 77
Table 10:- Interpretation from IR spectra of sample atazanavir](https://image.slidesharecdn.com/dpc-niravsoni-220226175624/85/Impurities-profiling-of-ATZ-77-320.jpg)
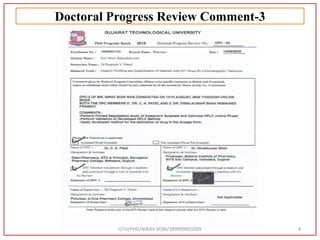
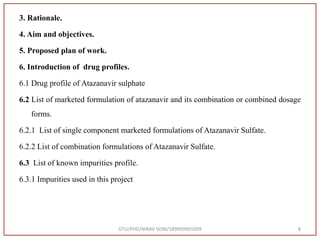
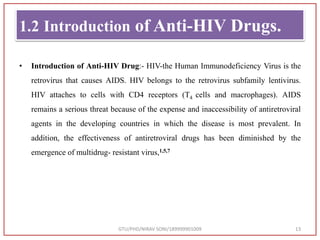
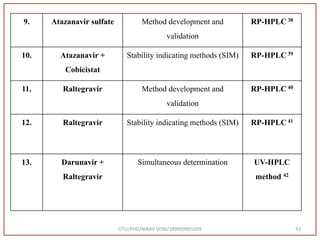
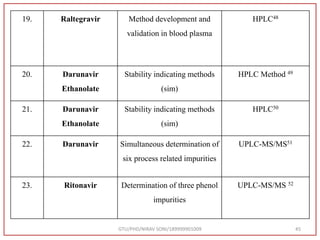
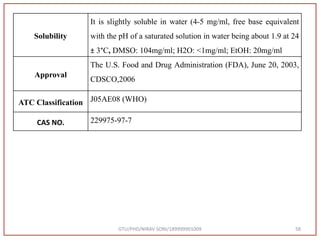
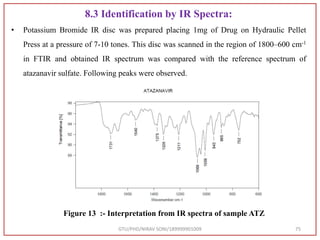
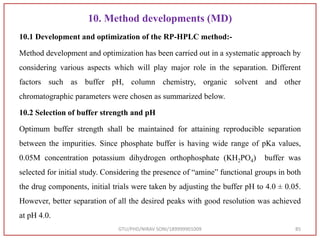
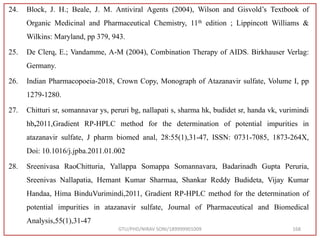
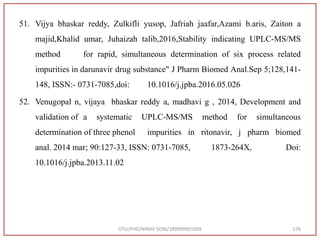
![GTU/PHD/NIRAV SONI/189999901009 80
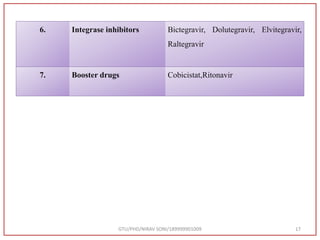
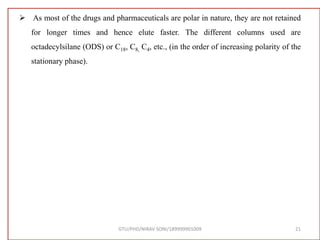
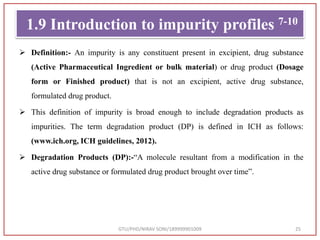
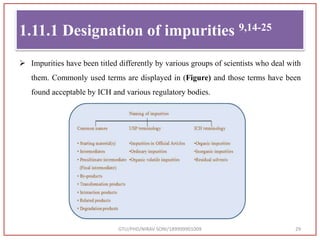
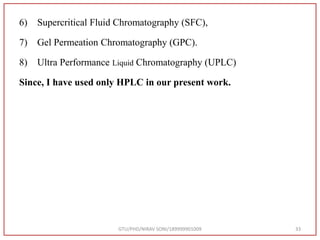
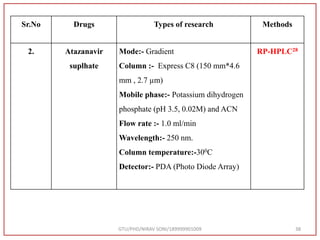
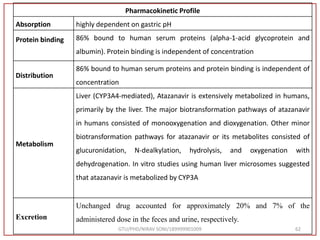
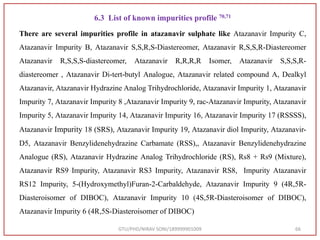
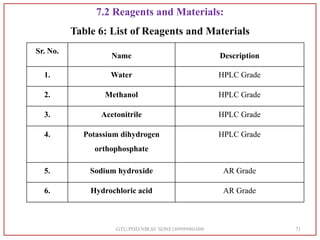
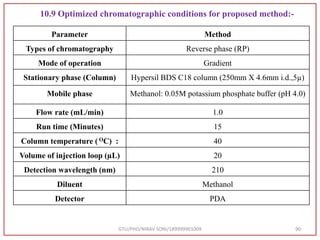
Atazanavir Sulfate Standard at 5 ppm
Retention time
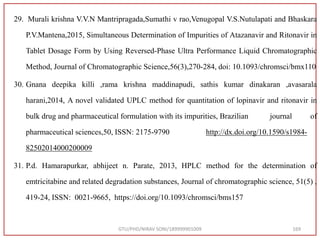
[min]
Area
[mV.s]
Height
[mV]
Area
[%]
5.280 205.425 22.231 100](https://image.slidesharecdn.com/dpc-niravsoni-220226175624/85/Impurities-profiling-of-ATZ-80-320.jpg)
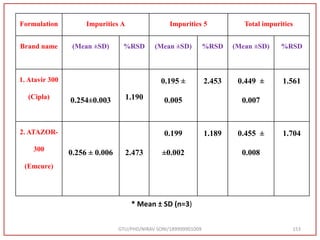
![GTU/PHD/NIRAV SONI/189999901009 82
Impurities Standard A and 5 at 5 ppm
Impurities Retention time
[min]
Area
[mV.s]
Height
[mV]
Area
[%]
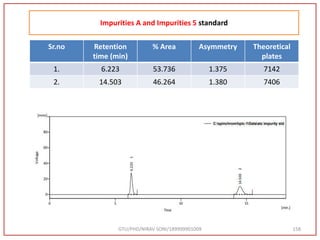
A 6.223 300.757 27.610 53.736
5 14.503 258.940 10.242 46.264](https://image.slidesharecdn.com/dpc-niravsoni-220226175624/85/Impurities-profiling-of-ATZ-82-320.jpg)
![GTU/PHD/NIRAV SONI/189999901009 83
Compounds Retention time
[min]
Area
[mV.s]
Height
[mV]
Area
[%]
ATZ 5.297 19230.092 2061.316 24.722
Impurity-A 6.240 313.022 27.995 0.402
Impurity-5 14.547 261.166 10.285 0.336
Atazanavir Sulfate Standard (500 ppm) and its impurities A and 5 (5 ppm)](https://image.slidesharecdn.com/dpc-niravsoni-220226175624/85/Impurities-profiling-of-ATZ-83-320.jpg)
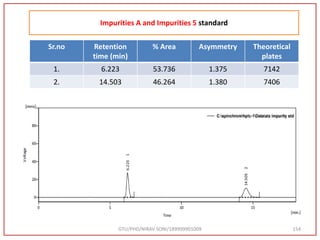
![GTU/PHD/NIRAV SONI/189999901009 84
Atazanavir Sulfate Test (500 ppm) and its impurities A and 5 (5 ppm)
Compounds Retention time
[min]
Area
[mV.s]
Height
[mV]
Area
[%]
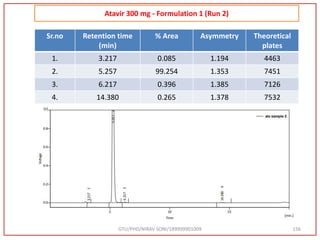
Unknown 3.243 16.513 2.210 0.085
ATZ 5.300 19231.523 2060.645 99.204
Impurity-A 6.270 86.373 7.433 0.446
Impurity-5 14.507 51.360 2.045 0.265](https://image.slidesharecdn.com/dpc-niravsoni-220226175624/85/Impurities-profiling-of-ATZ-84-320.jpg)
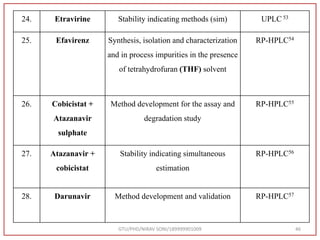
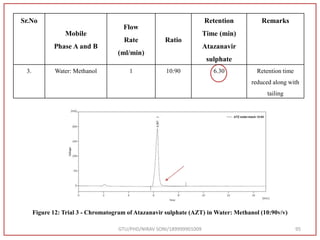
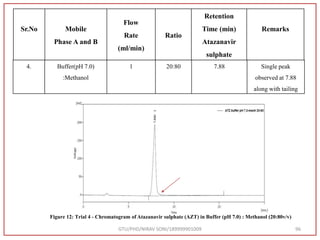
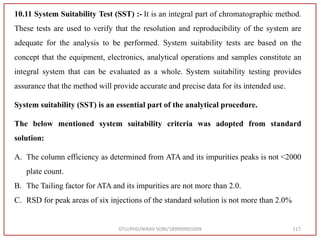
![Hence, the buffer pH was fixed at 4.0 to ensure improved column performance at this acidic
pH. In order to attain baseline resolution of impurities and for eluting late eluting non-polar
impurities, methanol was used as organic solvent and found satisfactory separation with
reduced retention times. Also, sharp peaks with good responses were observed. Hence,
Methanol and 0.05M Potassium dihydrogen phosphate buffer (pH-4.0) were used as organic
solvent.
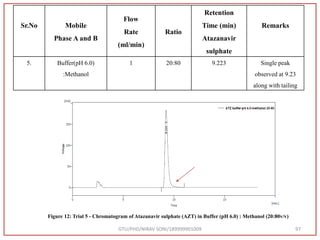
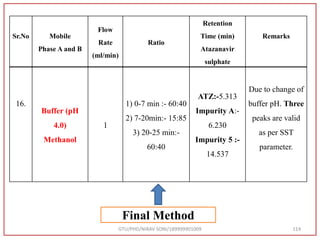
Preparation of Mobile Phase:- After considering the varying combinations of various
mobile phases, Buffer: Methanol used by gradient RP-HPLC method. [Buffer (0.05 M
KH2PO4, pH 4.0) Take 6.8 gm KH2PO4 in to a 1000 ml beaker, add 800 ml water and
dissolve, adjust pH 4.0 with 0.1N NaOH, Make up Volume 1000 ml with water] was
finalized as it was showing good peak shapes and a significant amount of resolution.
GTU/PHD/NIRAV SONI/189999901009 86](https://image.slidesharecdn.com/dpc-niravsoni-220226175624/85/Impurities-profiling-of-ATZ-86-320.jpg)

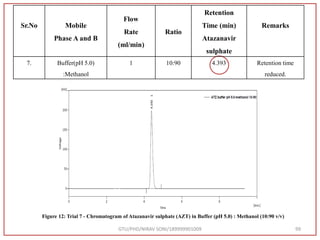

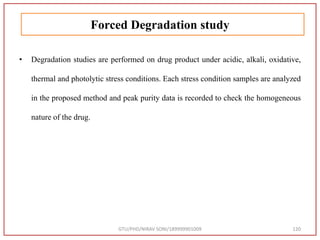
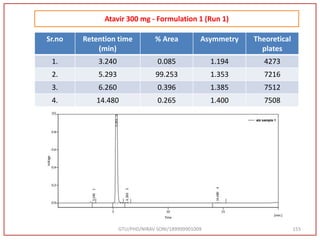
![Final Analytical Method
• Analytical method was developed using HPLC Shimadzu [with power stream] gradient
chromatographic technique. Data were passed through the spinchrom software.
Separation was achieved on hypersil BDS C18 (250 x 4.6 mm, 5 μm) column using
mobile phase composition of 0.05M potassium phosphate buffer: methanol (60:40 v/v),
(15:85 v/v),(60:40 v/v), pH adjusted to 4 with 1% orthophosphoric acid (OPA). Make up
volume with water. Flow rate was maintained at 1 ml/min with 225 nm UV detection.
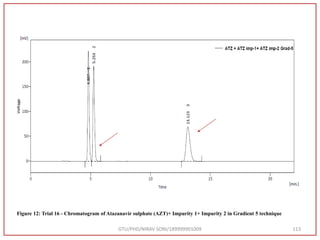
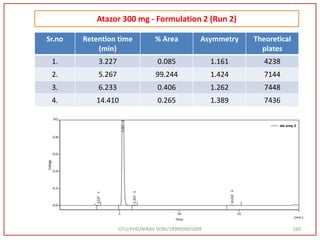
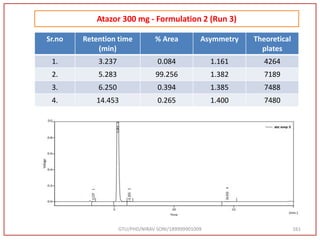
The retention time (RT) obtained for atazanavir sulphate (ATZ) , impurity A and
impurity 5 was at 5.3 min, 6.23 min and 14.53 min respectively with injection volume
20 μL and the detection was made at 225 nm.
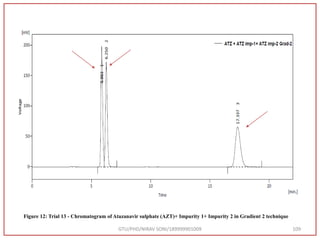
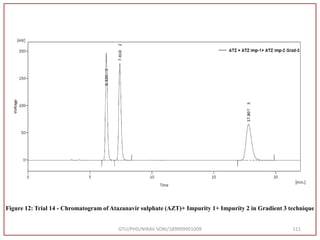
GTU/PHD/NIRAV SONI/189999901009 118](https://image.slidesharecdn.com/dpc-niravsoni-220226175624/85/Impurities-profiling-of-ATZ-118-320.jpg)


![58. Available: Wikipedia, atazanavir sulfate,
https://www.wikidata.org/wiki/Q27114238
59. Available: PubChem, https://pubchem.ncbi.nlm.nih.gov
60. Drug bank, Available: https://www.drugbank.ca/drugs/DB01072,
[Accessed 26 December 2019].
61. Available: WIPO International Patent Classification,
http://www.wipo.int/classifications/ipc/
62. Drugs.com, Atazanavir sulfate, Available:
https://www.drugs.com/monograph/atazanavir-sulfate.html#r238 [Accessed
on 22 May, 2019 ].
63. Piliero PJ. Atazanavir: a novel HIV-1 protease inhibitor. Expert Opin
Investig Drugs. 2002; 11:1295-1301
http://www.ncbi.nlm.nih.gov/pubmed/12225250?dopt=AbstractPlus
GTU/PHD/NIRAV SONI/189999901009 179](https://image.slidesharecdn.com/dpc-niravsoni-220226175624/85/Impurities-profiling-of-ATZ-179-320.jpg)
![68. Piliero PJ.Atazanavir: a novel HIV-1 protease inhibitor (2002),
Expert Opin Investig Drugs, 11(9):1295-301.
69. Karlgren M, Vildhede A, Norinder U, Wisniewski JR, Kimoto E,
Lai Y, Haglund U, Artursson P (2012), Classification of inhibitors
of hepatic organic anion transporting polypeptides (OATPs):
influence of protein expression on drug-drug interactions. J Med
Chem, 55(10),4740-63. doi: 10.1021/jm300212s. Epub 2012
[Accessed on May 15. [PubMed:22541068]]
70. BOC Science, Atazanavir and Impurities, Available:
https://www.bocsci.com/im-atazanavir-and-impurities-list-
366.html
71. Syn Zeal, Atazanavir, Available: https://www.synzeal.com/rac-
atazanavir-impurity-9-5
GTU/PHD/NIRAV SONI/189999901009 181](https://image.slidesharecdn.com/dpc-niravsoni-220226175624/85/Impurities-profiling-of-ATZ-181-320.jpg)


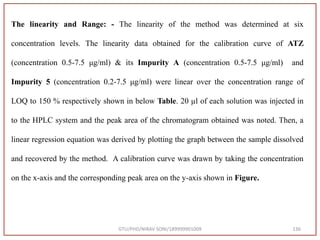
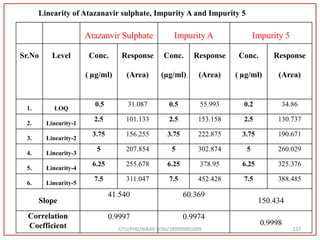
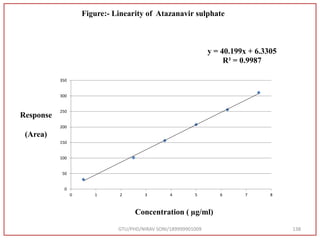
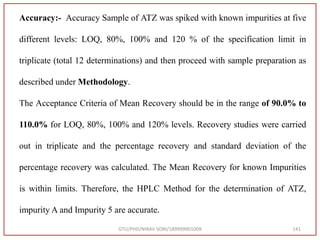
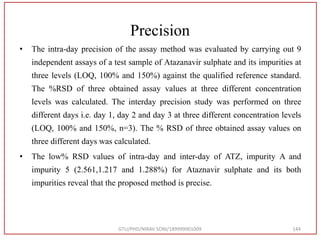
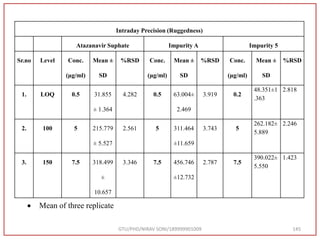
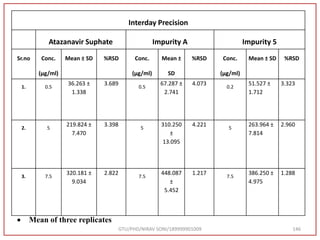
The document describes progress reports for the doctoral work of Nirav Soni. It mentions that extensive literature review has been done, the title has been finalized, and references have been written according to GTU guidelines. It also states that the development of the analytical method for Atazanavir sulfate has been completed. The method has been optimized, validated, and used to estimate the drug in marketed formulations. Mobile phase, wavelength, and forced degradation studies have also been performed.


