Download as PDF, PPTX


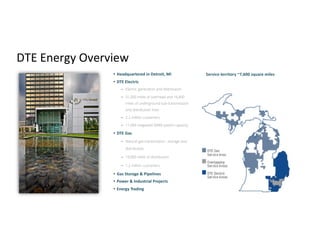


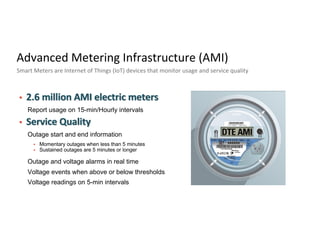
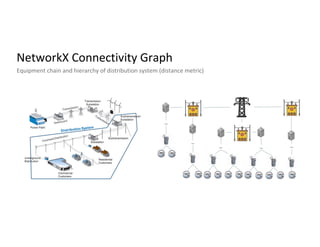


The document discusses improving power grid reliability using IoT analytics, detailing business challenges faced by DTE Energy, including long-duration outages and aging equipment. It presents a solution architecture employing advanced modeling methods to identify outage causes, enhance asset health management, and reduce customer outages through proactive measures like tree trimming. The goal is to establish a foundation for enhanced digital transformation in energy management and customer service.


![[Case study] Green Mountain Power: Reducing the duration of outages](https://cdn.slidesharecdn.com/ss_thumbnails/greenmtnpower2012-130320052400-phpapp02-thumbnail.jpg?width=640&height=640&fit=bounds)