This whitepaper discusses using advanced data management and predictive analytics to improve transmission and distribution asset management. It describes how utilities can leverage non-intrusive field testing and online monitoring methods along with asset criticality, health, and risk analysis. This allows for predictive, top-down and bottom-up asset management strategies. The whitepaper argues that embracing big data analytics and predictive modeling can transform asset management from being condition-based to risk-based. This enables more informed, real-time decision making through scalable situational awareness.
The seminar agenda covers various topics related to virtualization and systems management over a half day period. There will be presentations on Janalent, virtualization and systems management, a real world demo, and a survey and giveaways before wrapping up at noon. The document about Janalent provides information on their services, partnerships, experience, recognition and approach to virtualization. It emphasizes how virtualization can increase flexibility, scalability, availability and reduce costs when implemented properly.
Distributed Scalable Systems Short OverviewRNeches
Closing description of work in the Distributed Scalable Systems Division just prior to reorganization as the Collaborative Systems component of the merged Computational Systems and Technology Division.
Neches Full Cv, Nsf Cyber Infrastructure, June 2012RNeches
This document provides a full curriculum vitae for Robert Neches, including his education, technical interests, and professional history. It details that he currently serves as the Director of Advanced Engineering Initiatives at the US Department of Defense, and held previous positions at USC researching distributed systems, decision support, and information management. It provides details on his roles managing research programs and groups at DARPA and USC from 1982 to the present.
Overview of Business Continuity Planning: Terminology, Rationale, Business Continuity Planning Cycle, Methodology. A high-level description with minimal detail of each of these steps: Risk Assessment, Business Impact Analysis, Risk Mitigation Strategy, Business Continuity Plan, Training, Testing and Auditing, and Plan Maintenance.
The need for a transition from a traditional maintenance practices to a dependency around data that uses analytics to alter maintenance practices has the potential to add value while creating new rewards and challenges to the utility world.
Whitepaper : Building a disaster ready infrastructureJake Weaver
It’s not just hurricanes, fire or other natureal disasters that can bring a business to its knees. Everyday problems such as bad software, misconfigured networks, hardware failures or power outages are much more common. In fact, power failures accounted for nearly half of the declared disasters reported in a recent survey conducted by Forrester
7 deadly data centre sins: how to recognise themKatieirelandSSE
This document discusses the seven deadly sins or risks that data center operators should avoid. It begins by explaining that choosing a data center involves balancing appropriate IT environments with risk mitigation. The seven sins covered are: 1) inappropriate power supply, 2) inadequate cooling and energy efficiency, 3) inadequate communications, 4) wrong location, 5) insecure facility, 6) poor business practices, and 7) lack of adequate fire protection. For each sin, the document provides details on how to evaluate data centers and outlines best practices for risk avoidance. The overall message is that understanding risks is key to determining what compromises an organization is willing to make in their data center selection.
As huge energy consumers, datacenters find their environmental performance under intense scrutiny. This report provides an overview of current environmental issues most relevant to the datacenter industry and its suppliers, including legislation, standards, metrics and other topics.
Dynamic Rule Base Construction and Maintenance Scheme for Disease Predictionijsrd.com
Business and healthcare application are tuned to automatically detect and react events generated from local are remote sources. Event detection refers to an action taken to an activity. The association rule mining techniques are used to detect activities from data sets. Events are divided into 2 types' external event and internal event. External events are generated under the remote machines and deliver data across distributed systems. Internal events are delivered and derived by the system itself. The gap between the actual event and event notification should be minimized. Event derivation should also scale for a large number of complex rules. Attacks and its severity are identified from event derivation systems. Transactional databases and external data sources are used in the event detection process. The new event discovery process is designed to support uncertain data environment. Uncertain derivation of events is performed on uncertain data values. Relevance estimation is a more challenging task under uncertain event analysis. Selectability and sampling mechanism are used to improve the derivation accuracy. Selectability filters events that are irrelevant to derivation by some rules. Selectability algorithm is applied to extract new event derivation. A Bayesian network representation is used to derive new events given the arrival of an uncertain event and to compute its probability. A sampling algorithm is used for efficient approximation of new event derivation. Medical decision support system is designed with event detection model. The system adopts the new rule mapping mechanism for the disease analysis. The rule base construction and maintenance operations are handled by the system. Rule probability estimation is carried out using the Apriori algorithm. The rule derivation process is optimized for domain specific model.
Business Continuity and Recovery Planning for Power OutagesARC Advisory Group
Business Continuity and Recovery Planning for Power Outages
The timely execution of a
BCRP strategy is particularly
important during extended
power outages to avoid
costly business disruptions.
Business Continuity and Recovery Planning (BCRP) is an ARC Best Practice-
based strategy for minimizing downtime and lost productivity during
unexpected business interruptions like the recent power outages in the
northeastern United States and Great Britain. While power
failures may be unavoidable, their impact can be substantially
reduced for companies that have been proactive about establishing
proper action plans.
BCRP addresses the three key stages of business interruption
management: Ready & Alert, Respond & Analyze, and Recover
& Audit. By developing action plans that address multiple scenarios, including
widespread and long-duration power outages, companies can
minimize the impact on their business activities and quickly regain control
of the situation.
http://www.cloud9realtime.com/ Cloud Computing Disaster Readiness Report by software security giant Symantec in 2012 clearly shows that cloud computing disaster readiness is being embraced in North America and everywhere.
Why Replication is Not Enough to Keep Your Business Running Axcient
While you may be familiar with multiple replication products and vendors, don’t confuse the technology of data or server replication with Disaster Recovery.
Replication is not a disaster recovery solution nor does it provide business continuity. So what exactly is replication? According to TechTarget, replication is the process of copying data from one location to another over a SAN, LAN or local WAN. This provides you with multiple up-to-date copies of your data. Look at replication as an aspect of DR/BC. Although it is a key technology in order to implement a complete DR/BC plan, it needs to be combined with data deduplication, virtual servers or even the cloud. But let’s take a step back to really understand business continuity.
This document summarizes findings from analyzing failure trends in a large population of disk drives used in Google's computing infrastructure over a period of several years. Some key findings include:
1) Contrary to previous reports, there was little correlation found between failure rates and elevated temperature or high activity levels.
2) Some SMART parameters like scan errors, reallocation counts, and offline reallocation counts showed a strong correlation with failure probability.
3) Despite correlations with some SMART parameters, models based on SMART data alone are unlikely to accurately predict individual drive failures due to many failed drives not exhibiting predictive SMART signals.
The Alliance for Water Stewardship Beta International Water Stewardship Standard provides a roadmap for companies and utilities to follow towards sustainable water use. Participants will learn about the Alliance, how the Standard can help transform water management, and how to help improve the Standard before it is finalized in 2014. This presentation was given by Kathryn Buckner, President, Council of Great Lakes Industries.
How to mitigate risk in the age of the cloudJames Sankar
The convergence of mobile, cloud computing and the Internet of
Things (IoT) heralds a new era of hyper connectivity, and with it,
high expectations from students, staff and faculty for anywhere,
anytime Internet availability and data sharing in real time.
Moving services to the cloud can deliver significant infrastructure
benefits and cost efficiencies to help the education sector meet these
new expectations, but these opportunities come with risks that are
sometimes overlooked in the rush to join the crowd in the cloud.
It’s important to consider the risks, as well as the benefits, when
making decisions around out-sourcing IT services to the cloud.
Rethinking business continuity and disaster recovery plans is vital for
ensuring that any investment in cloud services will meet the service
delivery expectation goals of institutions, now and into the future.
The document discusses quantitative risk analysis methods for space system projects using an event chain methodology. It describes defining events and event chains that can impact a project, analyzing their probabilities and relationships, and using Monte Carlo simulation to assess their cumulative effects over time. A project example illustrates defining activities, assigning risks and mitigation efforts as events, tracking performance against the original estimate, and regularly reassessing events based on new data. The methodology aims to help project managers better understand project uncertainties and risks.
The document describes the design, development, and testing of a wireless 802.11 sensor for condition monitoring in electrical substations. Key aspects include:
1) The sensor design includes components for wireless communication, data acquisition, power regulation, and energy harvesting from solar power.
2) Laboratory and field tests evaluated the sensor's data acquisition performance and immunity to interference in high voltage environments.
3) Test results demonstrated the sensor could perform continuous wireless data acquisition of insulator pollution levels and earth impedance measurements in substations.
SAIEE presentation - Power System Resilience - Why should we CARE as energy u...Malcolm Van Harte
Power system resilience is an important concept for network planners to consider. It involves preparing infrastructure to withstand and recover quickly from extreme and low probability events through measures taken before, during, and after incidents occur. Resilience is a multifaceted concept that goes beyond traditional reliability metrics to quantify the impact of events like natural disasters, space weather, cyber attacks and terrorism. Adopting resilience principles requires assessing threats and vulnerabilities, quantifying consequences, and developing strategies to contain impacts, coordinate response and recovery, and compress restoration times.
Confronting The Paradox Of Information Technology In Healthv2HealthXn
This document discusses the paradox of information revolution in health. It notes the rising demand on health systems due to aging populations and chronic illness, yet constrained capacity due to safety, workforce and cost issues. While health IT is seen as a solution, its implementation faces risks like poor connectivity, lack of standards and increased staff frustration if not done properly. The document argues we must address issues like competency, governance and workflow to successfully harness technology and overcome this paradox of having plenty yet experiencing starvation in health systems.
Legal Firms and the Struggle to Protect Sensitive DataBluelock
Survey results from the 2016 IT Disaster Recovery Planning and Preparedness Survey | Bluelock commissioned with ALM to asses the current state of the legal industry's IT disaster recovery (DR) preparedness, pressures and confidence.
Legal Firms and the Struggle to Protect Sensitive DataKayla Catron
Survey results from the 2016 IT Disaster Recovery Planning and Preparedness Survey | Bluelock commissioned with ALM to asses the current state of the legal industry's IT disaster recovery (DR) preparedness, pressures and confidence.
The influence of information security onIJCNCJournal
This document summarizes a research study on how information security influences the adoption of cloud computing. The study utilized surveys of IT managers and directors to examine how their perceptions of security, cost-effectiveness, and compliance impact decisions to adopt cloud computing. The results of the multiple linear regression analysis showed that management's perception of cost-effectiveness more significantly correlates to their decision to adopt cloud computing than does their perception of security. The document provides background on cloud computing models and adoption theories to help explain the context and methodology of the research study.
3 D's of test data management managing effectively the underlying challenges...Ajeet Singh, PMP, CSM
The document discusses the key challenges in managing the three processes - dispensation, deployment, and depersonalization (3Ds) of test data from production environments. These include identifying correct data owners for approval, assessing available space in test environments, maintaining data integrity, selecting relevant data for testing, complying with privacy policies during depersonalization, and ensuring coordination between various support groups. Proactive management of the interdependent 3D processes is important to avoid delays in testing schedules and cost overruns.
Six questions every health industry executive should ask about cloud computing
The document discusses 6 key questions that health industry executives should ask when evaluating potential adoption of cloud computing. Cloud computing can provide computing capabilities over the internet and offers potential benefits like lower costs, flexibility, and faster deployment. However, concerns around data security and privacy are barriers to adoption in healthcare. Private clouds within healthcare organizations may be the initial approach before public cloud infrastructure is utilized more broadly.
InterSystems UK Symposium 2012 Corporate OverviewISCMarketing
This document discusses InterSystems' approach to addressing big data challenges through its products and technologies. It notes that InterSystems supports high data volumes, velocities, and varieties through products like Caché, Ensemble, HealthShare, and TrakCare. Key technologies discussed include DeepSee for embedded analytics and iKnow for unlocking information from unstructured data sources. The document presents examples of how these products and technologies are used by customers to drive real-time, personalized insights and informed actions.
This white paper discusses how utilities can leverage big data and real-time analytics to achieve situational awareness for smart grids. It argues that the true purpose of big data is to take action by making accurate, timely decisions through situational awareness. It outlines the unique big data challenges utilities face related to volume, velocity, variety, validity and veracity of their data. Traditional relational databases and data historians are insufficient for utilities' needs. Instead, flexible and scalable object-oriented databases and NoSQL technologies are needed to integrate diverse data types and conduct analysis across multiple domains in real-time to enable situational awareness. This will allow utilities to understand power flows and make critical decisions to maintain grid stability.
3D printing allows physical objects to be produced from digital designs in layers. It is used widely, from shoes to medical devices. 3D printers work by building objects layer by layer using various technologies like inkjet printing. While 3D printers were once large, desktop versions are now available for around $20,000. 3D printing could disrupt traditional manufacturing by enabling on-demand printing of custom products and parts.
This document contains 20 math problem solving questions from a GRE exam with multiple choice answers. The questions cover a range of topics including ratios, percentages, geometry, time, speed, and number properties. An answer key is provided at the end of the document with the correct answer choice for each question.
175 flashcards covering every formula, concept and strategy needed for the quantitative sections of the GRE. Each flashcard is linked to a corresponding video lesson from Greenlight Test Prep’s GRE course.
NOTE: The slideshow can also be downloaded to your smartphone/computer and viewed offline
Failure to recognize unsafe situations. Failure to prevent unsafe actions. Failure to deliver effective operations. These are the results of poor situational awareness in emergency responders of all levels. This program uses real-life case studies and in-class exercises to train emergency responders in applying the six steps of situational awareness and action so that on the fireground and in the field they can be aware, alert, aggressive, always!
Who - Emergency Responders of all levels
What - Situational Awareness
Where - on the fireground / in the field
When - at all times
Why - for safe and effective action
How - through understanding and applying the six steps of Situational Awareness and ACTION
WOW - using real life case studies and in-class exercises
1) The document discusses using "Wardley maps" to better understand organizational strategy and change. Wardley maps combine value chain analysis with models of technological evolution.
2) They help identify user and supplier needs, which are important to sell to and differentiate from competitors. The maps also show how an organization changes over time.
3) An example shows how mapping a large government project clarified user needs, which standard box and wire diagrams failed to do. Wardley maps provide a framework to analyze both current capabilities and future change.
The document discusses the contingency theory of leadership developed by Paul Hersey and Ken Blanchard. The theory focuses on selecting the appropriate leadership style based on the readiness and competence of followers. Effective leadership involves assessing the needs of followers, setting objectives, and delivering the right style of leadership to match the competence and commitment levels of followers. Leaders must demonstrate flexibility in adapting their style to different situations.
The Hacking Team Hack: Lessons Learned for Enterprise SecurityStephen Cobb
Recent aggressive hacks on companies underline the need for good risk analysis, situational awareness, and incident response. Just ask AshleyMadison, Hacking Team, and Sony Pictures.
The document repeatedly states that users can find new GRE study books in PDF format from various publishers like ETS, Gruber, Kaplan, Barron's, Princeton Review, and Manhattan Prep at the URL http://gre-download.blogspot.com. This includes revised GRE material and test preparation books. The document solely focuses on informing users where they can access these GRE resources for free in electronic format.
This presentation describes situational leadership, and how it can be used to make you a better leader
The Situational Leadership model was created by Paul Hersey and Ken Blanchard, all rights of the term belong to them and them alone.
This document provides guidance on mapping components and processes. It outlines 5 steps for mapping: 1) focus on user needs, 2) determine required components, 3) map how evolved the components are, 4) determine appropriate methods based on component evolution, and 5) question how to change or manipulate the map. Additional principles are provided, such as keeping maps meaningfully small, challenging assumptions, and adapting maps based on new information or facts. Example maps are also included to illustrate the mapping process.
The document discusses the anatomy and physiology of the eye, common eye disorders like refractive errors, conjunctivitis, cataract and glaucoma. It explains that refractive errors occur when the eye does not refract or bend light correctly, causing blurred vision. The three main types are myopia, hyperopia and astigmatism. Yoga practices like eye exercises, pranayama, certain asanas and general lifestyle recommendations can help treat minor eye issues and provide stress relief for conditions like glaucoma.
An introduction into the use of Wardley maps for topographical intelligence in business. This includes, why maps matter, how to map, some common economic patterns useful for prediction, common forms of doctrine and the concept of context specific gameplay.
The document contains summaries of various anatomical structures and their features in concise phrases or mnemonics to aid in memorization. Some examples include:
- The abdominal muscles from superficial to deep are the skin, connective tissue, aponeurosis, loose areolar tissue, and pericranium (SCALP).
- The three muscles that flex the elbow are the brachialis, biceps, and brachioradialis (Three B's Bend the elBow).
- The thoracic duct lies between the azygous vein and esophagus ("The duck between 2 gooses").
- The external oblique muscles direct fibers down and toward the
This document discusses the importance of using personas for search engine optimization (SEO) in 2012. It argues that personas help SEO professionals understand their target audiences and create content that meets their needs. The document outlines different types of personas and data sources that can be used to build personas, including ad hoc personas created from social media data or affinity diagramming, and more rigorous data-driven personas built from sources like Nielsen surveys, Experian Simmons data, social media inventories, and surveys. It provides an example of how one company, iAcquire, uses various data sets to develop empirical and socially relevant personas for their clients. Finally, it discusses how personas can be used to map keywords to consumer need states and aid in strategic
Refractive errors occur when there is a mismatch between the eye's optical power and its axial length, causing light rays to focus in front or behind the retina. The most common refractive errors are myopia, hyperopia, and astigmatism. Diagnosis involves using instruments like autorefractors and retinoscopes to measure how light enters the eye. Optical corrections include spectacle lenses, contact lenses, and intraocular lenses, with the type chosen based on factors like comfort, durability, and amount of correction needed.
This document provides an overview of data science work at Zillow. It discusses Zillow's use of machine learning models like the Zestimate and Rent Zestimate to analyze housing data. It describes Zillow's technology stack, which heavily leverages Python, R, and SQL. Specific examples are provided on automated waterfront determination using GIS data and discovering home street features. The document also discusses how tools like Dato and Scikit-Learn are used for tasks like fraud detection, property matching, and data modeling. In closing, current job openings at Zillow are listed.
MOBILE PHONE & MOBILE TOWER RADIATION HAZARDS Neha Kumar
The document discusses the principles and health effects of electromagnetic radiation from cell phones and cell towers. It outlines the presentation which covers cell phone advantages and disadvantages, microwave heating principles, cell phone radiation absorption rates, cell tower antenna radiation patterns, international radiation norms, and conclusions. It provides information on specific absorption rate limits, cell phone use time limits, radiation measurement results near towers, biological effects of radiation like sleep issues and cancer risks, and concerns with current safety guidelines.
This document summarizes a paper that describes how model-driven development (MDD) can be used for safety-critical projects in the energy industry. MDD involves first analyzing problems and potential solutions using techniques like simulation before final decision making. Requirements are formally verified and validated to improve common understanding. Graphical models improve communication by breaking down barriers between domains. MDD has been successfully applied in industries like aerospace, defense, nuclear, automotive, and medical devices. The paper outlines how MDD and requirements-driven engineering can improve quality, reduce costs and risks for complex energy projects.
Dr Dev Kambhampati | Electric Utilities Situational AwarenessDr Dev Kambhampati
This document is a draft of a NIST special publication providing guidance on situational awareness solutions for electric utilities. It includes an executive summary, approach, architecture, and security characteristics for implementing situational awareness. The publication describes a challenge electric utilities face in gaining comprehensive visibility across separate IT, operational technology, and physical security systems. It then outlines a solution developed by NIST to integrate these systems using commercial and open source tools to improve detection of cybersecurity incidents and support regulatory compliance. The benefits of the solution include improved cybersecurity, faster incident response, and more effective risk management.
NIST Guide- Situational Awareness for Electric UtilitiesDr Dev Kambhampati
This document is a draft of a NIST special publication providing guidance on situational awareness solutions for electric utilities. It includes an executive summary, approach, architecture, and security characteristics for implementing situational awareness. The publication describes a NCCoE project that developed an example solution to converge monitoring across IT, operational technology, and physical access systems in order to improve utilities' ability to detect cyberattacks and security incidents. The solution is presented as a modular guide to help utilities implement standards-based technologies in a risk-based manner to gain efficiencies in monitoring, identification, and response to cyber incidents.
1) Condition monitoring of transmission and distribution networks is important to reduce outage costs and ensure reliable electricity delivery. It helps identify equipment failures early to plan maintenance and avoid unplanned outages.
2) When selecting a condition monitoring method, utilities must balance costs of the monitoring technique against costs of missed failures and false alarms. Continuous online monitoring detects more failures but yields more false alarms than periodic monitoring.
3) A full asset management process involves setting performance standards, assessing asset condition and risks, prioritizing maintenance based on condition and risk levels, and planning work accordingly. This helps utilities optimize maintenance planning and budgets.
Protection Scheme in Generation NetworkIRJET Journal
This document discusses protection schemes for generation networks. It covers several topics related to protection schemes including adaptive protection strategies, reliability aspects, self-healing mechanisms, cybersecurity challenges and solutions, and advanced relay technologies and innovations. The document aims to comprehensively explore how smart grid concepts can transform protection relay technology and addresses aspects like data management, protection strategies, fault detection optimization techniques, and network reconfiguration.
Correct time and timing is one of the foundational elements in enabling the communication and orchestration of technologies for accurate and optimal wide area monitoring, protection and control (WAMPAC) in the power industry. The National Institute of Standards and Technology (NIST) and the International Electrical and Electronic Engineer-Standard Association (IEEE-SA) conducted a workshop to gather inputs from stakeholders to identify, analyze, and provide guidance on technologies, standards and methodologies for addressing the practical timing challenges that are currently being experienced in wide area time synchronization. This paper summarizes the NIST “Timing Challenges in the Smart Grid,” workshop in January 2017.
Wide area protection-and_emergency_control (1)Alaa Eladl
This document discusses wide-area protection and emergency control in power systems. It describes how major disturbances can stress power systems beyond their planned operating limits due to unpredictable events. It explores using advanced wide-area monitoring and control systems based on communication and synchronization technologies to automatically detect and respond to disturbances across large regions in order to minimize their impacts. Such systems have potential to provide faster, more coordinated responses than traditional local protection schemes or human operators. The document outlines different types of power system disturbances and remedial measures needed to maintain stability.
Using Predictive Analytics to Optimize Asset Maintenance in the Utilities Ind...Cognizant
Predictive analytics is a process of using statistical and data mining techniques to analyze historic and current data sets, create rules and predict future events. This paper outlines a game plan for effective implementation of predictive analytics.
This document proposes an approach to creating cyber resiliency using emerging technologies and network architectures. It identifies key technologies like deep packet inspection, application performance management, and control plane architectures that can be leveraged to build more resilient networks. The document then illustrates an example architecture and proposes validating cyber resiliency solutions using academic network infrastructure to test solutions on real networks at scale.
This document discusses using artificial neural networks to detect oral cancer from images. It proposes using recurrent neural network (RNN) and artificial neural network (ANN) classifiers to segment, extract features from, and classify images of oral tissue as benign or malignant. The existing methods for oral cancer detection have limitations like low accuracy, high complexity, and difficulty detecting early-stage cancer. The proposed system would use image preprocessing to remove noise, feature extraction to analyze characteristics of the image, and classification algorithms like RNN and ANN to automatically diagnose cancers. It presents data flow diagrams and use case diagrams for the proposed system, and discusses implementing RNN and ANN algorithms to classify images. System testing would evaluate the performance and accuracy of the oral cancer detection system
The document discusses using the Technology Infusion and Maturation Assessment (TIMA) process developed by NASA's Jet Propulsion Laboratory to design and evaluate architectural options for the smart electric power grid in California. TIMA involves identifying key technologies, developing use cases, analyzing risks and barriers, and defining a technology roadmap. The goal is to meet California's energy and climate policy objectives through 2030 and beyond in a cost-effective manner.
In what ways do you think the Elaboration Likelihood Model applies.docxjaggernaoma
This document summarizes common vulnerabilities observed in critical infrastructure control systems based on vulnerability assessments conducted by Sandia National Laboratories. It finds that most vulnerabilities stem from a lack of proper security administration, including failing to define security classifications for system data, establish security perimeters, implement defense-in-depth protections, and restrict access based on operational needs. Many vulnerabilities result from deficient or nonexistent security governance, budget constraints, personnel attrition, and a lack of security training for automation administrators. Comprehensive mitigation requires improved security awareness, strong governance, and configuration of technology to remedy vulnerabilities.
Network performance - skilled craft to hard scienceMartin Geddes
This document describes the technical and business journey for network operators wanting to turn network performance from a skilled craft into hard science.
The document discusses several methods for detecting power islands in grid-connected distributed generation systems. Passive detection schemes have a large non-detection zone while active methods can degrade power quality. Intelligent methods that use artificial intelligence techniques like neural networks, fuzzy logic, genetic algorithms and expert systems show promise for quickly and accurately detecting and classifying islanding conditions. The key advantages of these methods are their ability to learn adaptively and generalize while accurately detecting islanding conditions.
The Indispensable Role of Outlier Detection for Ensuring Semiconductor Qualit...yieldWerx Semiconductor
Outlier detection plays a critical role in ensuring quality and reliability in the semiconductor industry. Outliers are chips that differ from standard parameters despite passing conventional tests, and present an elevated risk of failure. Key outlier detection methodologies are Part Average Testing (PAT) and Good Die in a Bad Neighborhood (GDBN). PAT determines chip averages and identifies outliers as chips that significantly deviate from averages. GDBN detects chips that may fail due to their location within a wafer. As technology progresses, enhanced outlier detection techniques and data analysis systems will support evolving manufacturing processes and product specifications.
ANALYSIS OF SOFTWARE SECURITY TESTING TECHNIQUES IN CLOUD COMPUTINGEditor IJMTER
Cloud Security Testing is becoming a Popular field of Research Topic in Cloud
Computing and Software Engineering. As the advance of cloud technology and services, more
research work must be done to address the open issues and challenges in cloud security testing and
More innovative testing techniques and solutions, Although there are many published papers
discussing cloud Security testing, there is a lack of research papers addressing new issues,
challenges, and needs in Software Security Testing. however, there is no clear methodology to
follow in order to complete a cloud security testing. Since there is an increasing demand in Software
usage there is more in for Software Security Testing. This paper presents an overview of Cloud
Computing, Cloud security testing and comprehensive survey of security Testing Techniques and
methods. from this we have identified problems in the current security testing techniques. This work
has to presents a roadmap for new testers on the cloud with the necessary information to start their
test.
The CERN-EDUSAFE meeting covered work package 3 (WP3) which focuses on studying the scalability and adaptability of hardware and software for the personal safety system module, control system, and data acquisition system. WP3 is divided into optimizing the design and integration of the personal safety system module and designing the control and data acquisition architecture to be adaptable, scalable, and meet requirements. The meeting discussed timelines, deliverables, and milestones for the project components through 2023.
U.S. smart grid expenditures have been compromised largely of advanced metering infrastructure (AMI ) projects over the past five years. However, many utilities are now eager to fully optimize their systems with grid automation projects, which will allow them to fully realize the promise of the smart grid. Grid automation will create a much more reliable and efficient grid, enable optimization of thousands of grid-connected devices and distributed generation sources, and allow for faster outage recovery times.
Federal smart grid deployment targets, renewable portfolio standards, and the need to increase grid reliability have driven U.S. grid automation. However, as electricity markets open up in the U.S., grid automation projects will also be driven by a strong need to increase electric provider customer satisfaction.
As U.S. utilities embrace global standards such as IEC 61850, vendors with field proven grid analytics, advanced DMS, sensors, IEDs, and FLISR solutions will be best positioned in the market. The long-term result of such investments in grid automation will result in a significantly more reliable and efficient grid, higher utility customer satisfaction, and lower energy bills.
The major findings in this report show that a large majority of U.S. utilities are ready to take up the task of building a grid that meets the needs of tomorrow’s Connected Economy. However, utilities will need strong support from industry stakeholders (vendors, integrators, regulators, etc.) and electric customers to meet this goal.
This document provides best practices for improving energy efficiency in data centres. It identifies practices that are expected to be implemented by operators seeking participant status in the EU Code of Conduct on Data Centres. Expected practices include establishing cross-disciplinary governance, auditing existing equipment utilization, rightsizing resilience levels, and selecting energy efficient IT hardware and software. The document provides guidance on retrofitting existing facilities and deploying new services and equipment to optimize power and cooling usage.
Similar to Transf React Proact T&D Ass Management (20)
The document provides an overview of EPA's proposed Clean Power Plan (CPP) under Section 111(d) of the Clean Air Act. Key points:
1) The CPP aims to reduce carbon emissions from existing power plants 30% by 2030 from 2005 levels through four "building blocks" including efficiency improvements, switching to natural gas, renewables, and demand reduction.
2) States must submit plans by 2016 describing how they will meet individualized emission rate targets using these tools. Plans will be evaluated on criteria like enforceability and meeting interim goals.
3) Implementation is uncertain as the final rule is still to come in 2015 and legal challenges are expected from utilities and states over issues like costs, authority
The document discusses a presentation given to the IEEE San Diego Power & Energy and Power Electronics Societies about using object-oriented database technology for advanced utility analytics. It describes the uniqueness of utility big data and critical use cases, and presents an integrated NoSQL data management and analytics solution framework. Examples are given of using NoSQL-based solutions for PMU data analytics to create real-time situational awareness across wide areas of the power grid and enable real-time simulations that could help recognize and avoid blackouts.
This document discusses using advanced analytics and object-oriented database technology to increase situational awareness for the smart grid. It provides examples of how lack of situational awareness contributed to the 2003 North American blackout and recommends establishing real-time monitoring. The document demonstrates an approach using synchrophaser measurement data to track phase angle divergence during the blackout evolution. It also discusses the data challenges of handling synchrophaser and other utility data sources and presents a solution using a NoSQL database that showed performance advantages over a relational database.
This document discusses how object-oriented data management can enable smart energy control in buildings. It describes how traditional building control systems using proprietary and non-interoperable components can be transformed into an open, integrated system using object-oriented data modeling and an embedded object-oriented database to store and manage the building control network configuration. This approach provides benefits like increased productivity for developers, high performance, low maintenance costs, and flexibility to enhance the system over time.
Paper Final Taube Bienert GridInterop 2012Bert Taube
This document discusses using NoSQL data management and advanced analytics for automated demand response (ADR) programs. It notes that ADR will require good data management and analytics to support program execution, accounting, and fault detection. NoSQL databases are proposed as they can better handle the large volumes of diverse data from multiple sources in ADR, including telemetry, usage, events and metadata. Object-oriented data models in NoSQL allow fast, reliable access to different data types and relationships needed for ADR strategies, management and compliance with standards like CIM.
The document provides an overview of EPA's proposed Clean Power Plan (CPP) under Section 111(d) of the Clean Air Act. Key points:
1) The CPP aims to reduce carbon emissions from existing power plants 30% by 2030 from 2005 levels through four "building blocks" including efficiency improvements, switching to natural gas, renewables, and demand reduction.
2) States must submit plans by 2016 describing how they will meet individualized emission reduction targets using these building blocks. Plans will be evaluated on criteria like enforceability and meeting interim goals.
3) Implementation is uncertain as the final rule is still to come in 2015 and legal challenges are expected from utilities and states over issues like costs,
1. SAFER, SMARTER, GREENER
<
<
Date: July 13, 2016
Authors: Bert Taube, Paul Leufkens, Jim Weik, Jesse Dill
WHITEPAPER
Proactive Transmission and
Distribution Asset Management
Utilizing Advanced Data Management and Predictive Analytics
4. This publication or parts thereof may not be reproduced or transmitted in any form or by any means,
including copying or recording, without the prior written consent of DNV GL.
5. | Whitepaper | Cascade | www.dnvgl.com/software Page 1
Table of Contents
1 ABSTRACT ..................................................................................................................... 2
2 KEYWORDS.................................................................................................................... 2
3 EXECUTIVE SUMMARY ..................................................................................................... 3
4 ADVANCED FIELD TESTING & ONLINE MONITORING METHODOLOGIES FOR T&D ASSET
MANAGEMENT & OPTIMIZATION....................................................................................... 4
Asset Diagnostic Categories 4
Examples of Non-Intrusive Asset Diagnostics 5
5 DATA MANAGEMENT & ANALYTICS SOLUTIONS FOR T&D ASSET MANAGEMENT &
OPTIMIZATION............................................................................................................... 8
Risk-Based Maintenance 9
6 MAXIMIZING THE VALUE OF ASSET MANAGEMENT & OPTIMIZATION THROUGH
ADVANCED DATA MANAGEMENT AND PREDICTIVE & PRESCRIPTIVE ANALYTICS .................. 12
The Transformation from Condition to Risk Based Asset Management 12
Embrace Data Analytics 12
Where are Utility Data Analytics Today? 13
Utility Big Data Capabilities to Increase Value from Utility Data Analytics 14
7 PROACTIVE ASSET MANAGEMENT & OPTIMIZATION DRIVEN BY PREDICTIVE &
PRESCRIPTIVE ANALYTICS IN COMBINATION WITH ADVANCED DATA MANAGEMENT,
FIELD TESTING AND ONLINE MONITORING METHODOLOGIES ........................................... 18
Risk-Based Maintenance – Case Study 18
8 REFERENCES.................................................................................................................. 1
6. | Whitepaper | Cascade | www.dnvgl.com/software Page 2
1 ABSTRACT
This paper will merge the concepts of asset field testing and online monitoring with asset criticality-health-
risk (CHR). The goal for that is to design and deploy predictive top-down and bottom-up asset management
(AM) and optimization programs for power transmission and distribution. It will show how such programs
can be enhanced with scalable situational awareness (SA) enabled through, data driven software capabilities
such as advanced predictive and prescriptive analytics and big data processing. This development will drive
next-generation asset management & optimization with informed, event-driven and real-time decision-
making.
2 KEYWORDS
Predictive Asset Management & Optimization, Asset Field Testing and Online Monitoring Methodologies,
Distributed Energy Resources (DER), Energy Storage Systems (ESS), Asset Criticality-Health-Risk (CHR),
Asset Management Top-Down and Bottom-up Strategy, Asset Data Management & Analytics, Big Data, Asset
Data Driven Scalable Situational Awareness, Predictive Data, Test and Online Monitoring Driven Asset
Maintenance
7. | Whitepaper | Cascade | www.dnvgl.com/software Page 3
3 EXECUTIVE SUMMARY
Utilities work continuously to leverage their assets. They are challenged to grow earnings even when they do
not have the corresponding revenue growth. For this there are no standards, only best practices. And
everything is performed under the strict and severe supervision of a public commission while at the mercy of
local circumstances and considerable history. As a result, questions come up: “What field testing can be
done to predict asset lifetime and support a maintenance methodology? How can a testing program be put
together to ensure an outcome of solutions and real data leading to more accurate conclusions about the
remaining lifetime of components and necessary efforts and investments into maintenance?”
Asset management is the name of the game. It maximizes the lifetime of the assets, prevents outages and
other disturbances from happening, and optimizes the maintenance effectiveness and efficiency. NERC
compliance represents only a minimum requirement in asset management. In addition, utilities get new
responsibilities such as safely and securely integrating and operating new distributed energy resources (DER)
composed of renewable sources as well as energy storage systems (ESS) including the necessary power
electronics devices that monitor and control these systems. This all happens while there is still so much
uncertainty about lifetime performance and efficiency of these new disruptive technologies and how they
combine with traditional generation as well as the existing T&D infrastructure. In addition to that, storms
such as Katrina and Sandy have challenged utilities to provide a proper response and demonstrate grid
resilience under abnormal weather conditions. All too often such catastrophic events are claimed to be an
act of God while in many cases weather-related outages can be avoided by applying a tight quality
assurance system to the equipment that is impacted and under distress.
Besides DER, utilities are also faced with a number of new and innovative software technologies to deal with
an exponentially growing variety of networked data sources. Wide-area situational awareness enabled by
better data integration and advanced analytics poses opportunities, but a substantial problem is that the
current utility workforce has not been trained for that. There is huge upside potential leveraging these
innovative software technologies that bring powerful capabilities such as big data processing as well as
predictive and prescriptive analytics. This will hugely impact the effectiveness and efficiency of asset
management and will change the way it is done. Real-time automation enabling event-driven informed
decision making in asset operation and maintenance is at our fingertips. The necessary hardware and
software technologies are available today. The challenge is to integrate them into the existing information
systems infrastructure such that reliable and effective grid operation and maintenance are guaranteed at the
same time.
8. | Whitepaper | Cascade | www.dnvgl.com/software Page 4
4 ADVANCED FIELD TESTING & ONLINE MONITORING
METHODOLOGIES FOR T&D ASSET MANAGEMENT &
OPTIMIZATION
What should be the role of testing of aged asset components? Refurbishment and retrofit are a viable
alternative to investments in new equipment, once a sample test of the refurbished asset demonstrates the
capability for starting a new life. In quite a few cases, experience shows that “vintage” equipment far
exceeds its projected lifetime because at the time of its design, much more margin was included than
nowadays. Also, intelligent use of temporary overloading practices (e.g. dynamic loading of cables and lines)
can be considered as an AM solution.
The first part of AM, acquiring new material, is largely covered by global industry standards, manufacturers’
type-tests, and effective commissioning tests. The reliability of the assets during usage depends upon their
age, conditions at the moment of purchase, specific wear and tear, weather circumstances at their location,
and the maintenance in the field. So far, field testing mainly consists of oil measurement for transformers,
some lubricating and mechanical maintenance, and condition checks on critical assets.
Condition monitoring and advanced maintenance strategies further reinforce reliability. Reliability surveys on
aged components, such as the one recently carried out by Cigré on HV switchgear (Cigre, Oct 2012) and
power transformers can provide major input on failure modes at advanced age and thus help to prioritize
maintenance targets.
The general problem is that both in transmission and distribution there is no real opportunity to take assets
out of service for a condition check. There are too many, it is too costly, the objects and connections are too
critical in their function, the traditional condition check is not sufficiently forward looking, and with
traditional means the economics are not proven.
Asset Diagnostic Categories
The adjectives intrusive/non-intrusive and invasive/non-invasive are commonly used in technical
literature ,the CIGRE working group WG A3.32 recommends using non-intrusive in the context of electrical
equipment because it is more specific and refers to the fact that there is no intrusion into the system.
In medicine, non-intrusive procedures are well defined and known as having clear advantages over other
procedures, as they eventually respect the fundamental principle “first do not harm.” Adopting this to the
domain of electricity is not straightforward. There are two major criteria to classify an asset diagnostic
method as non-intrusive:
1. How the integrity of the asset itself could be potentially affected by the diagnostics and
2. How the grid is affected by the diagnostics.
CIGRE working group WG A3.32 proposes to consider the usefulness of a diagnostic method as its cost
effectiveness, a comparison of its value (benefits versus cost). The value of a diagnostic method is
expressed in terms of condition indicators and the potential diagnosis which one can get using it. The cost of
a diagnostic method equals the total of expenses and effort needed to be able to apply it. WG A3.32
provides guidelines for evaluating value and cost in order to help grid operators appreciate non-intrusive
diagnostic methods.
9. | Whitepaper | Cascade | www.dnvgl.com/software Page 5
Examples of Non-Intrusive Asset Diagnostics
Examples of non-intrusive asset diagnostics are manyfold as asset management and optimization develops
further. The introduction of sensor and measurement components in existing assets as well as in new asset
solutions enjoys growing popularity due to the increasing expectations and possibilities from data driven
approaches to unveil significant value with new and innovative utility business models.
Non-Intrusive Diagnostics for MV and HV Switchgear
MV and HV switchgears are composed of highly costly circuit breakers and represent an important asset
solution category in power delivery. No surprise that CIGRE WG A3.32 has established particular focus on
this asset class. More than a hundred diagnostic methods, mostly non-intrusive, have been identified. The
methods generate a multitude of condition indicators using diagnostic tests, diagnostic measurements and
sensing, signal processing, data analysis as well as soft- and firmware.
The following (Figure 4.1) illustrates the distribution of the different types of diagnostic methods (non-
intrusive, minimally-intrusive, intrusive). For further detail, please see Uzelac, Pater, Heinrich (CIGRE 2016).
Figure 4.1 – Distribution of Diagnostic Methods for each Intrusion and Voltage Category of
Switchgear
As can clearly be seen, there are a vast majority of non- and minimally intrusive diagnostic methods (95%)
that can be used for proper high- and medium voltage switchgear diagnostics without intrusion during power
delivery service. This implies the possibility to apply data driven analytics to test and identify major
indicators of asset health without service interruption. As a result, the asset conditions can be permanently
monitored and analytics applied in real-time.
69%
26%
5%
Distribution of Number of Diagnostic
Methods for each Intrusion Category
Non-Intrusive
Minimally
Intrusive
Strongly
Intrusive
26%
28%
46%
Distribution of Number of Diagnostic
Methods for each Voltage Category
Medium
Voltage
High Voltage
Medium + High
Voltage
10. | Whitepaper | Cascade | www.dnvgl.com/software Page 6
Figure 4.2 – Typical setup of a Smart Cable Guard sensor placed around the earth leads of a three phase
XLPE MV power cable in a substation.
Non-Intrusive Diagnostics with Smart Cables
New test methodologies offer solutions for a part of the problems. A good example is the Smart Cable Guard
which as an approach has also proven to be useful for other asset types in addition to cables. It is an
instrument to monitor underground power cable systems while the cable is in service (on-line).
It uses two inductive sensors around the cable ends and synchronized fast
communication to a central data acquisition system (Figure 4.2 and 4.3).
SCG’s ability to locate weak spots and to create an on-line PD map has
resulted in many interesting cases of avoided faults, showing its ability to
reduce the system average interruption duration as well as its frequency. On
top of that the collected information describes the health condition at all
cable points to support the correctness of the maintenance strategy.
Non-Intrusive Diagnostics with Smart Wires
Another good example is Smart Wire’s distributed PowerLine Guardian
technology (see Figure 4.4). The device, similar to a current transformer
with on-board computing and cellular connectivity, is mounted directly on
the conductor near the transmission structures. It adds impedance as
needed to “choke” the flow of electrons through overloaded lines and redirect
it to other
transmission
corridors. The
technology represents part of an evolving grid
optimization toolkit to help utilities alleviate
congestion, improve network utilization, manage
changing generation profiles and maintain reliable
electric service. In addition to the previously
mentioned direct operational benefits, the device
collects fast data to describe the dynamic electric
profile of the overhead lines and adjacent
Figure 4.4 – PowerLine Guardian technology for
power flow control on high voltage line
Figure 4.3 – Typical setup
of a Smart Cable Guard
sensor placed around the
earth leads of a three phase
XLPE MV power cable in a
substation.
11. | Whitepaper | Cascade | www.dnvgl.com/software Page 7
components. This technology provides another valuable source for a new class of asset monitoring
information acquired in real-time with the assets in service. It can be leveraged to improve asset
management for overhead transmission lines and related asset components including the monitoring of
DER-related impact on more flexible power conduits for an increasingly solar- and wind- powered grid.
In addition to the PowerLine Guardian device, Smart Wires also developed the PowerLine Router. Its
objective is to directly increase the throughput of underutilized transmission lines, just as the larger and
more capital-intensive flexible AC transmission systems (FACTS) but at much lower cost. The router affects
digital power controls on the transmission grid just as similar devices from companies such as GridCo and
Varentec perform on distribution grids (see Figure 4.5).
Interestingly, all the new monitoring and indicative
signals available from these different technologies now
turn out to be a challenge for traditional data acquisition
systems due to lack of standard interoperability. If this
problem can be solved through adequate design and
integration of data acquisition, communication and
collection solutions to feed existing and new utility
information systems it will result in valuable
contributions to better asset health and predictive
maintenance strategies.
In addition to the well-known and still emerging
advanced metering and synchrophasor infrastructures,
the above new and innovative solutions are available to measure, monitor and control specific points and
areas of the power delivery network. These technologies provide access to fast regional data in the second
and millisecond range, system frequencies where capture of information is not supported by the currently
available and deployed AMI communication systems. While the hard and firmware products available from
various vendors represent valuable options for utilities to improve monitoring and control at the grid edge
(e.g. secondary feeder side of power distribution infrastructures) the development of larger centralized big
data management and analytics solutions fed by the massive amount of newly available data from a wider
range of data points is still in its infancy. This is by and large due to the fact that wide-area communication
technologies to transport all this data over larger distances to central data center locations (i.e. data is
moved to and processed at the utility head-end where the main utility information systems are located) has
not yet sufficiently matured to justify its costs and support for the needed real-time, event driven data
solutions. In addition, today’s trend is clearly toward more distributed grid intelligence with decentralized
grid monitoring and control options. This not only avoids extra time and cost of data transportation but also
enables distributed real-time, event driven monitoring and control performance as expected from the
growing number of intelligent nodes in the transformation toward a more intelligent and smarter power grid.
Nevertheless, an integrated centralized asset data management and analytics solution will be a critical part
of the overall concept of distributed intelligence to enable and manage the single version of the asset data
truth.
The integration of renewable energy sources and energy storage systems currently provides utilities with
new concerns. The first question is what requirements to establish for a product to be purchased particularly
when it represents a first generation development. Today, there are no or inadequate standards available to
Figure 4.5 – ENGO device for decentralized
sensing, monitoring and control of grid edge
12. | Whitepaper | Cascade | www.dnvgl.com/software Page 8
do so. As a consequence, utilities must make difficult technology choices given the lack of opportunity to
find proof of performance. Another critical aspect is the necessary interoperability between the new
components as there is no or little validation. For instance, it is not yet clear whether the best choice for
storage is lithium or flow batteries. Testing technology needs to develop aligned with the technology
evolution itself. However, this is often not the case. In addition, the multi MW size of renewable installations
makes field testing a technically and financially challenging option due to necessary investments in high
power installations.
Part of the solution to the above problems can be found in a so-called “telescope” approach which is based
on the principle to test as much as possible on the smallest scale and work up in size up to in modules
wherever an option exists. This way, only reliability testing of integrated modules is necessary. Two
considerations are to be made. One is that proper functioning of power electronics is heavily related to the
interaction within the immediate grid vicinity. Power flow ripples and electromagnetic surges can produce
responses depending on the specific circuit in which the inverter is positioned. This condition can only be
tested at a specific location and at various circuit loading conditions. The second problem is that proper
functioning of inverters in the grid is highly impacted by their controls and software. This represents again a
local interaction with the grid. As a result, the development of adequate test methodology is critical.
5 DATA MANAGEMENT & ANALYTICS SOLUTIONS FOR T&D ASSET
MANAGEMENT & OPTIMIZATION
When properly applied, a mature, predictive asset management strategy works and provides
numerous benefits to implementing organizations. Chief among these benefits, it maximizes the
value of physical assets to the company’s bottom line. This means back office systems working in
continuity and complement to accurate and critical field work such as inspections and
maintenance.
To develop this type of predictive asset management program, a company must understand what asset
management is and how to get the most out of it. Asset management treats the company and all of its
assets holistically. Asset management is both a top-down and bottom-up endeavor. It is a top-down process
because for asset management to work there has to be a philosophical shift and change leadership at the
top levels. Departments and divisions that used to focus solely on maintaining equipment in their territory
will need to start looking at assets as parts in a company-wide system (Figure 5.1).
It is also a bottom-up system, in so far as equipment data is of paramount importance. To implement an
effective, evolving asset management program, a utility will need to identify and evaluate each maintainable
asset and then develop a comprehensive maintenance strategy to increase the reliability and maximize the
performance results of that asset. Field personnel must be engaged and involved.
Second, asset management brings information from diverse sources (nameplate data, online monitoring
information, conditional information including periodic diagnostic test results, repair activities and so forth)
into one locus of information. All analysis and decisions are derived from this master data set. Having a
current, normalized data source helps eliminate ‘turf wars’ between departments and allows a utility to make
financial decisions based on current, accurate data.
13. | Whitepaper | Cascade | www.dnvgl.com/software Page 9
Third, a mature asset management program monitors equipment health (H) and determines a device’s
criticality (C) to the overall performance of the company. By combining criticality and health, a utility can
evaluate the risk (R) to the organization’s operation, represented by a given piece of equipment.
Using the CHR approach, a utility can effectively identify which devices should be temporarily but
purposefully ignored, which should be maintained, and where and when replacements are required. This
cuts down on unnecessary maintenance and predicts capital expenditures to where they are needed and
most beneficial.
Fourth, asset management provides flexibility, so categories of devices can be evaluated based on individual
corporate situations and goals. A category might be as broad as all oil-filled reclosers or as specific as
substation transformers made by a specific manufacturer in the 1960’s. A category can also include all
devices on a critical transmission line. As more equipment data is collected, it will become easier to identify
trends and, therefore, target equipment groups with similar characteristics and levels of importance.
An asset management system can only be truly considered a predictive maintenance program
when health and criticality can be quantified and used to determine when to ignore, maintain or
replace a given device.
Risk-Based Maintenance
Risk-based maintenance (RbM) has many guises and comes in many forms. The bottom line is this:
Maintenance programs move from being reactive to being proactive. The focus shifts from preventing
Figure 5.1 - Vertical Enterprise Asset Reliability System conceptual map
14. | Whitepaper | Cascade | www.dnvgl.com/software Page 10
failures to predicting what the optimal maintenance schedules are – when maintenance work is most cost
effective. This may seem like a minor difference, but it has powerful ramifications.
To begin, criticality is now included in the decision making process. This is vitally important. Using criticality,
work can be prioritized based on the impact to the corporation upon a specific asset’s failure. Through the
monitoring of operational stress and measuring key electrical and mechanical parameters utilities can
identify when a device crosses a performance threshold that would negatively impact grid operations.
RbM, which is necessary to support organizational reliability goals, is only enabled by a robust predictive
maintenance (PdM) system which allows utilities to identify those assets, which if they fail, have the highest
impact to the enterprise. PdM uses all available equipment health data. As a result, there has to be one
comprehensive, trustworthy source of data. All decisions are made based on this common source of truth.
The Advantages
Predictive maintenance is the most efficient and effective way to schedule maintenance. It also maximizes
the value of diagnostic and monitoring data which produce the most reliable results. This includes the high
volume of data collected from diverse sources, like Smart Grid technologies, such as Smart Meters, or IoT
devices, such as new online monitoring sensors.
PdM allows a utility to view the company as a single entity, without separating goals by department (e.g.
Operations, IT, Budgeting, Financial). By using PdM, a utility can develop risk-based maintenance plans.
Maintenance triggers can be created and alerts sent to allow just-in-time maintenance.
The Disadvantages
Moving from a condition-based to a predictive maintenance approach requires a philosophical shift in the
way everyone in the utility thinks about equipment and the purpose of maintenance. For example, line
workers normally change out oil-filled reclosers every three years. Before PdM or RbM, they thought they
were maintaining the lines. With PdM, they should be thinking, ‘I am ensuring the revenue stream from the
customers on this line, by maintaining or improving this line’s reliability.’ Substation crews might find that
the normally scheduled outage in the spring has been cancelled, because the risk of equipment failure is low
and the loss of revenue does not justify shutting down the substation.
Depending on the previous maintenance system, a PdM system may or may not require training. It may or
may not require the integration of new monitoring systems to get data into a central data storehouse. If
various departments and divisions were used to working autonomously, there may be some resistance to
sharing data and giving up decision making power. However, the cost savings, improved reliability, and
increased organizational efficiency make overcoming these challenges worthwhile and critical to continued
organizational growth and success.
Once a PdM system is in place, a utility can develop a risk and condition-based maintenance system, adding
more sources of data and fine-tuning work and capital expenditure plans, to meet corporate goals.
15. | Whitepaper | Cascade | www.dnvgl.com/software Page 11
Figure 5.2 – Large Substation infrastructure requires better analytic and maintenance tools than
historical time based methods can provide.
16. | Whitepaper | Cascade | www.dnvgl.com/software Page 12
6 MAXIMIZING THE VALUE OF ASSET MANAGEMENT &
OPTIMIZATION THROUGH ADVANCED DATA MANAGEMENT AND
PREDICTIVE & PRESCRIPTIVE ANALYTICS
The Transformation from Condition to Risk Based Asset Management
As elaborated in the previous sections, the current objective of utilities is to move from reactive condition-
based to proactive risk-based asset management. In order to do so, utilities need to introduce the concept
of asset criticality as illustrated in Figure 6.1.
But what does this
transformation mean
from the perspective of
innovative data solutions
driven by capabilities
such as advanced
analytics or big data?
While reactive,
condition-based asset
management is driven
by the actual asset
health identified through
field testing and asset
online monitoring.
Proactive risk-based
asset management
introduces the concept
of asset criticality in
addition to asset health to also weigh in the impact and importance of each asset on the overall performance
of the utility enterprise. This new predictive approach not only needs to introduce the advanced concepts of
predictive and prescriptive analytics in order to identify and perform forward-looking maintenance strategies,
it also requires far more granularity to move from the asset class to the individual asset level, which
essentially requires big data capabilities to allow for the necessary scalability and flexibility to handle both
top-down and bottom-up asset management.
Embrace Data Analytics
Electrical utilities are in the process of moving into the data analytics business. This is the result of several
global forces – one being the proliferation of less expensive electronic monitoring technologies and the
speed and availability of communications systems.
Also, everyone wants to have the ‘smartest’ grid possible. As a result, an unprecedented amount of raw data
is being collected by utilities each day. On the one hand, all that data creates a real opportunity for utilities
to better monitor and understand how a device or system is operating. On the other hand, converting that
sea of data into actionable information can be a daunting task. Therefore, it is imperative to have an asset
management system that can handle, integrate, and verify the data to maximize its value.
Figure 0 – Transforming from reactive to pro-active Asset Management
17. | Whitepaper | Cascade | www.dnvgl.com/software Page 13
A major strength of a mature asset management system is the ability to bring all the data into one ‘store
house’ and develop algorithms that can analyze the data and predict which devices should be ignored,
maintained, or replaced.
Where are Utility Data Analytics Today?
At this point, most utilities are still in the first information-based phase of descriptive and diagnostic
analytics. In other words the data sets are used to answer questions such as “What happened?” or “Why did
it happen?” while some utilities won’t even use the data for exploring those vital concerns. The following,
Figure 6.2, (Gartner’s value curve) addresses that.
Only few utilities leverage
available datasets to
design optimizing
predictive and prescriptive
analytics solutions that
address questions such as
“What will happen?” or
“How can we make it
happen?” which is not
surprising given the
increasingly difficult
nature of the problems as
well as the need for more
advanced data scientists,
which utilities do not
usually have in their own
workforce. While those
would still be available
from top consulting firms, utilities are also mandated to protect the privacy of their customers as well as the
cyber security of their infrastructure. That makes it difficult for them to provide the collected data to
external parties and have those perform the necessary data discovery as well as the development and
deployment of the desired data analytics. There is still plenty to do in order to achieve true value from the
collected data at all levels of difficulty. Unlike the scenario anticipated by many analysts in the last few years,
utilities by in large are still in the first phase where:
data is only collected without specific objectives (‘Yikes! - we have a lot of data’)
data is stored, secured and made available (data fortress)
data is used in basic reporting to deliver information about what happened with limited data
representation and without intuitive explanations (basic reporting)
data is feeding simple dashboards using dynamic data representation to answer the question “What
happened?” in a more intuitive manner (business intelligence)
Figure 6.2 – Analytics Capabilities Framework
18. | Whitepaper | Cascade | www.dnvgl.com/software Page 14
While the above types of value extracted from data are certainly helpful to increase situational awareness at
some enterprise levels they do not support comprehensive analysis that leads to closed-loop automation
with elements such as actionable triggers and real-time decision making.
Tomorrow’s utility data analytics will execute on real-time and near real-time data. It will be predictive and
prescriptive in nature to warrant the necessary modeling and planning based on historic data. And it will
drive business transformation where business process change is initiated by analytics-derived information.
Utility Big Data Capabilities to Increase Value from Utility Data Analytics
The concept of big data has been around for more than a decade. Its potential to transform the
effectiveness, efficiency, and profitability of virtually any enterprise has been well documented. Yet, despite
the concept of big data being well-defined, and the general enormity of its opportunity well-understood, the
means to effectively leverage big data and realize its promised benefits still eludes many.
Big data’s remaining challenge that prevents the realization of these benefits comes in two parts. The first is
to understand that the true purpose of leveraging big data is to take action - to make more accurate
decisions, more quickly. We call this situational awareness, an idea that is quite self-explanatory. Regardless
of industry or environment, situational awareness means having an understanding of what you need to know,
have control of, and conduct analysis for in real-time to identify anomalies in normal patterns or behaviors
that can affect the outcome of a business or process. If you have these things, making the right decision in
the right amount of time in any context becomes much easier.
Achieving situational awareness used to be much easier because data volumes were smaller, and new data
was created at a slower rate, which meant our worlds were defined by a much smaller amount of
information. But new data is now created at an exponential rate, and therefore any data management and
analysis system that is built to provide situational awareness today must also be able to do so tomorrow.
Thus, the imperative for any enterprise is to create systems that manage big data and provide scalable
situational awareness.
The utilities industry is in particular need of scalable situational awareness so that it can realize benefits for
a wide range of important functions that are critical for enabling smart grid paradigms. Scalable situational
awareness for utilities means knowing where power is needed, and where it can be taken from, to keep the
grid stable. When power flow is not well understood, the resulting consequences can quite literally leave
utilities and their customers in the dark: a fitting-though-ironic analogy considering the goal of awareness.
Utilities can learn much about how to achieve scalable situational awareness from other industries, most
notably building management and telecommunications, which have learned to deal well with big data’s
complexity and scale.
The utility industry’s time scales vary over 15 orders of magnitude due to the unique diversity of sensors
and critical business processes, and often at much faster intervals than other industries, which, when trying
to create scalable situational awareness, impacts all five V’s of the industry’s big data pressures.
Analyzing huge volumes of data that span multiple orders of timescale magnitude falls short of traditional
data management technologies’ abilities. Traditional methods of data management, such as relational
databases (RDB) or time-serialized databases, may not have the capability to capture the causal effects of
years or decades of events that may occur in a millisecond or microsecond range, and therefore cannot
meet the real-time smart grids’ scalable situational awareness needs. Additionally, such an array of devices
19. | Whitepaper | Cascade | www.dnvgl.com/software Page 15
and processes create an especially-wide variety of data types and formats that must be considered when
making any decision, and thus for enabling scalable situational awareness. The following figure (Figure 6.3)
summarizes the complexity of utility big data use cases.
A typical utility asset infrastructure is composed of thousands of networked asset components which result
in petabytes of rich and linked grid asset data with deep inheritances (Figure 6.4).
The datasets are not only large in volume but also vary substantially due to the variety in data types and
several orders of magnitude in terms of sample rates. There is a spectrum of data velocity, variety, validity
and veracity. In addition, the base of data generating technology is growing at an exponential rate. Taking
Figure 6.3 – Illustration of the Utility Big Data Problem
Figure 6.4 – Definition of the Utility Big Data Problem
20. | Whitepaper | Cascade | www.dnvgl.com/software Page 16
all that into account it can only be concluded that a predictive and prescriptive asset management and
optimization problem for a complete utility enterprise asset infrastructure with asset monitoring, control and
maintenance at the individual component level would greatly benefit from big data management and
analytics capabilities.
Routine maintenance and repairs to power lines and other grid infrastructure account for a substantial
portion of utilities’ ongoing costs. With a sophisticated data management system that enables advanced
analytics, fault locations can be identified more precisely and characterized even before a truck is sent to fix
it. This can also allow utilities to determine if a truck and crew are needed to fix a problem at all, resulting in
immediate cost savings. Given what has been laid out in previous sections it should be clear that a
comprehensive predictive asset management and optimization solution should leverage big data capabilities
to utilize the power of asset information at the individual as well as collective level. It should take advantage
of advanced parallel computing capabilities (grid and cluster) as well as virtualization and cloud
infrastructure. The utility asset infrastructure evolves more and more into a network of networks. To monitor,
control, model and simulate this infrastructure cannot be done without advanced big data engines to
leverage top-down and bottom-up approaches, representing a trend that will continue in general and is
essential for predictive asset management and optimization.
Data Analytics Systems Requirements for Scalable Situational Awareness in Utility Asset
Networks
The underlying data management and analytics solutions required to provide scalable situational awareness
for intelligent utility asset networks must have five key characteristics: flexibility, interoperability through
connectivity, a control network, it must use open, standards-based data management technologies, and it
must support scalable data analysis.
Flexibility - Unlike many industries, power delivery is notoriously variable, with daily, weekly, and annual
variations due to variability in customer load, generation dispatch, delivery system outages, and other
reasons. This variability has challenged the industry to discern patterns that can be used to identify
abnormal conditions and anomalies that spur critical decisions-making processes. Advanced object-oriented
database technologies can deal with data that looks at voltage and current rate data just as easily as any
other type of data from any other industry. By embedding a variety of different data object models to
capture the different energy data types, as well as corresponding sample rates, object-oriented
programming allows for an integrated data management and analytics concept. It creates the necessary
flexibility to deal with the challenging characteristics of big energy data in real-time. Fast and reliable data
retrieval, suitable data formats for data analysis, one object-oriented programming language (for DDL and
DML), connectivity between objects without application code, direct use and storage of object identities, and
advanced, as well as traditional data management, features merged together represent critical values of a
fully-integrated object-oriented data management and analytics solution. This is what gives you the
situational awareness that is needed for utilities: understanding the immediate value of making a decision to
solve an abnormality in normal data patterns within a relevant time frame.
Interoperability and Connectivity – The intelligent utility asset network of the future will be a massive
collection of devices, sensors, actuators, and systems, all of them creating ever-larger data volumes and
ever greater analytics complexity. In this form, this will be a hugely complex network that must have full
accessibility of all these devices and sensors. Central to enabling this is Internet connectivity, something
21. | Whitepaper | Cascade | www.dnvgl.com/software Page 17
again that Versant’s technologies have proven highly capable of by managing data and analysis for many
global telecommunications service providers.
Control Network - Not only is collecting all of the asset data that asset sensors and devices produce a
challenge, but all of these devices must be fully communicative, interconnected, and critically controllable.
The decisions made based on having full situational awareness must be rapidly translated in to the
functioning grid, which, like enabling interoperability, requires a single, cohesive control system enabled
heavily through Internet connectivity.
Open, Standards-Based Data Management Systems – A network as complex, variable, and fast-moving
as the intelligent asset grid requires billions of devices, sensors, and machines. It is impossible to expect
that any one data management technology vendors’ systems will be used across every grid application and
scenario. But more to the point, smart grids will be integral to the everyday life of billions of people, so as
new technologies are developed and adopted over time the smart grid must be able to adjust and change
the data management systems to meet new requirements. To enable this, utilities must leverage open
system architectures across five specific areas to permit ease of adoption and avoid costly vendor lock-in:
Network Infrastructure: Includes protocol, routers, media type, IT connectivity, etc.
Control Devices: Heavily-utilized devices that produce, consume, and manipulate data, as well as
control and monitor the energy grid network.
Network Management and Diagnostic Tools: Enable configuration, commission, and
maintenance for the system.
Human-Machine Interface (HMI): Includes the visualization tools through which users and
managers obtain a view into the system, including both PC software and instrumentation panels.
Enterprise/IT Level Interface: Connects the control network into the data network. No gateways
other than open systems standards-based routers and IT-based data exchange mechanisms are
used.
A critical sixth factor is the data management system itself, which must also be considered part of this open
standards-based architecture. The DB represents the configuration database for the complete network of the
grid, storing the configuration profile data of every device participating in the open, fully interoperable and
integrated control network, and enabling effective communication and control between them all.
Scalable Data Analysis - Utilities will face immense data volume increases over the next several decades,
making the job of ensuring the validity and veracity of data analysis ever harder. Open architectures and
data management technologies will play a pivotal role in enabling data analysis that scales to these new
volume demands. These systems must not only be capable of dynamically scaling to account for and
manage increased data complexity, but also sheer volume as new types of devices are deployed on the grid
network.
22. | Whitepaper | Cascade | www.dnvgl.com/software Page 18
7 PROACTIVE ASSET MANAGEMENT & OPTIMIZATION DRIVEN BY
PREDICTIVE & PRESCRIPTIVE ANALYTICS IN COMBINATION
WITH ADVANCED DATA MANAGEMENT, FIELD TESTING AND
ONLINE MONITORING METHODOLOGIES
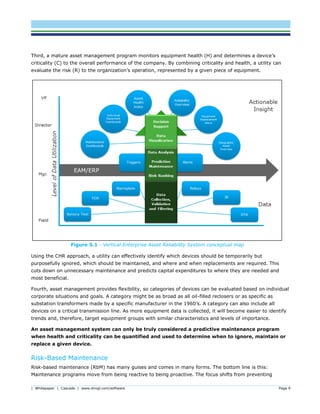
Today, asset management is one of the most critical components of the utility business model. The
identification of asset health is instrumental in the approach. It is driven by asset field testing as well as
asset online monitoring. While field testing has only limited possibilities of application online monitoring
becomes more and more important as the asset infrastructure can remain in-service.
While current asset management is reactive in nature for most utilities, the newly available data streams
from asset online monitoring offer tremendous opportunity for development and deployment of more
advanced proactive predictive and prescriptive analytics solutions supported by capabilities such as big data
engines and advanced computing. As a result, top-down and bottom-up concepts can be applied to asset
management going from the asset class to the individual asset level, the predictive and prescriptive concept
embraced by asset criticality and risk can be integrated in the asset management approach to move from a
reactive to a proactive asset management, situational awareness in the asset infrastructure becomes more
and more real-time and event driven, and informed decisions can be taken without excessive delay.
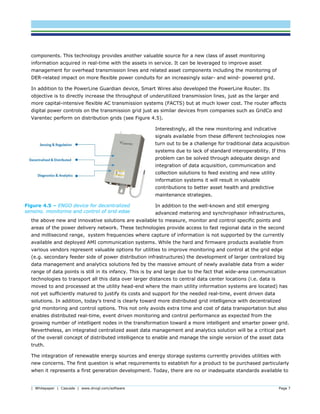
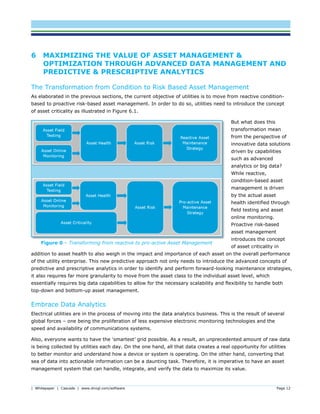
One of the key elements in this transformation toward a more proactive and data driven asset management
is a properly defined asset management system software which can model the asset infrastructure, identify
bottlenecks, and act where needed. If a utility is collecting more data, it only makes sense to put that data
to use in as many ways as possible to maximize ROI. The most obvious use is to evaluate the criticality,
health and risk of individual devices. Engineers can use standard industry evaluation criteria, such as
performing maintenance on breakers after ‘X’ number of operations or when a single event had a fault
current above ‘Y.’ With the right asset management system, utilities can also create their own evaluation
criteria quite easily.
Risk-Based Maintenance – Case Study
The following case study demonstrates risk-based maintenance leveraging a study titled “Evaluating oil-filled
Circuit Breakers using CHR Criteria” that can be found in [5]. In this study,engineers at a large investor-
owned utility (IOU) identified the most important risk factors associated with the failure of oil-filled circuit
breakers. They created an algorithm to calculate the chance of failure and rated each of its approximately
20,000 oil-filled circuit breakers in the following four areas:
1. Overstress (A)
2. High maintenance (B)
3. Bushing type (C)
4. Manufacturer (D)
In each category, every breaker was given a score of ‘0’ through ‘3’. The higher the score, the greater the
concern. For example, certain bushing types had a history of failure, so that any breaker with that type of
bushing automatically received a score of ‘3’ for “Bushing Type.”
23. | Whitepaper | Cascade | www.dnvgl.com/software Page 19
Also, historical data showed that overstressed breakers were at significantly greater risk of failure. This was
addressed by creating an algorithm which weighted in the “Overstress” criterion by a factor of 6.
A final score (0…3) was calculated for each breaker using the following algorithm:
𝐹𝑖𝑛𝑎𝑙 𝑆𝑐𝑜𝑟𝑒 =
[6𝐴 + 𝐵 + 𝐶 + 𝐷]
9
Based on the calculated final score the following recommended maintenance activity was triggered for every
breaker:
𝑀𝑎𝑖𝑛𝑡𝑒𝑛𝑎𝑛𝑐𝑒 𝐴𝑐𝑡𝑖𝑜𝑛 = {
𝑵𝒐 𝑨𝒄𝒕𝒊𝒐𝒏: 𝐹𝑖𝑛𝑎𝑙 𝑆𝑐𝑜𝑟𝑒 = 0 𝑜𝑟 1
𝑪𝒍𝒐𝒔𝒆 𝑴𝒐𝒏𝒊𝒕𝒐𝒓𝒊𝒏𝒈: 𝐹𝑖𝑛𝑎𝑙 𝑆𝑐𝑜𝑟𝑒 = 2
𝑹𝒆𝒑𝒍𝒂𝒄𝒆 𝑩𝒓𝒆𝒂𝒌𝒆𝒓: 𝐹𝑖𝑛𝑎𝑙 𝑆𝑐𝑜𝑟𝑒 = 3
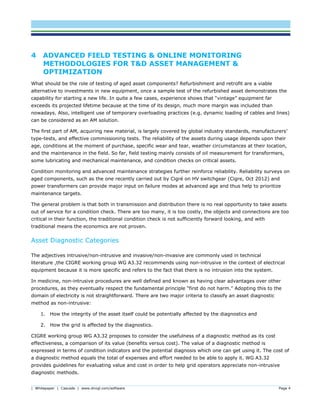
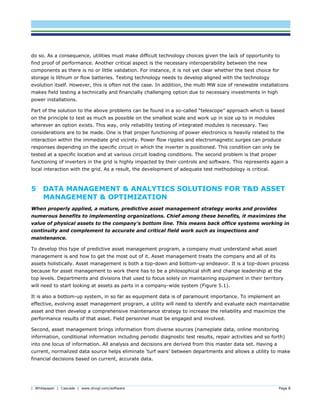
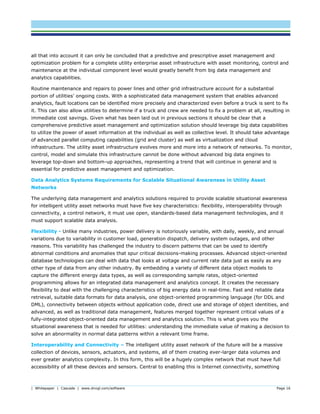
As a result of this evaluation, the utility scheduled the replacement of 800 of its oil-filled breakers (4%) over
a ten year period. Roughly 1,400 breakers (7%) were monitored more closely. About 89% of the breakers
did not require any action. The following figure 11 illustrates the percentage split of the identified
maintenance actions:
Figure 7.1 – Oil-Filled Circuit Breaker CHR Results
By using the CHR approach, the utility identified where the greatest risk existed and took action to reduce it.
This capability represents one of the benefits of a robust AM system.
Also, predictive and prescriptive maintenance systems have the capability to determine and set thresholds
that trigger maintenance (or replacement) to reduce the risk of failure. For example, a transformer can be
operated under heavy-load conditions for a long time without suffering undue damage. But, if a transformer
is overheated once, its life span can be reduced to essentially zero. Preventing a transformer from crossing
the threshold (from ‘hot’ to ‘too hot’) can mean the difference between regular maintenance and potential
replacement.
In addition, moving to a predictive/prescriptive or reliability-centered maintenance system is to use CHR to
optimize non-operational aspects of the corporation. This can include required reports on reliability metrics
(SAIDI, SAIFI, MAIDI, MAIFI) and on regulatory compliance.
24. | Whitepaper | Cascade | www.dnvgl.com/software Page 20
Asset management systems can provide a host of benefits to utilities wanting to capitalize on their data
systems and maximize asset health and reliability. Asset management, when systematically applied:
Collects and analyzes available data and uses it to make informed decisions about the conditions of
the equipment.
Identifies and schedules necessary maintenance on the most critical assets, while reducing or
eliminating unnecessary work.
Removes device, personnel and system risk by eliminating unnecessary maintenance and inspection
work.
Determines the most cost-effective capital replacement plan.
Provides regulatory compliance information and reporting capabilities.
Improves reliability by managing system risk, thereby improving customer satisfaction and
increasing revenue.
25. 8 REFERENCES
1. “A Case for Best of Breed Technical Asset Management and Predictive Maintenance Utility Software –
A Solution for Engineering Operations and Asset Management”, White Paper 2013, Digital
Inspections.
2. “Asset Management of T&D Equipment and Integration of Renewables Needs Advanced Field Testing
Methodology”, Paul Leufkens, February 2016.
3. “Data Correlation – Effectively Combining Grid Data with Public Data and Social Media Data to
Maximize Forecasting Accuracy,” T. Borst and P. Myrseth, DNV GL Presentation, 2016.
4. “Flexibility in Wind Power Interconnection Utilizing Scalable Power Flow Control,” P. Jennings, F.
Kreikebaum, and J. Ham. CIGRE Grid of the Future Symposium, 2015.
5. “Fundamentals of CIM for Big Data Integration and Interoperability,” S.Pantea, N. Petrovic and I.
Kuijlaars, Presentation, Grid Analytics Europe, April 2016.
6. “Growing an Asset Management Program – Steps to Take and Advantages along the Way”, White
Paper 2014, DNV GL AS.
7. “Leveraging Big Data and Real-Time Analytics to achieve Situational Awareness for Smart Grids”.
White Paper 2012, Versant.
8. “Overview of Non-intrusive Condition Assessment of T&D Switchgear,” N. Uzelac, R. Pater and C.
Heinrich, Paper AS-101, CIGRE Symposium, 2016.
9. “Smart Cable Guard – A Tool For On-Line Monitoring And Location of PD’S AND Faults In MV Cables
– Its Application And Business Case”, Fred Steennis at al., Paper 1044. Cired 23rd
Conference on
Electricity Distribution, June 2015.
10. Cigre report 510: Final Report of the 2004 – 2007 international Enquiry on Reliability of High Voltage
Equipment Part 2 - Reliability of High Voltage SF6 Circuit Breakers – Cigré Working Group A3.06 -
October 2012
26. About the Authors
Bert has spent more than 20 years with technology and consulting
companies such as DNV GL, Siemens, General Electric, Versant and
Supertex creating, leading and delivering projects for high-voltage power
transmission and electric transportation networks, industrial
manufacturing as well as big data analytics and automation software to
serve large-scale, mission-critical infrastructures. He earned a Masters and
Ph.D. in Technical Cybernetics and Automation from the University of
Rostock and an MBA from the Kellogg School of Management at
Northwestern University.
Bert Taube Contact Info:
Bert.taube@sbcglobal.net
408 307 4424
Paul Leufkens, President of the consulting firm Power Projects Leufkens,
has more than 20 years of experience in the power sector. He has worked
internationally in Business Development and Leadership for consulting and
testing companies, including 13 years with KEMA in the Netherlands as
well as in Chalfont, PA. Previously, Paul directed product development for
the T&D cable industry and witchgear manufacturing. He holds a MS EE
degree from Delft Technical University in the Netherlands.
Paul Leufkens Contact Info:
Paul.P.leufkens@ieee.org
267 963 8812
Jim Weik is Regional Sales Manager for DNV GL Software’s Electric Grid
product center. For the past six years, he has managed sales of asset
management solutions for electric utilities in North America. He has over
30 years experience in sales management of engineered solutions with 17
years experience in Asia. He holds an undergraduate degree in Mechanical
Engineering from Washington University in St. Louis and an MBA from
Webster University in St. Louis.
Jim Weik Contact Info:
Jim.Weik@dnvgl.com
541.752.7233 x 76115
Jesse Dill is the Global Marketing Manager for DNV GL Software’s Electric
Grid product center. He manages digital campaigns and outreach designed
to help electric utilities adapt their business processes and systems to
meet the challenges of the modern power market. He has over a decade of
business consulting and marketing experience, with 4+ years in the
electric utility industry. He holds an undergraduate degree in Business
Management as well as an MBA from Oregon State University.
Jesse Dill Contact Info:
Jesse.Dill@dnvgl.com
541 752 7233 x 76114
27. ABOUT DNV GL
Driven by our purpose of safeguarding life, property and the environment, DNV GL enables organizations to
advance the safety and sustainability of their business. We provide classification and technical assurance
along with software and independent expert advisory services to the maritime, oil and gas, and energy
industries. We also provide certification services to customers across a wide range of industries. Operating in
more than 100 countries, our 16,000 professionals are dedicated to helping our customers make the world
safer, smarter and greener.
SOFTWARE
DNV GL is the world-leading provider of software for a safer, smarter and greener future in the energy,
process and maritime industries. Our solutions support a variety of business critical activities including
design and engineering, risk assessment, asset integrity and optimization, QHSE, and ship management.
Our worldwide presence facilitates a strong customer focus and efficient sharing of industry best practice
and standards.