This document provides an overview of improving education systems and outcomes in Turkey based on McKinsey & Company's research and experience working with education systems around the world. It identifies four key themes for improving Turkey's education system: 1) cultivating great teaching and school leadership at a large scale, 2) creating student pathways to success and employment, 3) equipping Turkish students with English proficiency, and 4) improving the role of regional/local education authorities. The document also discusses lessons learned from education systems that have improved, such as the importance of process interventions like collaborative teaching practices.


![12
Our research finds that a unique ‘intervention cluster’ exists for each
improvement journey
SOURCE: McKinsey & Company
Fair to good Good to greatPoor to fair
Great to
excellent
Journey
Shaping the
professional
Improving
through peers
and innovation
Achieving
the basics
of literacy and
numeracy
Getting the
foundations
in place
Intervention
cluster
theme
Common
across all
journeys
Six interventions
1] Revising curriculum and standards
2] Reviewing remunerations
structure
3] Building technical skills
4] Assessing student
5] Utilizing student learning data
6] Revising policy or education
laws](https://image.slidesharecdn.com/20110906improvingeducationinturkeyfinalprint-150314112017-conversion-gate01/85/Improving-education-in-turkey-final-print-13-320.jpg)


![49
A surprising number of teachers across OECD systems do not receive
regular appraisal or feedback
31
23
36
More than once
per year
Once per year
Never or Once
every two or
more years
49
13
38
22
13
65
SOURCE: Teaching and Learning International Survey (TALIS) first results, OECD, 2009,
1 TALIS Survey was conducted in 23 OECD and partner countries: [OECD] – Australia, Austria, Flemish Belgium, Denmark, Hungary, Iceland, Ireland,
Italy, Korea, Mexico, Norway, Poland, Portugal, Slovak Republic, Spain, and Turkey; [Partner countries] – Brazil, Bulgaria, Estonia, Lithuania,
Malaysia, Malta, Slovenia
From principals
From peers or senior
teachers
From external
individual or body
5
Teacher reported frequency of appraisal and/or feedback
Percent (TALIS average1)](https://image.slidesharecdn.com/20110906improvingeducationinturkeyfinalprint-150314112017-conversion-gate01/85/Improving-education-in-turkey-final-print-50-320.jpg)
![50
However, appraisal and feedback usually increases
teacher job satisfaction
Impact of appraisal and feedback on teachers’ job satisfaction
Percentage of teachers who reported the following change to job satisfaction
following the appraisal and/or feedback they received in their school, TALIS1
7
41
52
Decreased
Did not change
Increased
SOURCE: Teaching and Learning International Survey (TALIS) first results, OECD, 2009,
1 TALIS Survey was conducted in 23 OECD and partner countries: [OECD] – Australia, Austria, Flemish Belgium, Denmark, Hungary, Iceland, Ireland,
Italy, Korea, Mexico, Norway, Poland, Portugal, Slovak Republic, Spain, and Turkey; [Partner countries] – Brazil, Bulgaria, Estonia, Lithuania,
Malaysia, Malta, Slovenia
5
Appraisal and feedback also had a positive
impact on teachers performance, with ~40%
of teachers reporting that it made significant
differences in their teaching](https://image.slidesharecdn.com/20110906improvingeducationinturkeyfinalprint-150314112017-conversion-gate01/85/Improving-education-in-turkey-final-print-51-320.jpg)


![72SOURCE: McKinsey & Company interventions database
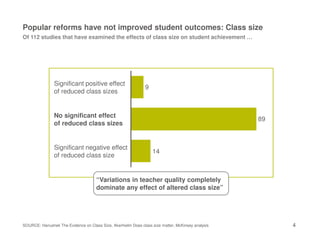
Poor to fair Fair to good Good to great
Intervention
cluster1
▪ Raising calibre of
entering teachers and
principals
– Recruiting programs
– Pre-service training
– Certification
requirements
▪ Raising calibre of
existing teachers and
principals
– In-service training
programs
– Coaching on practice
– Career tracks
– Teacher and
community forums
▪ School-based decision-
making
– Self-evaluation
– Independent and
specialized schools
▪ Cultivating peer-led learning
for teachers and principals
– Collaborative practice
– Decentralizing pedagogical
rights to schools & teachers
– Rotation and secondment
programs
▪ Creating additional support
mechanisms for professionals
– Release professionals from
admin burden by providing
additional administrative staff
▪ System-sponsored
experimentation/innovation
across schools
– Providing additional funding
for innovation
– Sharing innovation from front-
line to all schools
▪ Providing motivation and
scaffolding for low skill
teachers
– Scripted teaching materials
– Coaching on curriculum
– Instructional time on task
– School visits by center
– Incentives for high
performance
▪ Getting all schools to a
minimum quality level
– Outcome targets
– Additional support for low
performing schools
– School infrastructure
improvement
– Provision of textbooks
▪ Getting students in seats
– Expand school seats
– Fulfil students’ basic needs
to raise attendance
▪ Data and accountability
foundation
– Transparency to schools
and/or public on school
performance
– School inspections and
inspections institutions
▪ Financial and organizational
foundation
– Optimization of school and
teacher volumes
– Decentralizing financial and
administrative rights
– Increasing funding
– Funding allocation model
– Organizational redesign
▪ Pedagogical foundation
– School model/ streaming
– Language of instruction
Shaping the professional Improving through peers
and innovation
Achieving the basics of
literacy and numeracy
Getting the foundations in
place
Theme
Great to excellent
Improvement
journey
Common
across all
journeys
Six interventions: [1] Revising curriculum and standards; [2] Reviewing reward and remunerations structure; [3] Building technical skills
of teachers and principals, often through group or cascaded training; [4] Assessing student learning; [5] Utilizing student data to guide
delivery, and [ 6] Establishing policy documents and education laws
1 Total number of interventions in each phase: poor to fair, n=103, fair to good, n=226; good to great, n=150; great to excellent, n=94
A unique ‘intervention cluster’ exists for each improvement journey,
with six interventions common across all journeys](https://image.slidesharecdn.com/20110906improvingeducationinturkeyfinalprint-150314112017-conversion-gate01/85/Improving-education-in-turkey-final-print-73-320.jpg)

![74
Turkey’s student performance on PISA reflects a
wide spread of proficiency
Below Level 1 18%
Level 1 25%
Level 2 25%
Level 3 17%
Level 4 10%
Level 5 4%
Level 6 1%
Level 6: Can conceptualise,
generalise, and utilise
information [in] complex
problem situtations…
advanced reasoning…can
formulate and communicate
actions and reflections
High
Low
Level 3: Executes clearly
defined procedures [and]
develop short
communications…
Level 1: Can answer
questions involving familiar
contexts…carry out routine
problems…perform actions
that are obvious
Turkish students’ performance by proficiency level on 2009 PISA Mathematics
SOURCE: OECD PISA](https://image.slidesharecdn.com/20110906improvingeducationinturkeyfinalprint-150314112017-conversion-gate01/85/Improving-education-in-turkey-final-print-75-320.jpg)