Download to read offline
![Appendix
For Further Reading I
M. Moores, A. N. Pettitt & K. Mengersen
Scalable Bayesian inference for the inverse temperature of a hidden
Potts model.
arXiv:1503.08066 [stat.CO], 2015.
M. Moores, C. C. Drovandi, K. Mengersen & C. P. Robert
Pre-processing for approximate Bayesian computation in image
analysis.
Statistics & Computing 25(1): 23–33, 2015.
M. Falk, C. Alston, C. McGrory, S. Clifford, E. Heron, D. Leonte, M.
Moores, C. Walsh, A.N. Pettitt & K. Mengersen
Recent Bayesian approaches for spatial analysis of 2-D images with
application to environmental modelling.
Envir. Ecol. Stat. 22(3): 571–600, 2015.
M. Moores & K. Mengersen
Bayesian approaches to spatial inference: modelling and computational
challenges and solutions.
In Proc. 33rd
Int. Wkshp MaxEnt, AIP Conf. Proc. 1636: 112–117, 2014.](https://image.slidesharecdn.com/mtmwrug20170316-170321144533/75/Importing-satellite-imagery-into-R-from-NASA-and-the-U-S-Geological-Survey-10-2048.jpg)

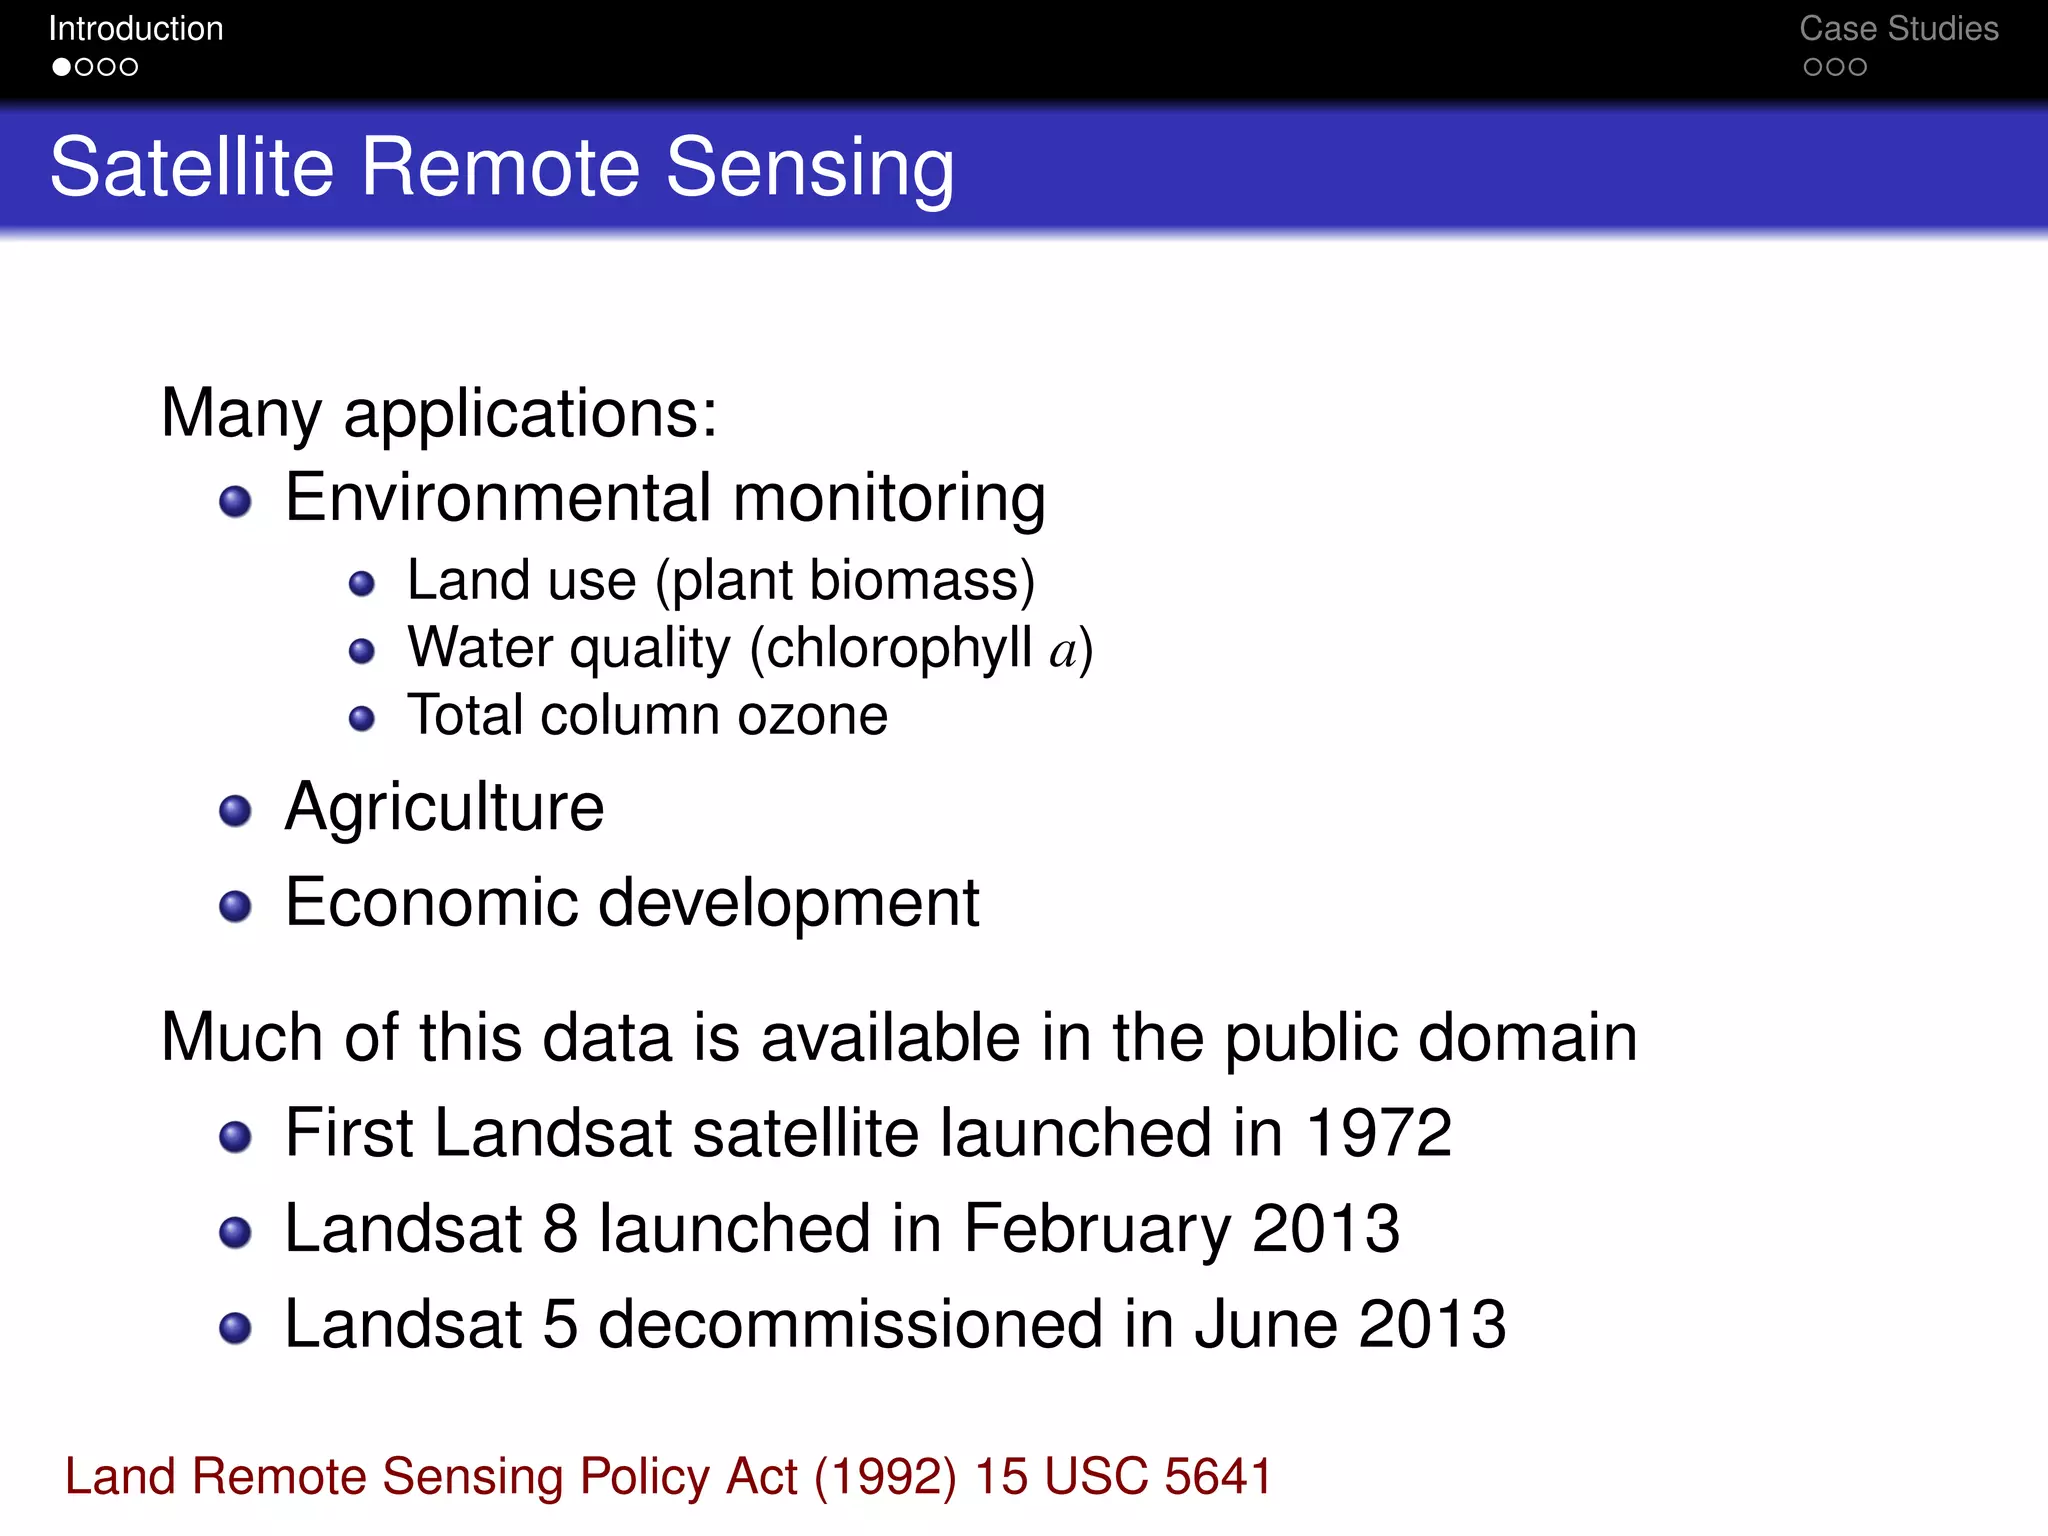
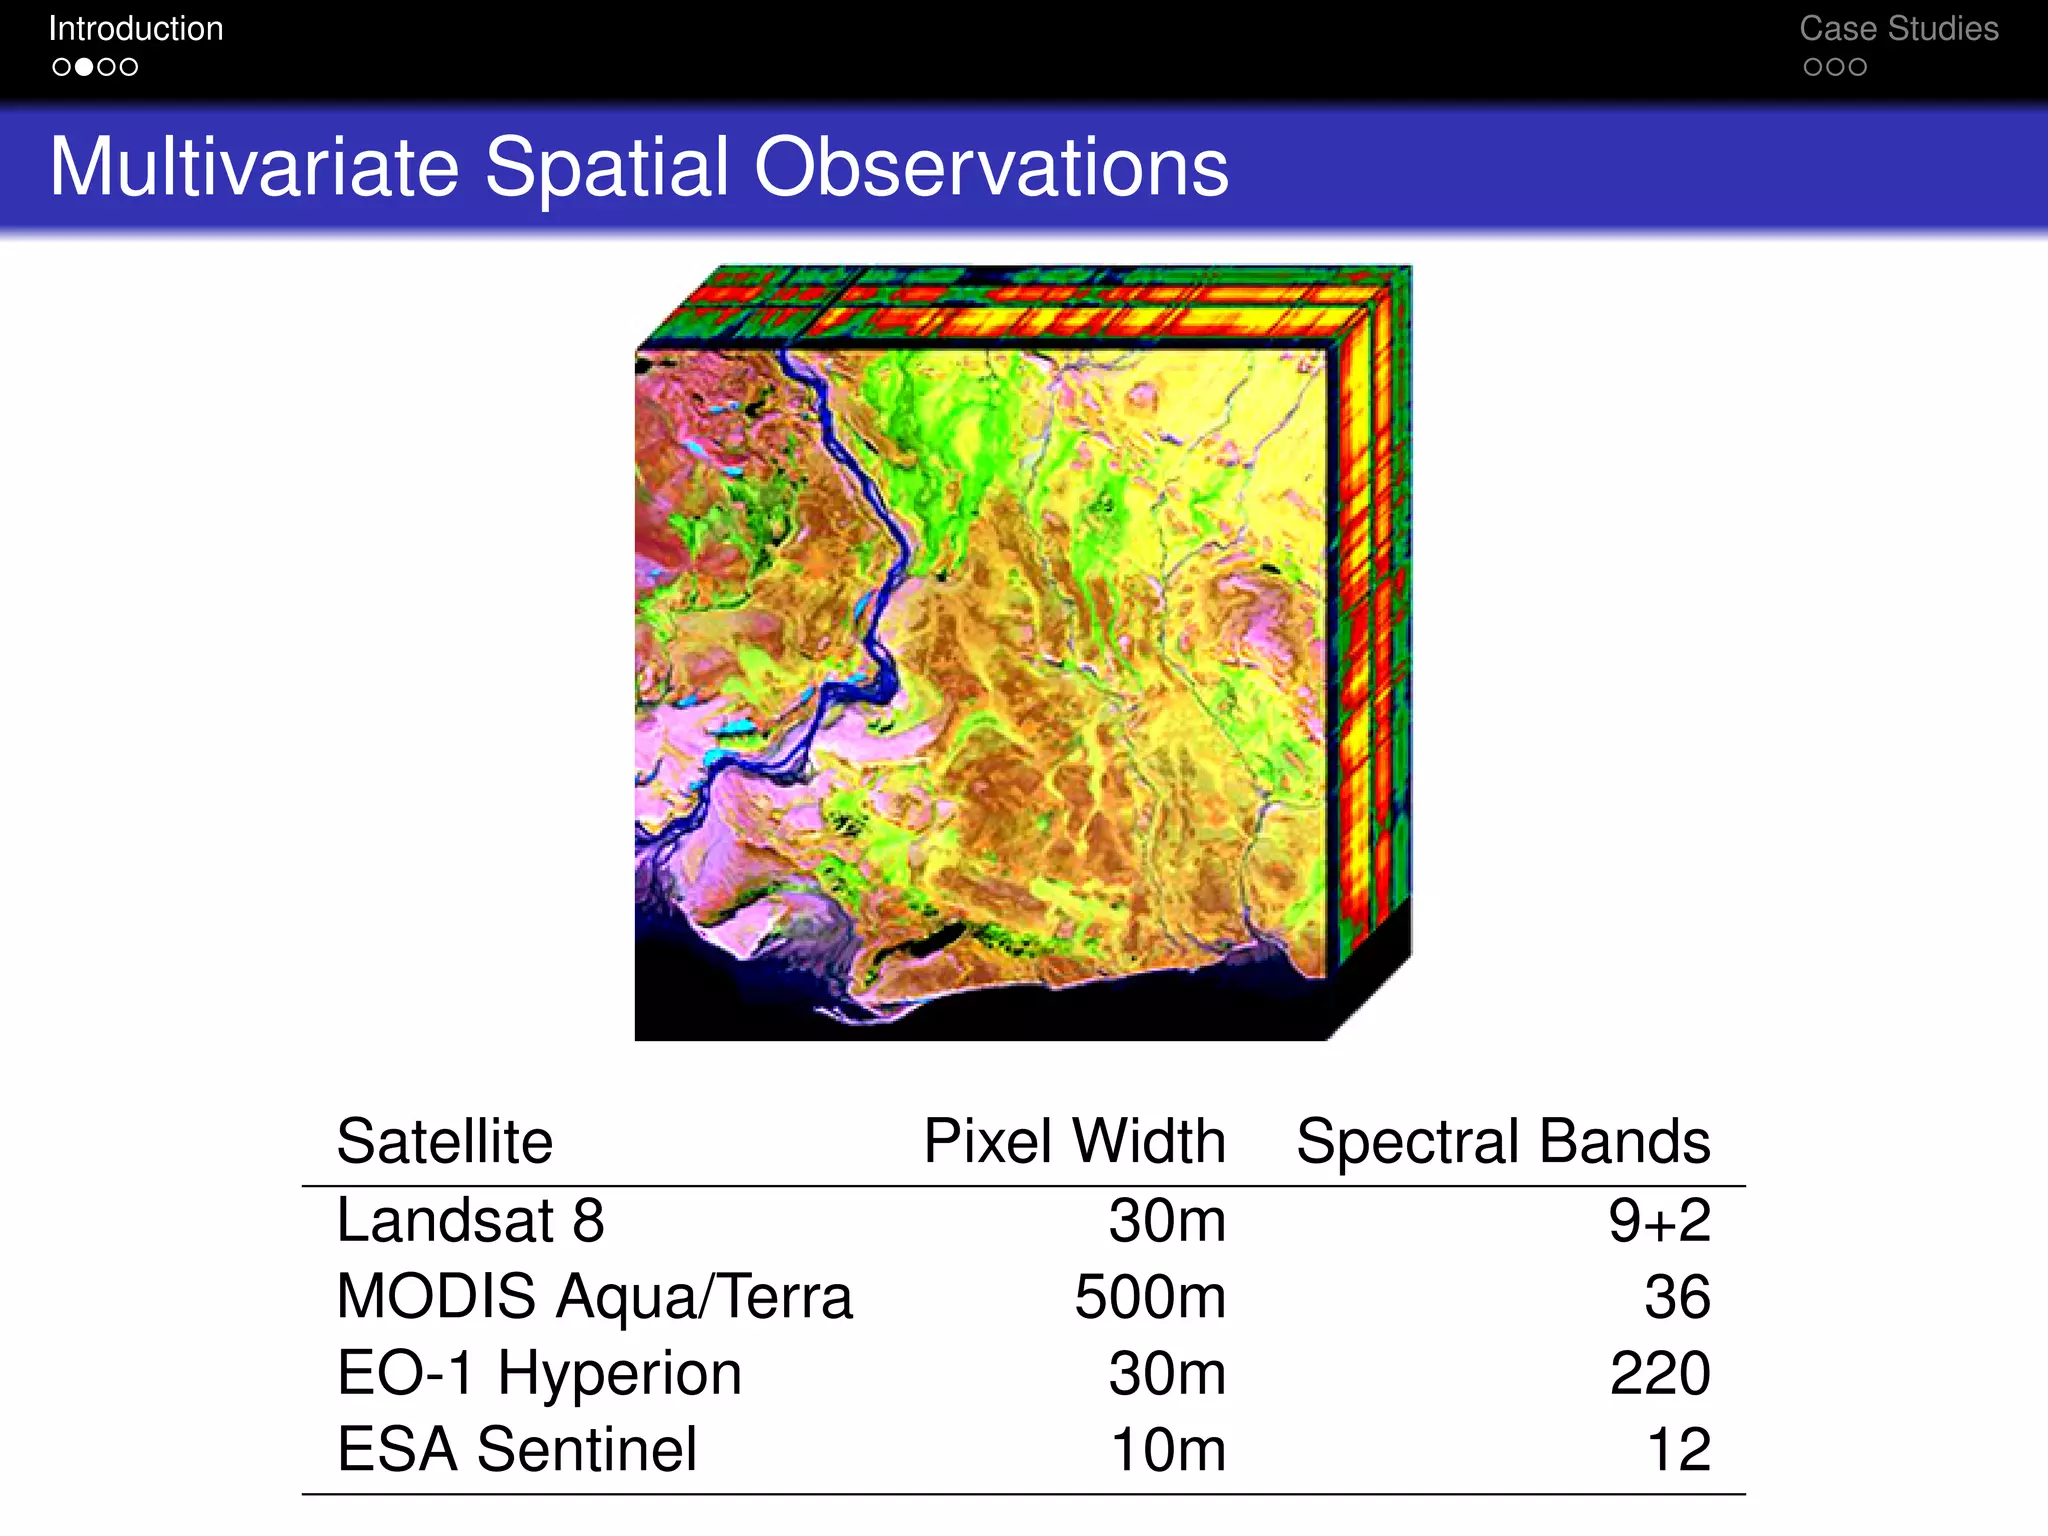
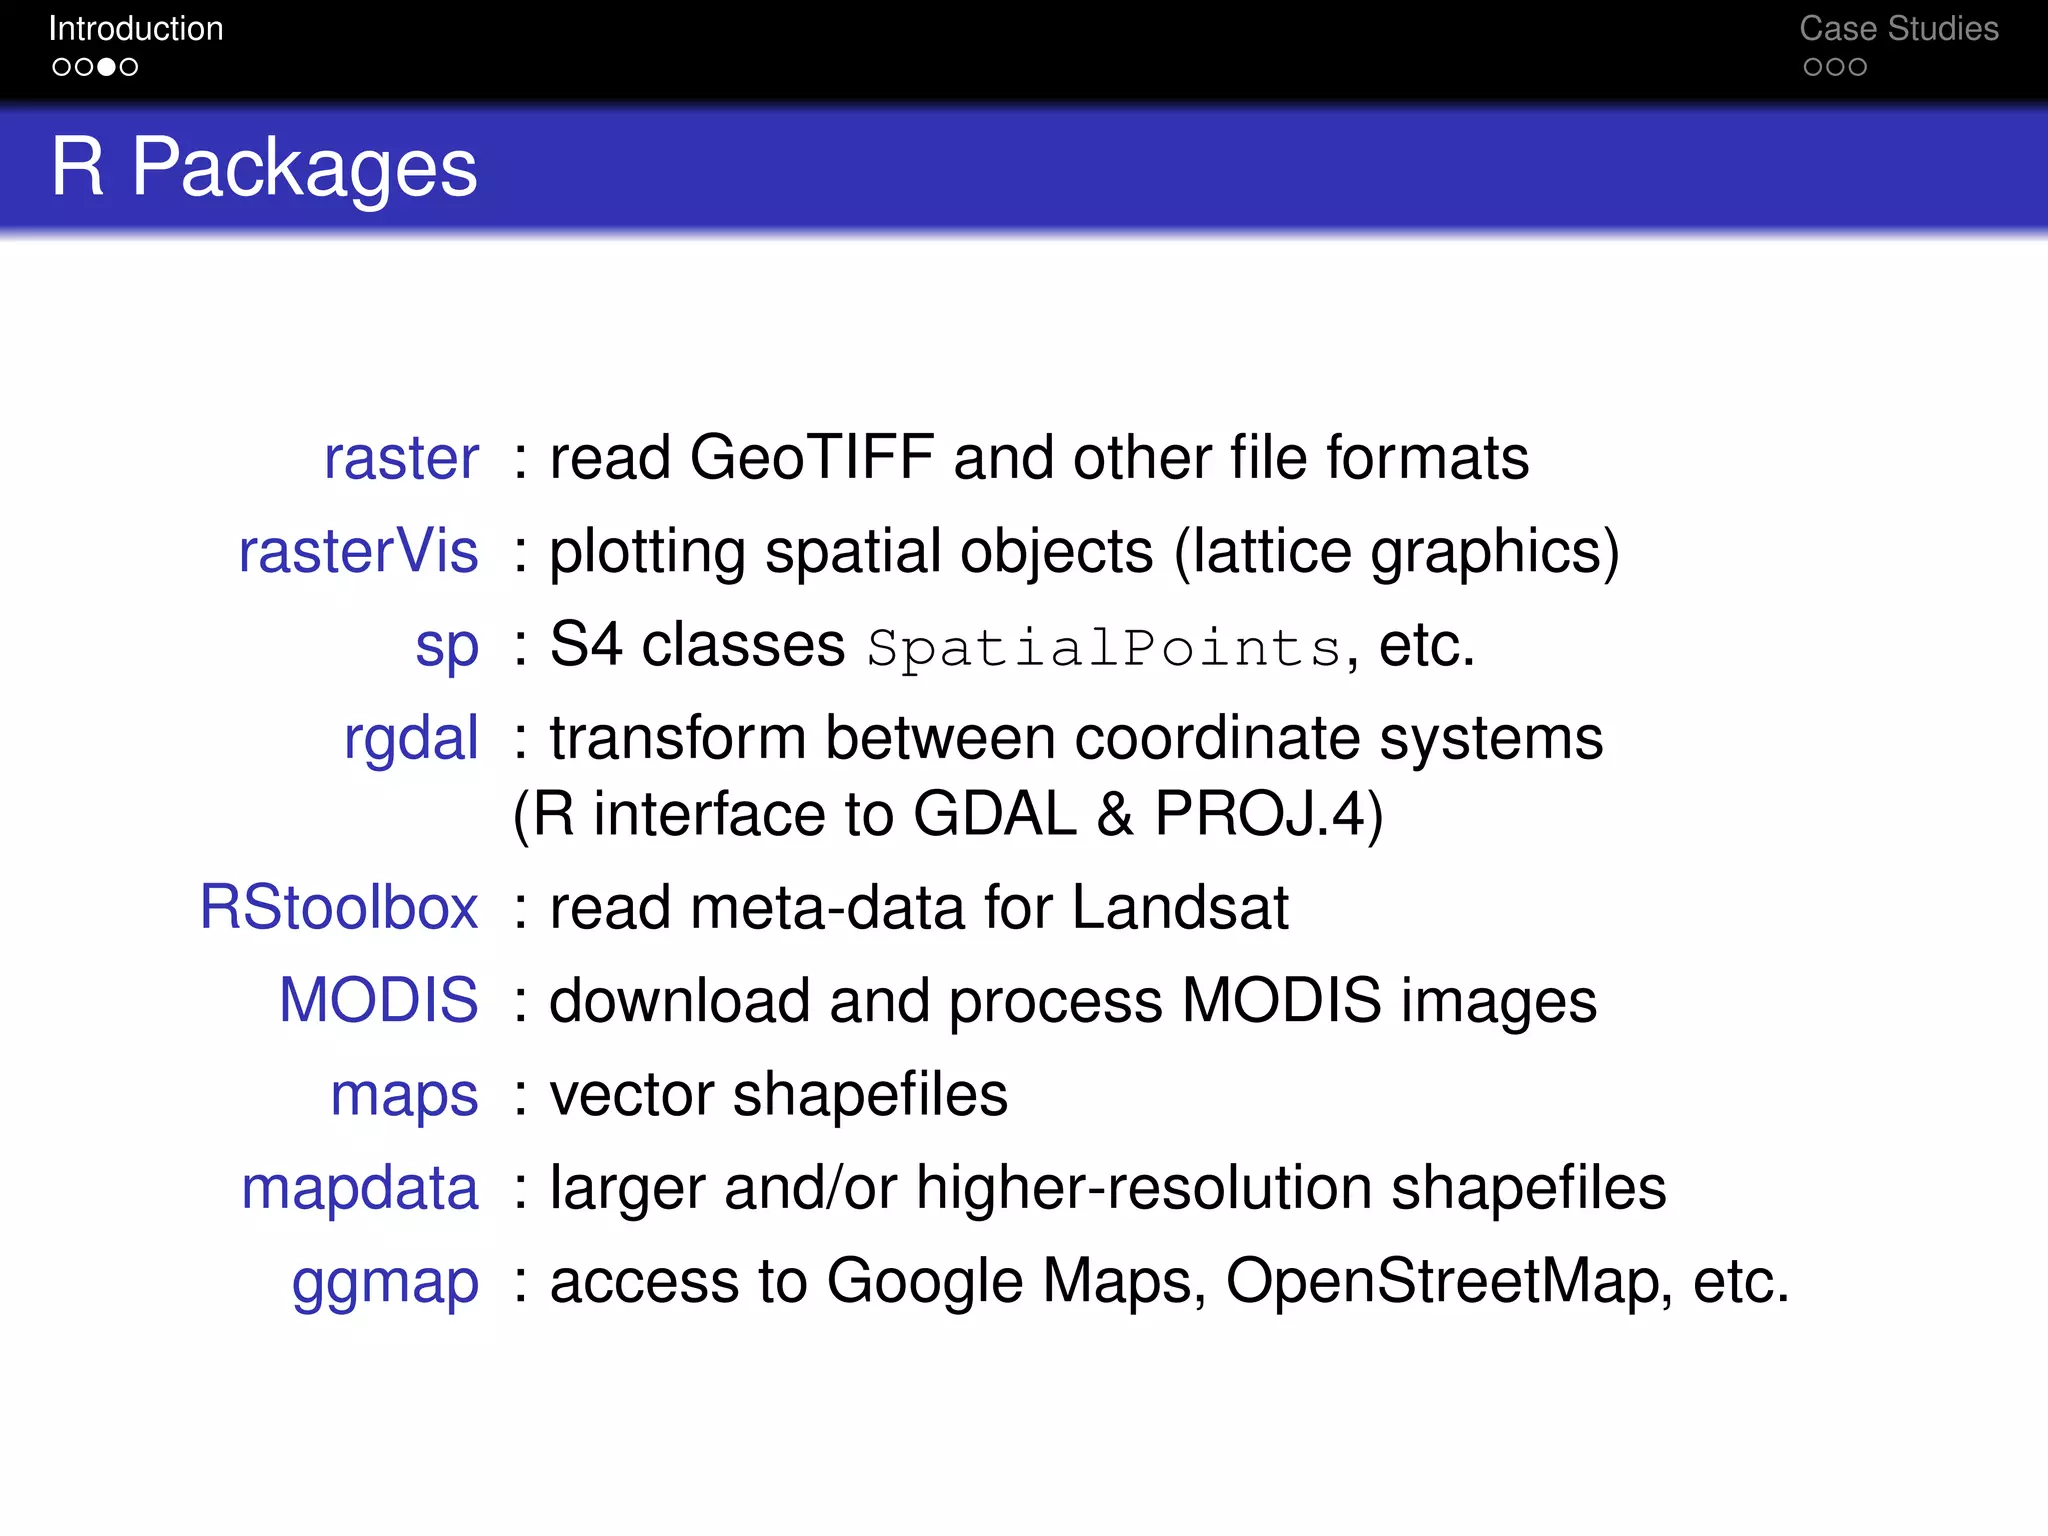
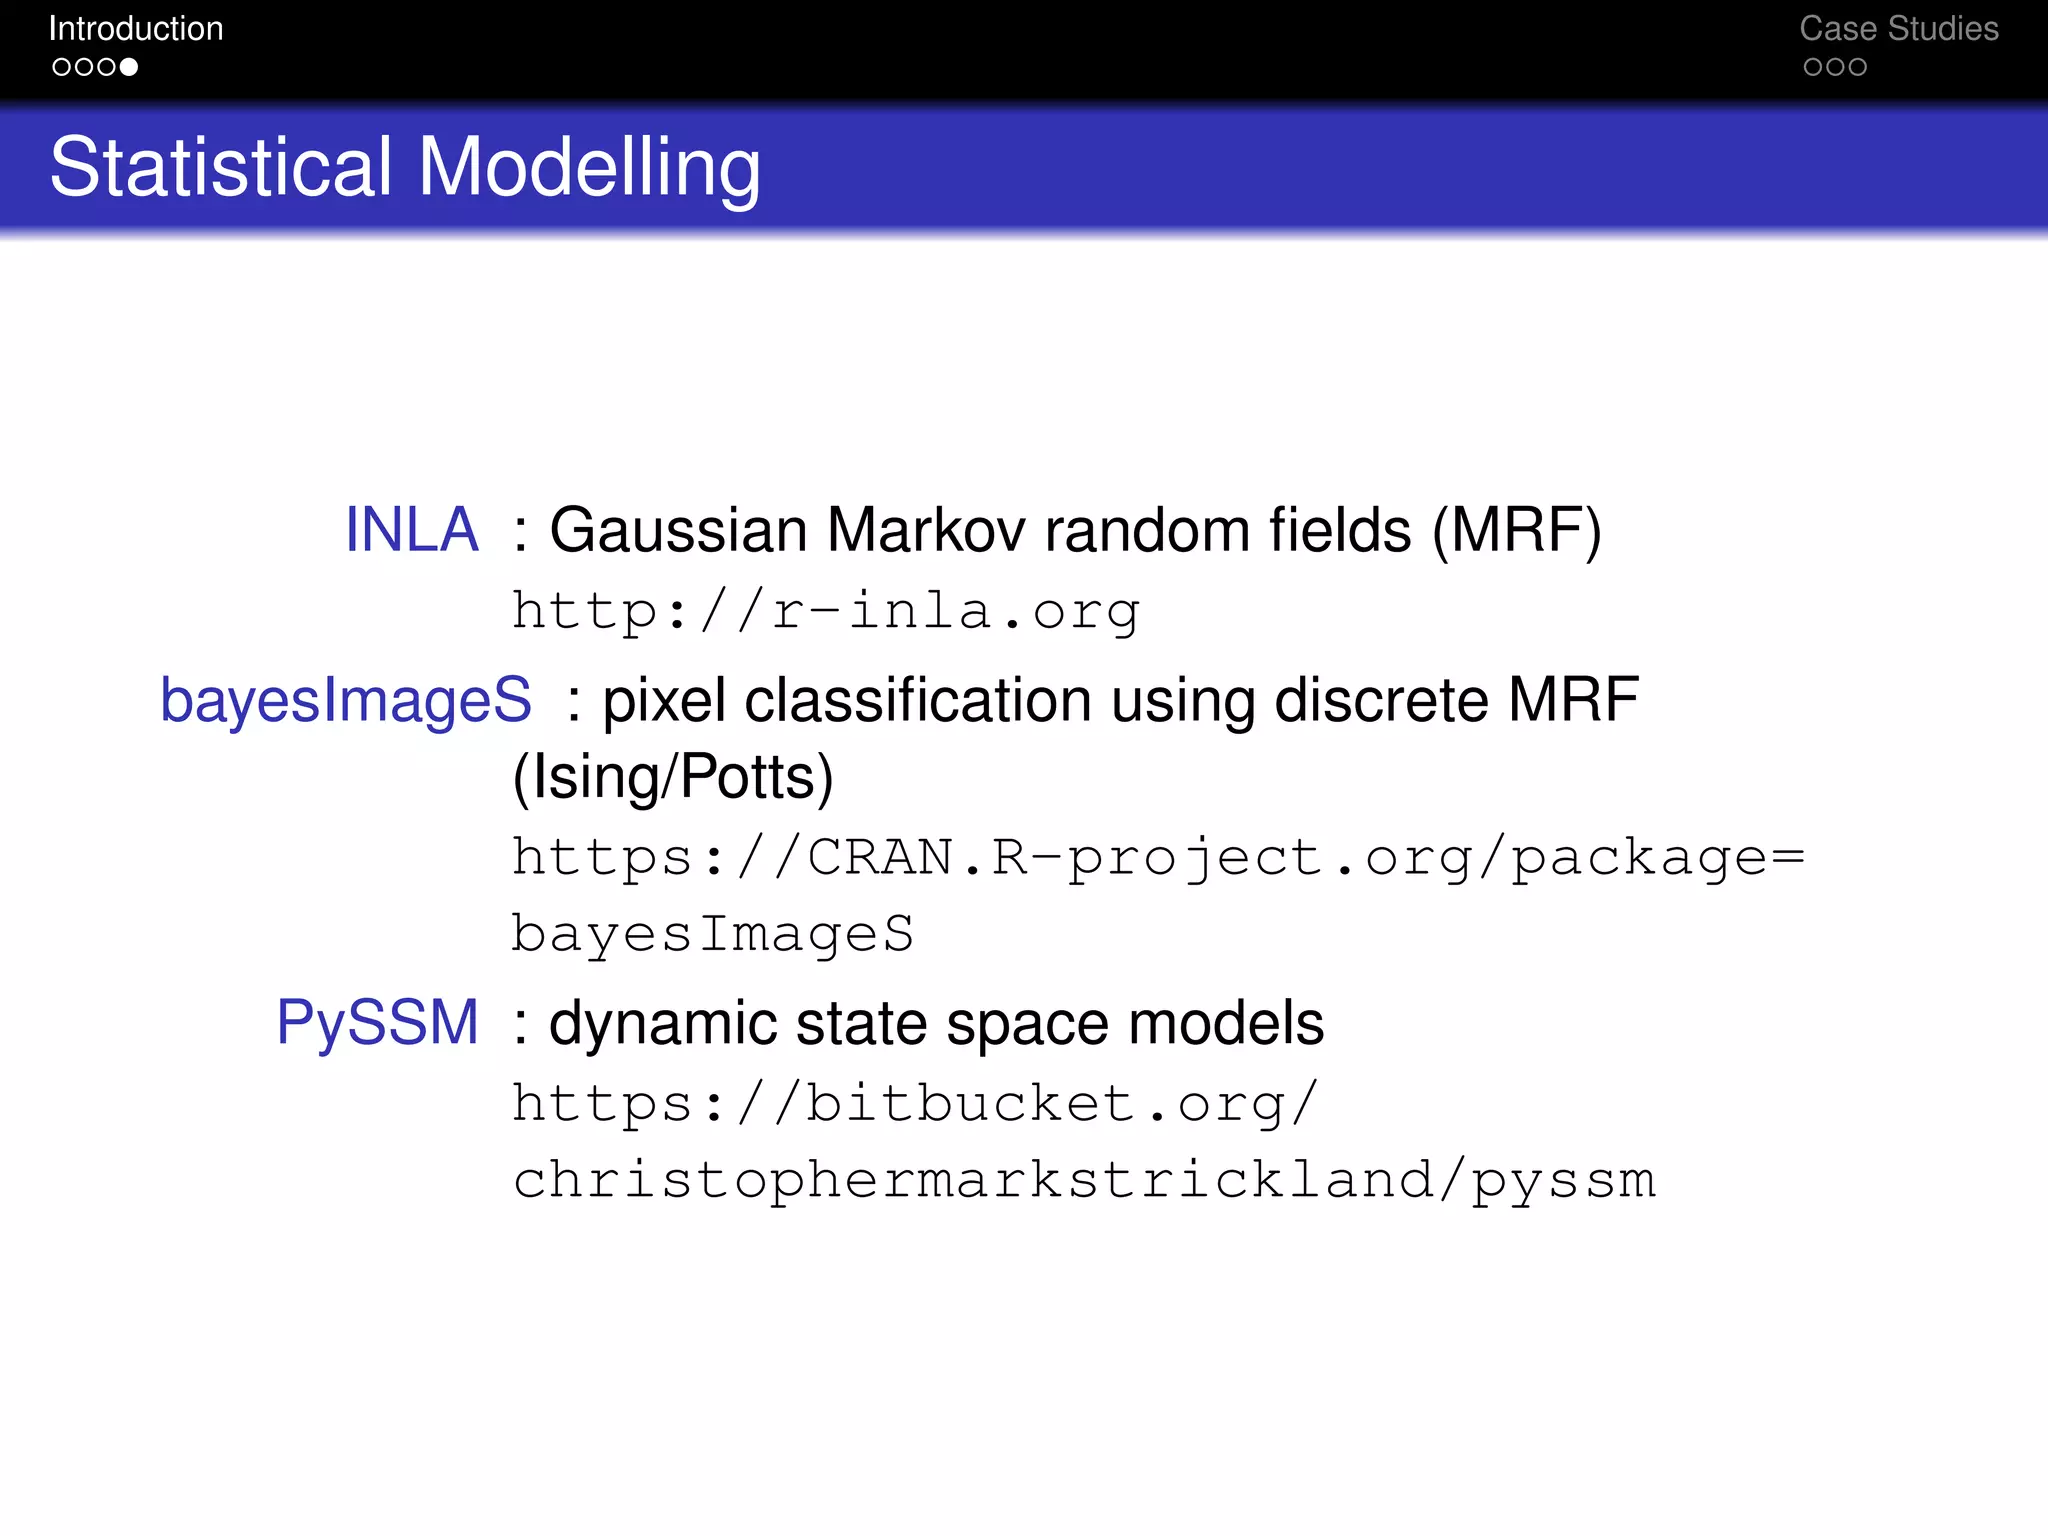
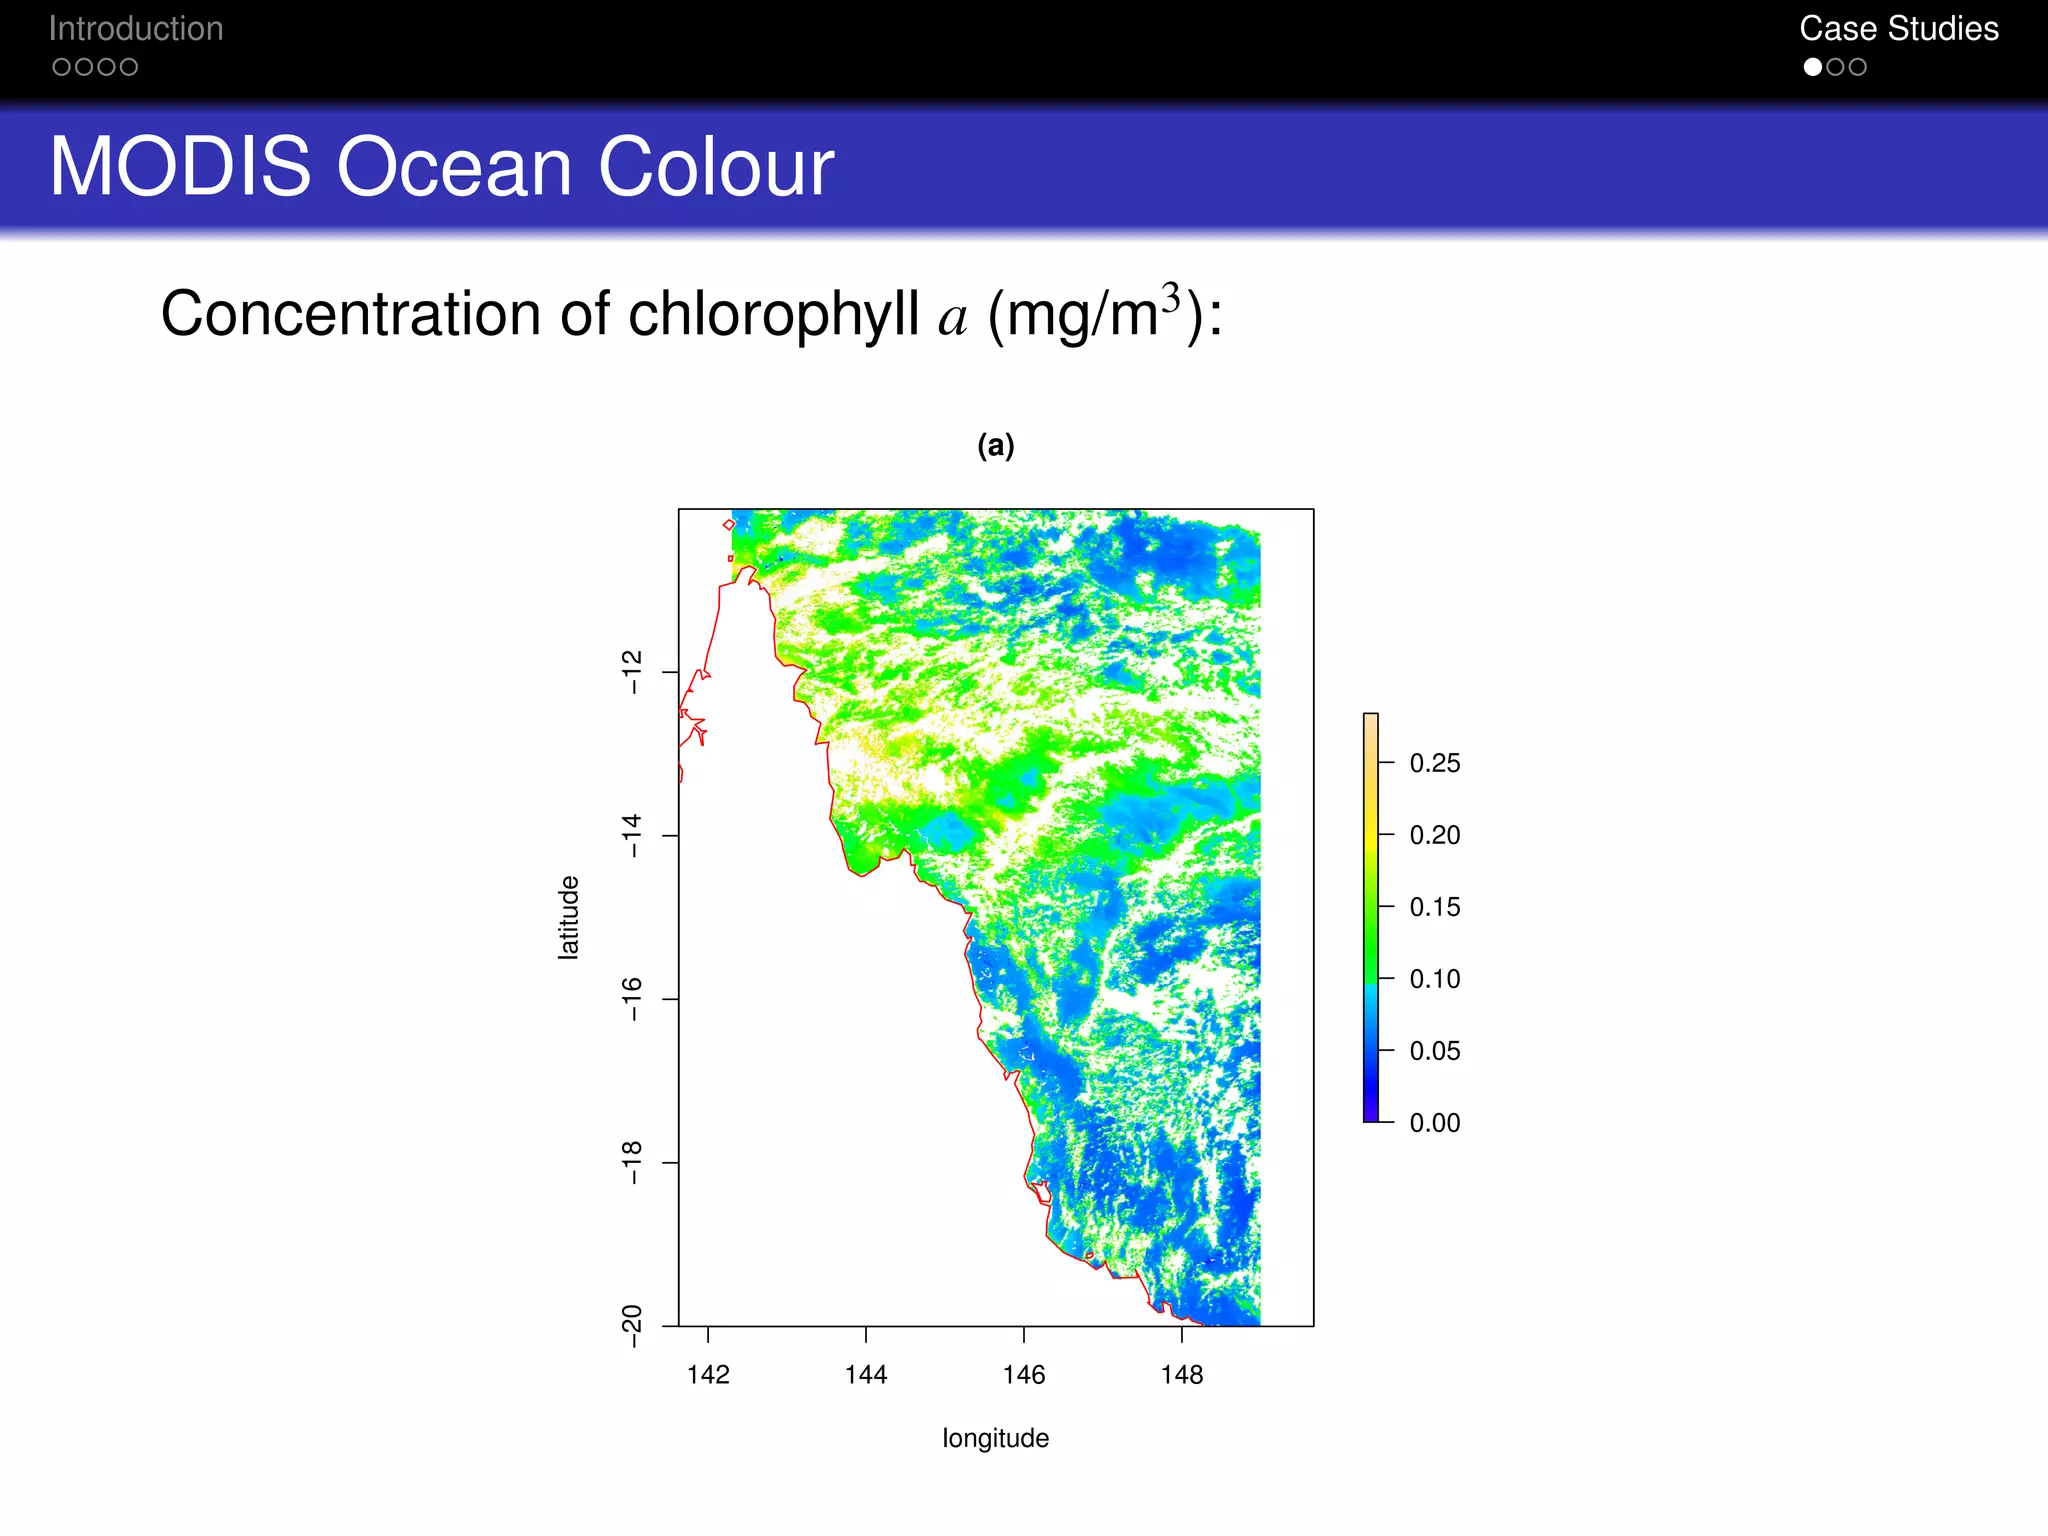
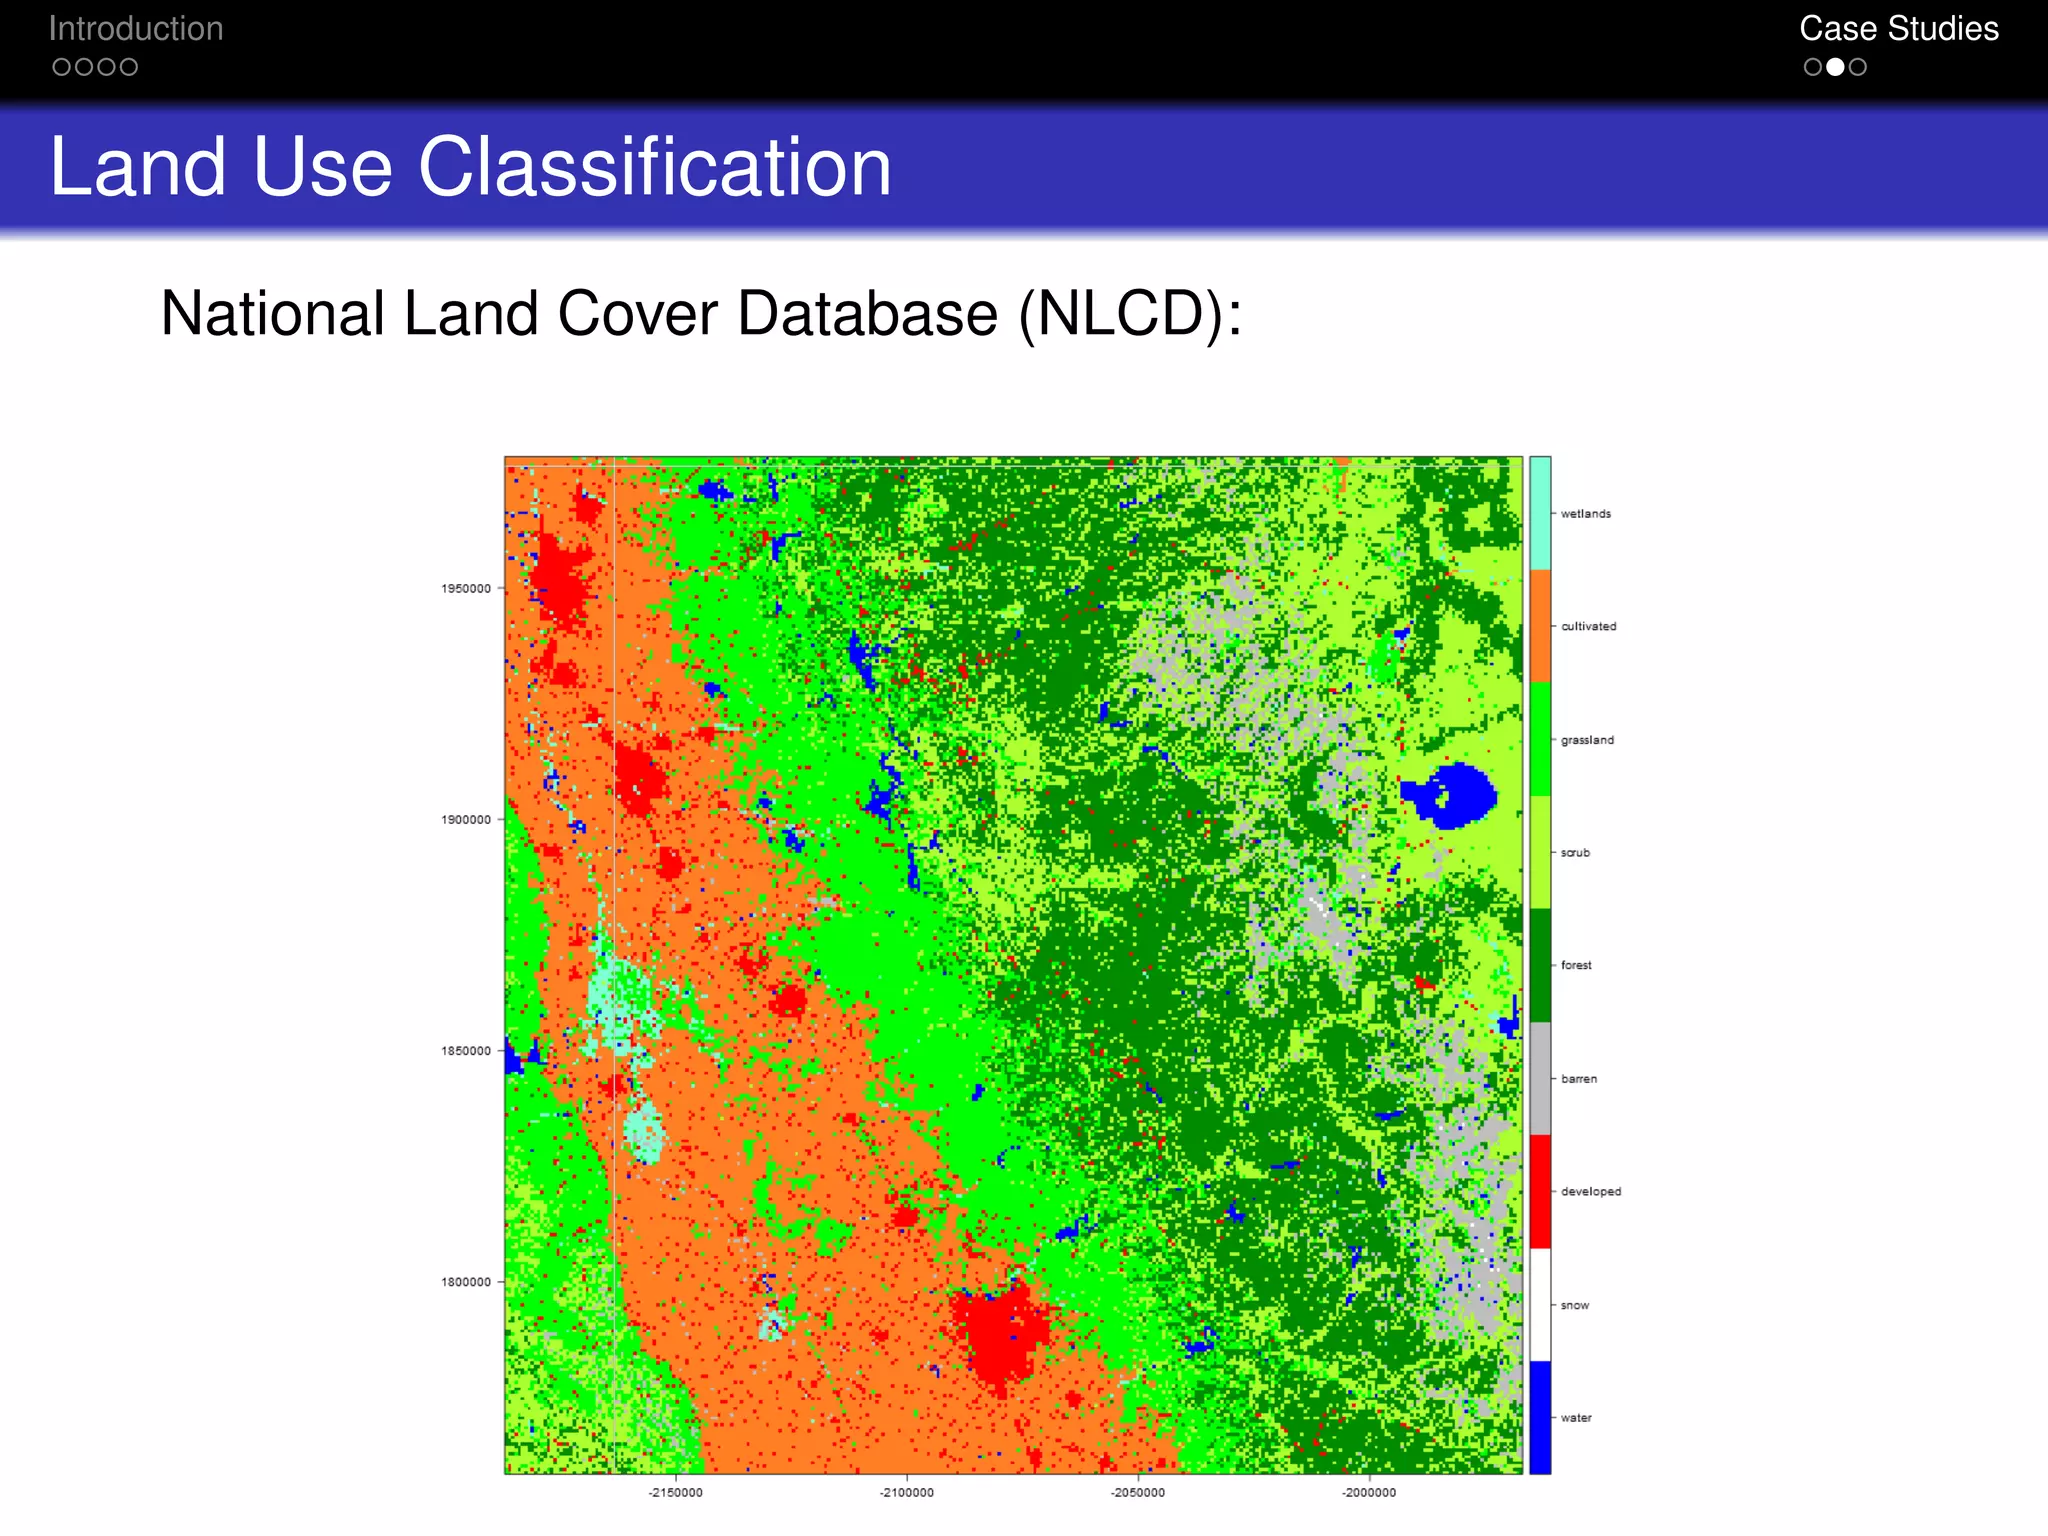
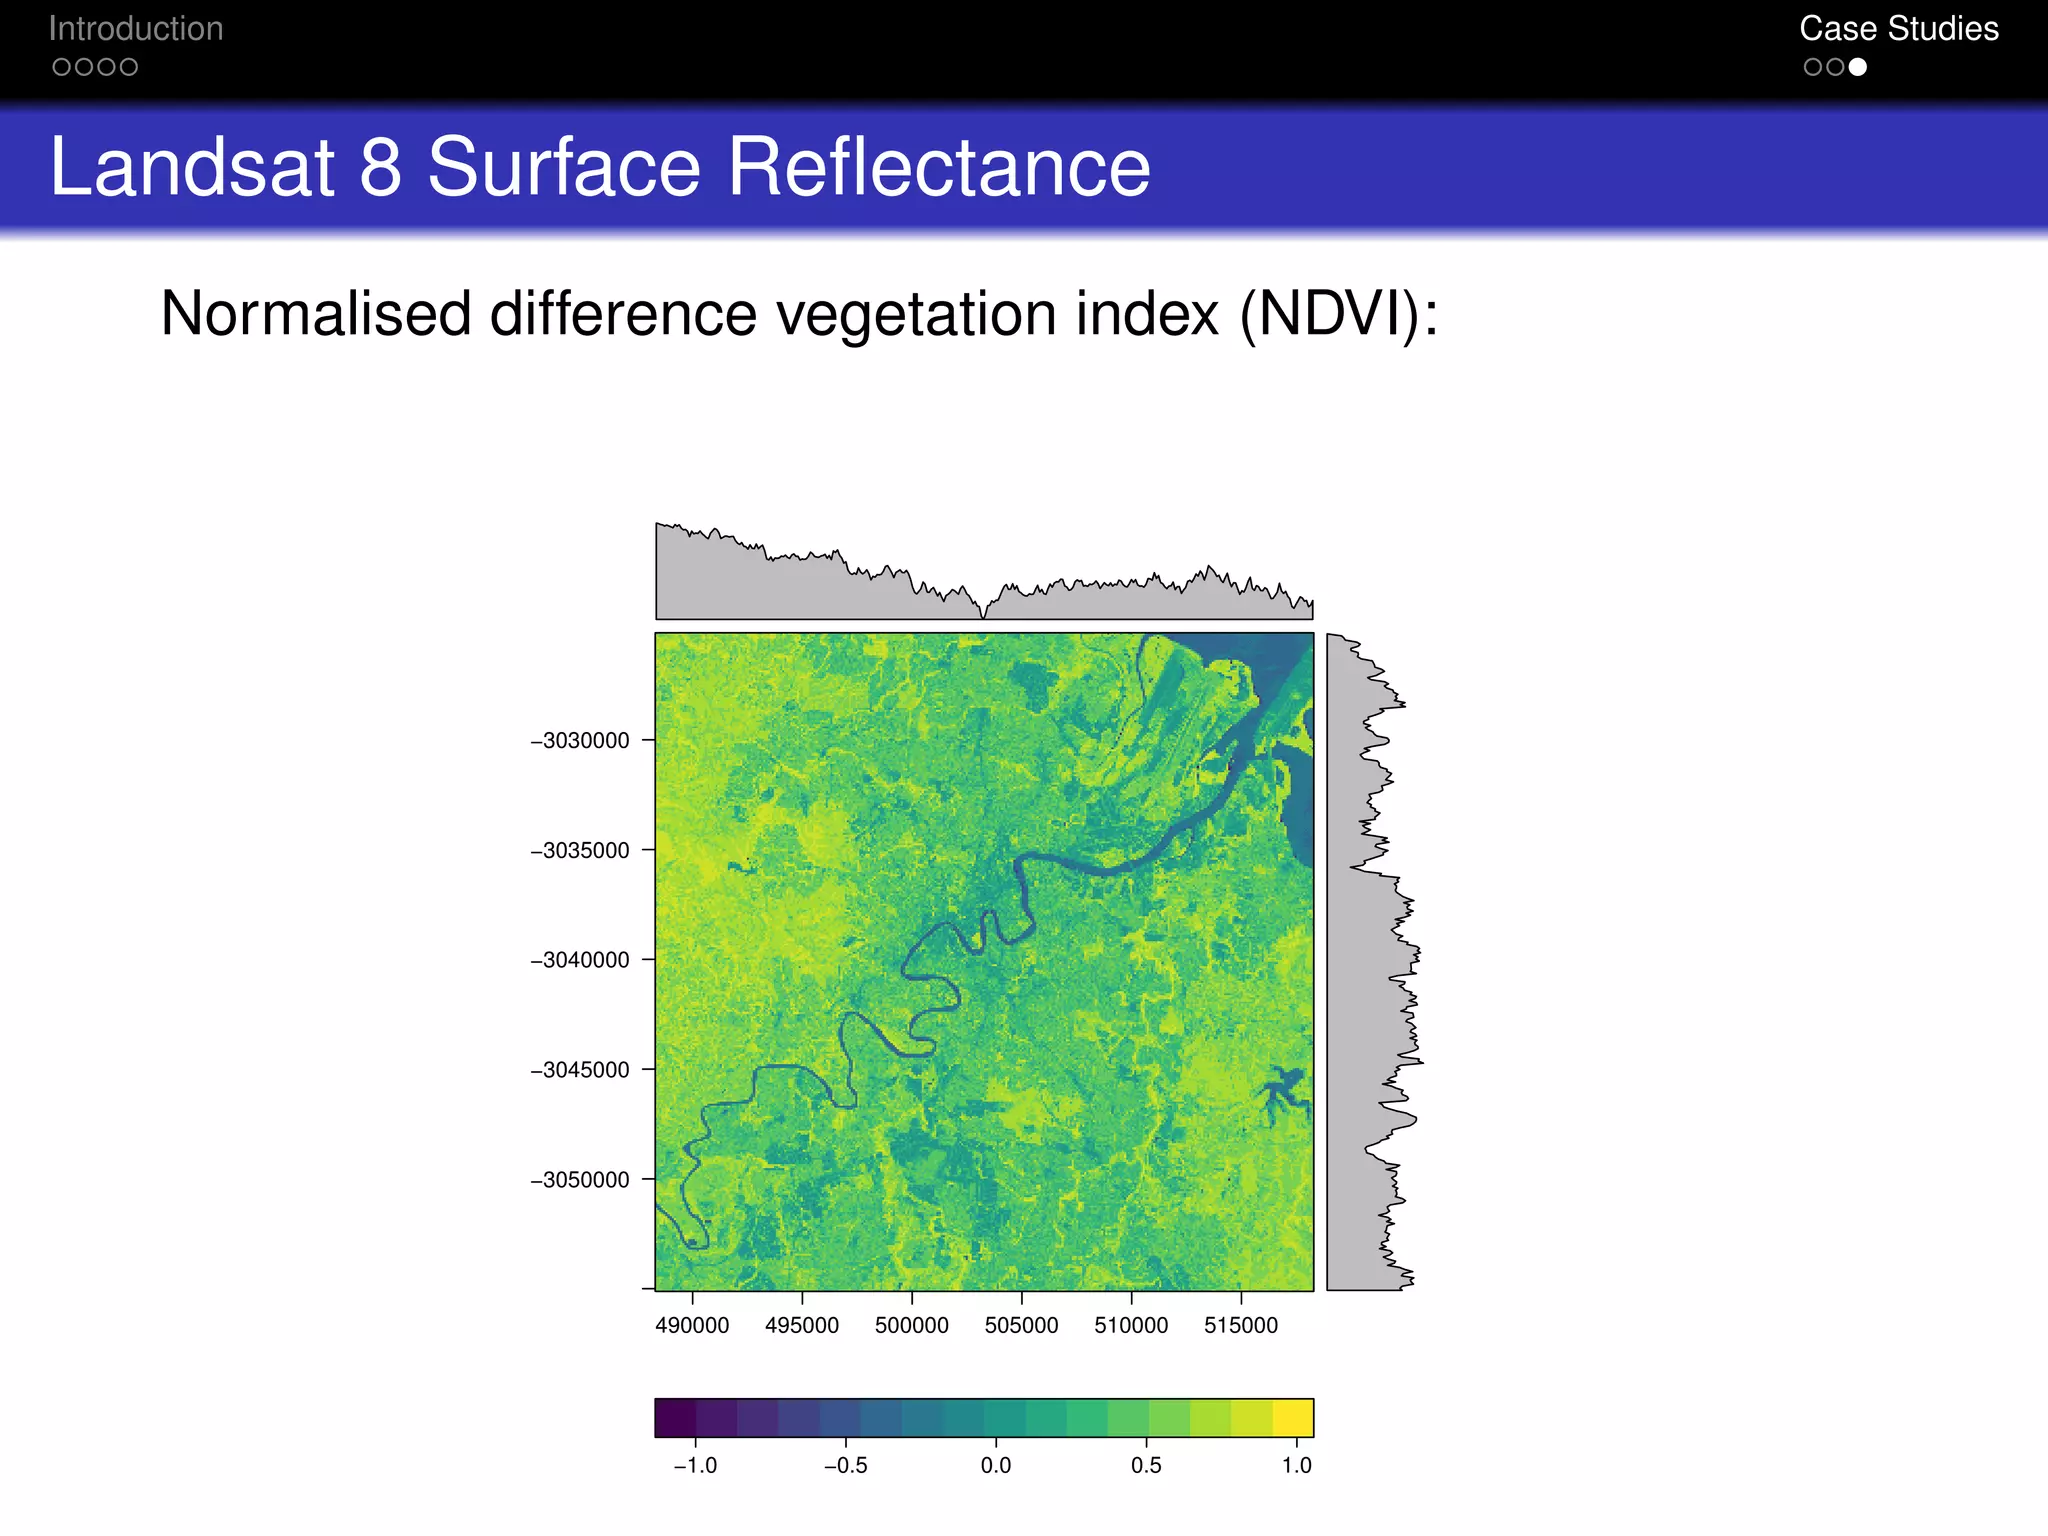
This document discusses the importation of satellite imagery into R from NASA and the U.S. Geological Survey, highlighting case studies on chlorophyll-a measurement, land use classification, and vegetation index from Landsat 8. It provides information on the tools and R packages applicable for remote sensing data analysis and references relevant literature related to Bayesian models and spatial analysis in environmental contexts. The document emphasizes the role of satellite remote sensing in various applications such as environmental monitoring and agricultural development.