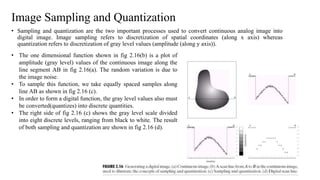
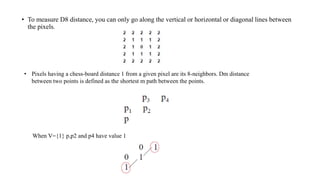
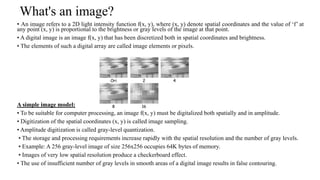
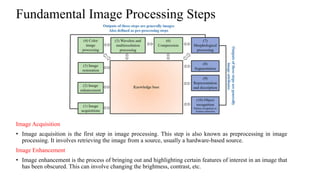
SlideShare a Scribd company logo
Introduction and Fundamentals
of Digital Image Processing
Origin
• Significance of Digital Image Processing:
• Digital Image Processing is an interdisciplinary field that involves manipulating and analyzing
digital images to extract useful information, enhance visual quality, and make informed
decisions.
• Its applications span a wide range of domains, including medical diagnosis, remote sensing,
entertainment, surveillance, and more.
• Evolution and Importance:
• The evolution from analog to digital image processing has revolutionized how we capture,
manipulate, and interpret visual information.
• Digital images are now integral to modern communication, scientific research, and artistic
expression.
What's an image?
• An image refers to a 2D light intensity function f(x, y), where (x, y) denote spatial coordinates and the value of ‘f’ at
any point (x, y) is proportional to the brightness or gray levels of the image at that point.
• A digital image is an image f(x, y) that has been discretized both in spatial coordinates and brightness.
• The elements of such a digital array are called image elements or pixels.
A simple image model:
• To be suitable for computer processing, an image f(x, y) must be digitalized both spatially and in amplitude.
• Digitization of the spatial coordinates (x, y) is called image sampling.
• Amplitude digitization is called gray-level quantization.
• The storage and processing requirements increase rapidly with the spatial resolution and the number of gray levels.
• Example: A 256 gray-level image of size 256x256 occupies 64K bytes of memory.
• Images of very low spatial resolution produce a checkerboard effect.
• The use of insufficient number of gray levels in smooth areas of a digital image results in false contouring.
Fundamental Image Processing Steps
Image Acquisition
• Image acquisition is the first step in image processing. This step is also known as preprocessing in image
processing. It involves retrieving the image from a source, usually a hardware-based source.
Image Enhancement
• Image enhancement is the process of bringing out and highlighting certain features of interest in an image that
has been obscured. This can involve changing the brightness, contrast, etc.
Fundamental Image Processing Steps
Image Restoration
• Image restoration is the process of improving the appearance of an image. However, unlike image
enhancement, image restoration is done using certain mathematical or probabilistic models.
Color Image Processing
• Color image processing includes a number of color modeling techniques in a digital domain. This
step has gained prominence due to the significant use of digital images over the internet.
Wavelets and Multiresolution Processing
• Wavelets are used to represent images in various degrees of resolution. The images are subdivided
into wavelets or smaller regions for data compression and for pyramidal representation.
Compression
• Compression is a process used to reduce the storage required to save an image or the bandwidth
required to transmit it. This is done particularly when the image is for use on the Internet.
Fundamental Image Processing Steps
Morphological Processing
• Morphological processing is a set of processing operations for morphing images based on their
shapes.
Segmentation
• Segmentation is one of the most difficult steps of image processing. It involves partitioning an
image into its constituent parts or objects.
Representation and Description
• After an image is segmented into regions in the segmentation process, each region is represented
and described in a form suitable for further computer processing. Representation deals with the
image’s characteristics and regional properties. Description deals with extracting quantitative
information that helps differentiate one class of objects from the other.
Recognition
• Recognition assigns a label to an object based on its description.
Components and applications of image processing
Image sensors
Image sensors detect the intensity, amplitude, coordinates, and other
characteristics of images and send the information to image processing
hardware. It contains the problem domain.
Image Processing Hardware
Image processing hardware is the specialized hardware that is utilized to
process the image sensor instructions. It sends the output to a general-purpose
computer.
Computer
The computer used in the image processing system is the same computer that
we use in our daily lives.
Image Processing Software
The software that contains all of the mechanisms and algorithms utilized in an
image processing system is known as image processing software.
Mass Storage
During image processing, the pixels are stored in mass storage.
Components and applications of image processing
Hard Copy Device
Once the image has been processed, it is saved to a hard copy device. It might be a pen drive or another type
of external ROM device.
Image Display
It includes the monitor or display screen on which the processed images are shown.
Network
The network connects all of the aforementioned aspects of the image processing system.
Visual Perception
• Visual perception is the process by which the human brain interprets and makes sense of visual
information received from the eyes. It involves the complex interaction between the eyes, the optic
nerves, and various regions of the brain responsible for processing visual stimuli. Visual perception
allows us to perceive the world around us, recognize objects, navigate our environment, and interact
with it effectively.
The basic elements of visual perceptions are:
• Structure of Eye
• Image Formation in the Eye
• Brightness Adaptation and Discrimination
Structure of Eye:
• The human eye is a slightly asymmetrical sphere with an average diameter of the length of 20mm to 25mm. It
has a volume of about 6.5cc. The eye is just like a camera. The external object is seen as the camera take the
picture of any object.
• Light enters the eye through a small hole called the pupil, a black looking aperture having the quality of
contraction of eye when exposed to bright light and is focused on the retina which is like a camera film.
• The lens, iris, and cornea are nourished by clear fluid, know as anterior chamber. The fluid flows from ciliary
body to the pupil and is absorbed through the channels in the angle of the anterior chamber.
• The delicate balance of aqueous production and absorption controls pressure within the eye.
• Cones in eye number between 6 to 7 million which are highly sensitive to colors. Human visualizes the
colored image in daylight due to these cones. The cone vision is also called as photopic or bright-light vision.
• Rods in the eye are much larger between 75 to 150 million and are distributed over the retinal surface. Rods
are not involved in the color vision and are sensitive to low levels of illumination.
Image Formation in the Eye:
When the lens of the eye focus an image of the outside world onto a light-sensitive membrane in the back of the eye,
called retina the image is formed. The lens of the eye focuses light on the photoreceptive cells of the retina which
detects the photons of light and responds by producing neural impulses. The distance between the lens and the retina
is about 17mm and the focal length is approximately 14mm to 17mm.
Brightness Adaptation and Discrimination:
Digital images are displayed as a discrete set of intensities. The eyes ability to discriminate black
and white at different intensity levels is an important consideration in presenting image processing
result. The range of light intensity levels to which the human visual system can adapt is of the
order of 1010 from the scotopic threshold to the glare limit. In a photopic vision, the range is about
106.
Image Sensing and Acquisition:
• Images can be generated by the combination of an illuminating source and reflection or absorption of
energy from that source by the elements of the scene being imaged.
• The illuminating source could be sun or any other source of electromagnetic energy such as radar, IR
rays or X-ray energy.
• Depending upon the nature of source, illumination energy is reflected from or transmitted through
object.
• This reflected or transmitted energy is focused onto a photo converter which converts the energy into
visible light.
Image Sensing and Acquisition:
• There are 3 principal sensor arrangements (produce an electrical output proportional to light intensity). (i)Single imaging
Sensor (ii)Line sensor (iii)Array sensor
Image Acquisition using a single sensor
The most common sensor of this type is the photodiode, which
is constructed of silicon materials and whose output voltage
waveform is proportional to light. The use of a filter in front of
a sensor improves selectivity. For example, a green (pass) filter
in front of a light sensor favours light in the green band of the
color spectrum. As a consequence, the sensor output will be
stronger for green light than for other components in the visible
spectrum.
Fig: Combining a single sensor with motion to generate a 2-D image
Contd.
• In order to generate a 2-D image using a single sensor, there have to be relative displacements in
both the x- and y-directions between the sensor and the area to be imaged. An arrangement used in
high precision scanning, where a film negative is mounted onto a drum whose mechanical rotation
provides displacement in one dimension.
• The single sensor is mounted on a lead screw that provides motion in the perpendicular direction.
Since mechanical motion can be controlled with high precision, this method is an inexpensive (but
slow) way to obtain high-resolution images.
Image Acquisition using Sensor Strips
Fig: (a) Image acquisition using linear sensor strip
(b) Image acquisition using circular sensor strip.
• The strip provides imaging elements in one direction. Motion
perpendicular to the strip provides imaging in the other direction. This is
the type of arrangement used in most flatbed scanners. Sensing devices
with 4000 or more in-line sensors are possible.
• In-line sensors are used routinely in airborne imaging applications, in
which the imaging system is mounted on an aircraft that flies at a constant
altitude and speed over the geographical area to be imaged.
• One-dimensional imaging sensor strips that respond to various bands of
the electromagnetic spectrum are mounted perpendicular to the direction
of flight. The imaging strip gives one line of an image at a time, and the
motion of the strip completes the other dimension of a two-dimensional
image.
• Sensor strips mounted in a ring configuration are used in medical and
industrial imaging to obtain cross-sectional (“slice”) images of 3-D
objects. A rotating X-ray source provides illumination and the portion of
the sensors opposite the source collect the X-ray energy that pass through
the object (the sensors obviously have to be sensitive to X-ray energy).
• This is the basis for medical and industrial computerized axial
tomography (CAT) imaging.
Image Acquisition using Sensor Arrays
Fig: An example of the digital image acquisition
process (a) energy source (b) An element of a scene
(d) Projection of the scene into the image (e) digitized
image
• This type of arrangement is found in digital cameras. A typical sensor for these cameras is a CCD array, which can be
manufactured with a broad range of sensing properties and can be packaged in rugged arrays of 4000 * 4000 elements or
more.
• CCD sensors are used widely in digital cameras and other light sensing instruments. The response of each sensor is
proportional to the integral of the light energy projected onto the surface of the sensor, a property that is used in
astronomical and other applications requiring low noise images.
• The first function performed by the imaging system is to collect the incoming energy and focus it onto an image plane. If
the illumination is light, the front end of the imaging system is a lens, which projects the viewed scene onto the lens focal
plane.
• The sensor array, which is coincident with the focal plane, produces outputs proportional to the integral of the light
received at each sensor.
A Simple Image Formation Model
• An image is defined by two dimensional function f(x,y). The value or amplitude of f at spatial
coordinates (x,y) is a positive scalar quantity. When an image is generated from a physical process,
its value are proportional to energy radiated by physical source.
• As a consequence, f(x,y) must be nonzero and finite; that is, The function f(x,y) may be
characterized by two components: (1) the amount of source illumination incident on the scene
being viewed and (2) the amount of illumination reflected by the objects in the scene.
• These are called illumination and reflectance components denoted by i(x,y) and r(x,y) respectively.
The two function combine as product to form f(x,y): f(x,y)=i(x,y) r(x,y)
• Where 0 < i(x,y)< ∞ and 0 <r(x,y)< 1 r(x,y)=0 means total absorption r(x,y)=1 means total
reflectance.
• We call the intensity of a monochrome image at any coordinates (x,y) the gray level (l) of the
image at that point. That is l=f(x,y). The interval of l ranges from [0,L-1]. Where l=0 indicates
black and l=1 indicates white. All the intermediate values are shades of gray varying from black to
white.
Image Sampling and Quantization
• Sampling and quantization are the two important processes used to convert continuous analog image into
digital image. Image sampling refers to discretization of spatial coordinates (along x axis) whereas
quantization refers to discretization of gray level values (amplitude (along y axis)).
• The one dimensional function shown in fig 2.16(b) is a plot of
amplitude (gray level) values of the continuous image along the
line segment AB in fig 2.16(a). The random variation is due to
the image noise.
• To sample this function, we take equally spaced samples along
line AB as shown in fig 2.16 (c).
• In order to form a digital function, the gray level values also must
be converted(quantizes) into discrete quantities.
• The right side of fig 2.16 (c) shows the gray level scale divided
into eight discrete levels, ranging from black to white. The result
of both sampling and quantization are shown in fig 2.16 (d).
Representing Digital Image
• Representing Digital Image An image may be defined as a two-dimensional function, f(x, y),
where x and y are spatial (plane) coordinates, and the amplitude of „f ‟ at any pair of coordinates
(x, y) is called the intensity or gray level of the image at that point.
Fig: Zoomed image, where small white boxes inside the image
represent pixels
Fig: Coordinate convention used to
represent digital images
Contd.
• Digital image is composed of a finite number of elements referred to as picture elements, image
elements, pels, and pixels. Pixel is the term most widely used to denote the elements of a digital
image. We can represent M*N digital image as compact matrix as shown in fig below
When x, y, and the amplitude values of f are all finite, discrete quantities, we call the image a digital image. The
field of digital image processing refers to processing digital images by means of a digital computer.
• If k is the number of bits per pixel, then the number of gray levels, L, is an integer power of 2.
• When an image can have k 2 gray levels, it is common practice to refer to the image as a “k-bit
image”. For example, an image with 256 possible grey level values is called an 8 bit image.
• Therefore the number of bits required to store a digitalized image of size M*N is
• When M=N then
• Spatial resolution is the smallest discernable (detect with difficulty )change in an image. Graylevel
resolution is the smallest discernable (detect with difficulty) change in gray level.
• Image resolution quantifies how much close two lines (say one dark and one light) can be to each
other and still be visibly resolved. The resolution can be specified as number of lines per unit
distance, say 10 lines per mm or 5 line pairs per mm. Another measure of image resolution is dots
per inch, i.e. the number of discernible dots per inch.
Spatial and Gray-Level Resolution
Fig: A 1024 x 2014, 8 bit image subsampled down to size 32 x 32 pixels. The number
of allowable kept at 256.
• Image of size 1024*1024 pixels whose gray levels are represented by 8 bits is as shown in fig
above. The results of subsampling the 1024*1024 image. The subsampling was accomplished by
deleting the appropriate number of rows and columns from the original image.
• For example, the 512*512 image was obtained by deleting every other row and column from the
1024*1024 image. The 256*256 image was generated by deleting every other row and column in
the 512*512 image, and so on.
• The number of allowed gray levels was kept at 256. These images show dimensional proportions
between various sampling densities, but their size differences make it difficult to see the effects
resulting from a reduction in the number of samples.
• The simplest way to compare these effects is to bring all the subsampled images up to size 1024 x
1024.
Fig: (a) 1024 x 1024, 8 bit image (b) 512 x 512 image resampled into 1024 x
1024 pixels by row and column duplication. (c) through (f) 256 x 256, 128 x
128, 64 x 64, and 32 x 32 images resampled into 1024 x 1024 pixels.
Gray-Level Resolution
Fig: 452 x 374, 256 level image. (b)- (d) Image displayed in 128, 64, 32,16,8,4 and 2 grey level, while keeping spatial resolution
constant.
• In this example, we keep the number of samples constant and reduce the number of grey levels from 256 to 2.
Some Basic Relationship between Pixels
Neighbors of a Pixel
In a 2-D coordinate system each pixel p in an image can be identified by a pair of spatial coordinates (x, y).
Referring to the Fig below, a pixel p has two horizontal neighbors (x−1, y), (x+1, y) and two vertical
neighbors (x, y−1), (x, y+1). These 4 pixels together constitute the 4-neighbors of pixel p, denoted as N4(p).
The pixel p also has 4 diagonal neighbors which are: (x+1, y+1), (x+1, y−1), (x−1, y+ 1), (x−1, y−1). The set
of 4 diagonal neighbors forms the diagonal neighborhood denoted as ND(p). The set of 8 pixels surrounding
the pixel p forms the 8-neighborhood denoted as N8(p). We have N8(p) = N4(p) ∪ ND(p).
Figure : Pixel Neighborhood: The center pixel p is shown in a dashed pattern and the pixels in
the defined neighborhood are shown in filled color.
Adjacency, Connectivity, Regions, AND Boundaries
Adjacency
• The concept of adjacency has a slightly different meaning from neighborhood. Adjacency takes
into account not just spatial neighborhood but also intensity groups.
• Suppose we define a set S={0,L-1} of intensities which are considered to belong to the same
group. Two pixels p and q will be termed adjacent if both of them have intensities from set S and
both also conform to some definition of neighborhood.
• 4 Adjacency: Two pixels p and q are termed as 4-adjacent if they have intensities from set S and q
belongs to N4(p).
• 8 Adjacency Two pixels p and q are termed as 4-adjacent if they have intensities from set S and q
belongs to N8(p).
• Mixed adjacency or m-adjacency : (there shouldn’t be closed path) Two pixels with intensity
values from set S are m-adjacent if
• Mixed adjacency is a modification of 8-adjacency and is used to
eliminate the multiple path connections that often arise when 8-
adjacency is used.
Fig: (a) Arrangement of pixels; (b) pixels that are 8-adjacent to the center pixel
(c) madjacency
Path
Path
• A (digital) path (or curve) from pixel p with coordinates (x0,y0) to pixel q with coordinates (xn,
yn) is a sequence of distinct pixels with coordinates (x0, y0), (x1, y1), …, (xn, yn)
• Where (xi yi) and (xi-1, yi-1) are adjacent for 1 ≤ i ≤ n. • Here n is the length of the path. • If (x0,
y0) = (xn, yn), the path is closed path. • We can define 4-, 8-, and m-paths based on the type of
adjacency used.
Connected components
• Let S represent a subset of pixels in an image. Two pixels p and q are said to be connected in S if
there exists a path between them consisting entirely of pixels in S. For any pixel p in S, the set of
pixels connected to it in S is called a connected component of S. If it has only one connected
component, then set S is called connected set.
• A Region R is a subset of pixels in an image such that all pixels in R form a connected component.
• A Boundary of a region R is the set of pixels in the region that have one or more neighbors that are
not in R. If R happens to be an entire image, then its boundary is defined as the set of pixels in the
first and last rows and columns of the image.
• Distance Measure For pixels p,q and z, with coordinates (x,y),(s,t) and (v,w), repectively, D is a
distance function if
• The distance between two pixels p and q with coordinates (x1, y1), (x2, y2) respectively can be
formulated in several ways:
Pixels having a Euclidean distance r from a given pixel will lie on a circle of radius r centered at it and r =
distance
In this case, the pixels having a D4 distance from (x,y) less than or equal to some value r from a diamond
centered at (x,y). For example, the pixels with D4 distance ≤2 from (x,y) (the center point) form the
following contours of constant distance:
• Pixels having a city-block distance 1 from a given pixel are its 4-neighbors.
• Green line is Euclidean distance. Red, blue and yellow are City Block Distance. It's called city-block
distance, because it is calculated as if on each pixel between your two coordinates stood a block (house)
which you have to go around. That means, you can only go along the vertical or horizontal lines between the
pixels but not diagonal. It's the same like the movement of the rook on a chess field.
• In this case, the pixels having a D8 distance from (x,y) less than or equal to some value r from a square
centered at (x,y). For example, the pixels with D8 distance ≤2 from (x,y) (the center point) form the
following contours of constant distance.
• To measure D8 distance, you can only go along the vertical or horizontal or diagonal lines between
the pixels.
• Pixels having a chess-board distance 1 from a given pixel are its 8-neighbors. Dm distance
between two points is defined as the shortest m path between the points.
When V={1} p,p2 and p4 have value 1
• Dm shortest distance between p and p4 is 2 When V={1} p,p1,p2 and p4 have value 1 or p,p2,p3
and p4 have value 1
Dm shortest distance between p and p4 is 3
Image Formats
• Image Format describes how data related to the image will be stored. Data can be stored in compressed, Uncompressed, or
vector format. Each format of the image has a different advantage and disadvantage. Image types such as TIFF are good for
printing while JPG or PNG, are best for the web.
• TIFF(.tif, .tiff) Tagged Image File Format this format store image data without losing any data. It does not perform any
compression on images, and a high-quality image is obtained but the size of the image is also large, which is good for
printing, and professional printing.
• JPEG (.jpg, .jpeg) Joint Photographic Experts Group is a loss-prone (lossy) format in which data is lost to reduce the size
of the image. Due to compression, some data is lost but that loss is very less. It is a very common format and is good for
digital cameras, nonprofessional prints, E-Mail, Powerpoint, etc., making it ideal for web use.
• GIF (.gif) GIF or Graphics Interchange Format files are used for web graphics. They can be animated and are limited to
only 256 colors, which can allow for transparency. GIF files are typically small in size and are portable.
• PNG (.png) PNG or Portable Network Graphics files are a lossless image format. It was designed to replace gif format as
gif supported 256 colors unlike PNG which support 16 million colors.
• Bitmap (.bmp) Bit Map Image file is developed by Microsoft for windows. It is same as TIFF due to lossless, no
compression property. Due to BMP being a proprietary format, it is generally recommended to use TIFF files.
• EPS (.eps) Encapsulated PostScript file is a common vector file type. EPS files can be opened in applications such as
Adobe Illustrator or CorelDRAW.
• RAW Image Files (.raw, .cr2, .nef, .orf, .sr2) These Files are unprocessed and created by a camera or scanner. Many
digital SLR cameras can shoot in RAW, whether it be a .raw, .cr2, or .nef. These images are the equivalent of a digital
negative, meaning that they hold a lot of image information. These images need to be processed in an editor such as Adobe
Photoshop or Lightroom. It saves metadata and is used for photography.
Raster file formats
What is a raster image ?
• Raster images are made up of a set grid of dots called pixels where each pixel is assigned a color.
Unlike a vector image, raster images are resolution dependent, meaning they exist at one size.
When you transform a raster image, you stretch the pixels themselves, which can result in a
“pixelated” or blurry image. When you enlarge an image, your software is essentially guessing at
what image data is missing based on the surrounding pixels. More often than not, the results aren’t
great.
• Raster images are typically used for photographs, digital artwork and web graphics (such as banner
ads, social media content and email graphics). Adobe Photoshop is the industry-standard image
editor that is used to create, design and edit raster images as well as to add effects, shadows and
textures to existing designs.
CMYK vs. RGB
• All raster images can be saved in one of two primary color models: CMYK and RGB. CMYK a
four-color printing process that stands for cyan, magenta, yellow and key (black). These colors
represent the four inks that will combine during the printing process. Files saved in this format will
be optimized for physical printing. RGB is a light-based color model that stands for red, green
and blue. These are the three primary colors of light that combine to produce other colors. Files
saved in this format will be optimized for the web, mobile phones, film and video—anything that
appears on a screen.
Lossy vs. lossless
• Each raster image file is either lossless or lossy, depending on how the format handles
your image data.
• Lossless image formats capture all of the data of your original file. Nothing from the
original file, photo, or piece of art is lost—hence the term “lossless.” The file may still be
compressed, but all lossless formats will be able to reconstruct your image to its original
state.
• Lossy image formats approximate what your original image looks like. For example, a
lossy image might reduce the amount of colors in your image or analyze the image for
any unnecessary data. These clever technical tricks will typically reduce the file size,
though they may reduce the quality of your image.
• Typically, lossy files are much smaller than lossless files, making them ideal to use online
where file size and download speed are vital
JPEG/JPG
• JPEG is a lossy raster format that stands for Joint Photographic Experts Group, the technical team
that developed it. This is one of the most widely used formats online, typically for photos, email
graphics and large web images like banner ads. JPEG images have a sliding scale of compression
that decreases file size tremendously, but increases artifacts or pixelation the more the image is
compressed.
You should use a JPEG when…
• You’re dealing with online photos and/or artwork. JPEGs offer you the most flexibility with
raster editing and compression making them ideal for web images that need to be downloaded
quickly.
• You want to print photos and/or artwork. At high resolution files with low compression, JPEGs
are perfect for editing and then printing.
• You need to send a quick preview image to a client. JPEG images can be reduced to very small
sizes making them great for emailing.
Don’t use a JPEG when…
• You need a web graphic with transparency. JPEGs do not have a transparency channel and must
have a solid color background. GIF and PNG are your best options for transparency.
• You need a layered, editable image. JPEGs are a flat image format meaning that all edits are saved
into one image layer and cannot be undone. Consider a PSD (Photoshop) file for a fully editable
image.
GIF
• GIF is a lossless raster format that stands for Graphics Interchange Format. The big question: how
is it pronounced?
• The creator of GIF says “JIFF” like the peanut butter. This writer (and lots of the world) says
“GIFF” because graphics starts with a “guh.”
• GIF is also a widely used web image format, typically for animated graphics like banner ads, email
images and social media memes. Though GIFs are lossless, they can be exported in a number of
highly customizable settings that reduce the amount of colors and image information, which in turn
reduces the file size.
You should use a GIF when…
• You want to create web animation. GIF images hold all of the animation frames and
timing information in one single file. Image editors like Photoshop make it easy to create
a short animation and export it as a GIF.
• You need transparency. GIF images have an “alpha channel” that can be transparent, so
you can place your image on any colored background.
• You need a small file. The compression techniques in the GIF format allow image files to
shrink tremendously. For very simple icons and web graphics, GIF is the best image file
format.
Don’t use a GIF when…
• You need a photographic-quality image. Though GIFs can be high resolution, they have a
limit of 256 colors (unless you know a few tricks). Photos typically have thousands of
colors and will look flat and less vibrant (and sometimes weird due to color banding)
when converted to GIF.
• You need to print an image. Because of the color limit, most printed photos will lack
depth. If you need to print photos, look at TIFF, PSD and JPG.
• You need a layered, editable image. GIFs are a flat image format meaning that all edits
are saved into one image layer and cannot be undone. Consider a PSD (Photoshop) file
for a fully editable image.
PNG
• PNG is a lossless raster format that stands for Portable Network Graphics. Think of PNGs as the
next-generation GIF. This format has built-in transparency, but can also display higher color
depths, which translates into millions of colors. PNGs are a web standard and are quickly
becoming one of the most common image formats used online.
• You should use a PNG when…
• You need high-quality transparent web graphics. PNG images have a variable “alpha channel”
that can have any degree of transparency (in contrast with GIFs that only have on/off
transparency). Plus, with greater color depths, you’ll have a more vibrant image than you would
with a GIF.
• You have illustrations with limited colors. Though any image will work, PNG files are best with a
small color palette.
• You need a small file. PNG files can shrink to incredibly tiny sizes—especially images that are
simple colors, shapes or text. This makes it the ideal image file type for web graphics.
• Don’t use a PNG when…
• You’re working with photos or artwork. Thanks to PNGs’ high color depth, the format can
easily handle high resolution photos. However, because it is a lossless web format, file
sizes tend to get very large. If you’re working with photos on the web, go with JPEG.
• You’re dealing with a print project. PNG graphics are optimized for the screen. You can
definitely print a PNG, but you’d be better off with a JPEG (lossy) or TIFF file.
TIFF/TIF
• TIFF is a lossless raster format that stands for Tagged Image File Format. Because of its extremely
high quality, the format is primarily used in photography and desktop publishing. You’ll likely
encounter TIFF files when you scan a document or take a photo with a professional digital camera.
Do note that TIFF files can also be used as a “container” for JPEG images. These files will be
much smaller than traditional TIFF files, which are typically very large.
• You should use a TIFF when…
• You need high-quality print graphics. Along with RAW, TIFF files are among
the highest quality graphic formats available. If you’re printing photos—especially
at enormous sizes—use this format.
• You are making a high-quality scan. Using TIFF to scan your documents, photos
and artwork will ensure that you have the best original file to work off of.
• Don’t use at TIFF when…
• You’re working with web graphics. While many web browsers support it, TIFF
files are optimized for print. Go with JPEG or PNG when you need to display
high-quality images online.
Vector file formats
What is a vector image ?
• Vector images are digital artwork in which points, lines and curves are calculated by the computer.
• They essentially giant math equations, and every “equation” can be assigned a color, stroke or
thickness (among other styles) to turn the shapes into art.
• Unlike raster images, vector images are resolution independent. When you shrink or enlarge a
vector image, your shapes get larger, but you won’t lose any detail or get any pixelation.
• Because your image will always render identically, no matter the size, there is no such thing as a
lossy or lossless vector image type.
• Vector images are typically used for logos, icons, typesetting and digital illustrations. Adobe
Illustrator is the industry-standard image editor that is used to create, design and edit vector images
(though it can also incorporate raster images, as well).
PDF
• PDF stands for Portable Document Format and is an image format used to display documents and graphics
correctly, no matter the device, application, operating system or web browser. At its core, PDF files have a
powerful vector graphics foundation, but can also display everything from raster graphics to form fields to
spreadsheets.
• Because it is a near universal standard, PDF files are often the file format requested by printers to send a
final design into production. Both Adobe Photoshop and Illustrator can export straight to PDF, making it
easy to start your design and get it ready for printing.
• You should use a PDF when…
• You’re ready to print. As we mentioned, many printers prefer PDF as their primary delivery format because
it is so ubiquitous. Check with your printer to see how they’d like you to prepare your file.
• You want to display documents on the web. You wouldn’t use a PDF for a single icon or logo, but it’s great
for posters, flyers, magazines and booklets. PDFs will keep your entire design in one package, making it
easy to view, download or print.
• Don’t use a PDF when…
• You need to edit your design. PDFs are great containers, but use other applications for the contents. You can
edit raster images with Photoshop and vector graphics with Illustrator. When you’re done, you can combine
those into a PDF for easy viewing.

More Related Content

Similar to Image processing.pptx

Digital image processing2.pptx
Digital image processing2.pptxDigital image processing2.pptx
Digital image processing2.pptx
DivyanshAgarwal78
 
introdaction.pptx
introdaction.pptxintrodaction.pptx
introdaction.pptx
Dekebatufa
 
An Introduction to digital image processing
An Introduction to digital image processingAn Introduction to digital image processing
An Introduction to digital image processing
nastaranEmamjomeh1
 
1-introduction-image-processing_Chapter1-Digital_Image_Processing.pptx
1-introduction-image-processing_Chapter1-Digital_Image_Processing.pptx1-introduction-image-processing_Chapter1-Digital_Image_Processing.pptx
1-introduction-image-processing_Chapter1-Digital_Image_Processing.pptx
JayabharathiMuraliku
 
Rendering Algorithms.pptx
Rendering Algorithms.pptxRendering Algorithms.pptx
Rendering Algorithms.pptx
SherinRappai
 
digital image processing cresent ppt slides
digital image processing  cresent ppt slidesdigital image processing  cresent ppt slides
digital image processing cresent ppt slides
ssuserf35ac9
 
DIGITAL IMAGE FUNDAS.ppt
DIGITAL IMAGE FUNDAS.pptDIGITAL IMAGE FUNDAS.ppt
DIGITAL IMAGE FUNDAS.ppt
Hari M
 
Sub ecs 702_30sep14
Sub ecs 702_30sep14Sub ecs 702_30sep14
Sub ecs 702_30sep14
shubham singh
 
digitalimagefundamentals.ppt
digitalimagefundamentals.pptdigitalimagefundamentals.ppt
digitalimagefundamentals.ppt
University of Sindh
 
Biometric simulator for visually impaired (1)
Biometric simulator for visually impaired (1)Biometric simulator for visually impaired (1)
Biometric simulator for visually impaired (1)
Rahul Bhagat
 
digital imaging ppt.ppt
digital imaging ppt.pptdigital imaging ppt.ppt
digital imaging ppt.ppt
vishalmehrotra10
 
Dip lect2-Machine Vision Fundamentals
Dip  lect2-Machine Vision Fundamentals Dip  lect2-Machine Vision Fundamentals
Dip lect2-Machine Vision Fundamentals
Abdul Abbasi
 
image Processing Fundamental Is .ppt
image Processing Fundamental Is     .pptimage Processing Fundamental Is     .ppt
image Processing Fundamental Is .ppt
Desalechali1
 
Image Processing Fundamentals .ppt
Image Processing Fundamentals        .pptImage Processing Fundamentals        .ppt
Image Processing Fundamentals .ppt
Desalechali1
 
Biomedical image processing ppt
Biomedical image processing pptBiomedical image processing ppt
Biomedical image processing ppt
Priyanka Goswami
 
Introduction to digital image processing
Introduction to digital image processingIntroduction to digital image processing
Introduction to digital image processing
Hossain Md Shakhawat
 
clinical needs, medical devices, medical
clinical needs, medical devices, medicalclinical needs, medical devices, medical
clinical needs, medical devices, medical
AbdulWahab672
 
DIP Notes Unit-1 PPT , engineering, computer Science
DIP Notes Unit-1 PPT , engineering, computer ScienceDIP Notes Unit-1 PPT , engineering, computer Science
DIP Notes Unit-1 PPT , engineering, computer Science
baaburao4200
 
Vision Basics
Vision BasicsVision Basics
Vision Basics
DrHemaCR
 
Image processing.pdf
Image processing.pdfImage processing.pdf
Image processing.pdf
JasaRChoudhary
 

Similar to Image processing.pptx (20)

Digital image processing2.pptx
Digital image processing2.pptxDigital image processing2.pptx
Digital image processing2.pptx
 
introdaction.pptx
introdaction.pptxintrodaction.pptx
introdaction.pptx
 
An Introduction to digital image processing
An Introduction to digital image processingAn Introduction to digital image processing
An Introduction to digital image processing
 
1-introduction-image-processing_Chapter1-Digital_Image_Processing.pptx
1-introduction-image-processing_Chapter1-Digital_Image_Processing.pptx1-introduction-image-processing_Chapter1-Digital_Image_Processing.pptx
1-introduction-image-processing_Chapter1-Digital_Image_Processing.pptx
 
Rendering Algorithms.pptx
Rendering Algorithms.pptxRendering Algorithms.pptx
Rendering Algorithms.pptx
 
digital image processing cresent ppt slides
digital image processing  cresent ppt slidesdigital image processing  cresent ppt slides
digital image processing cresent ppt slides
 
DIGITAL IMAGE FUNDAS.ppt
DIGITAL IMAGE FUNDAS.pptDIGITAL IMAGE FUNDAS.ppt
DIGITAL IMAGE FUNDAS.ppt
 
Sub ecs 702_30sep14
Sub ecs 702_30sep14Sub ecs 702_30sep14
Sub ecs 702_30sep14
 
digitalimagefundamentals.ppt
digitalimagefundamentals.pptdigitalimagefundamentals.ppt
digitalimagefundamentals.ppt
 
Biometric simulator for visually impaired (1)
Biometric simulator for visually impaired (1)Biometric simulator for visually impaired (1)
Biometric simulator for visually impaired (1)
 
digital imaging ppt.ppt
digital imaging ppt.pptdigital imaging ppt.ppt
digital imaging ppt.ppt
 
Dip lect2-Machine Vision Fundamentals
Dip  lect2-Machine Vision Fundamentals Dip  lect2-Machine Vision Fundamentals
Dip lect2-Machine Vision Fundamentals
 
image Processing Fundamental Is .ppt
image Processing Fundamental Is     .pptimage Processing Fundamental Is     .ppt
image Processing Fundamental Is .ppt
 
Image Processing Fundamentals .ppt
Image Processing Fundamentals        .pptImage Processing Fundamentals        .ppt
Image Processing Fundamentals .ppt
 
Biomedical image processing ppt
Biomedical image processing pptBiomedical image processing ppt
Biomedical image processing ppt
 
Introduction to digital image processing
Introduction to digital image processingIntroduction to digital image processing
Introduction to digital image processing
 
clinical needs, medical devices, medical
clinical needs, medical devices, medicalclinical needs, medical devices, medical
clinical needs, medical devices, medical
 
DIP Notes Unit-1 PPT , engineering, computer Science
DIP Notes Unit-1 PPT , engineering, computer ScienceDIP Notes Unit-1 PPT , engineering, computer Science
DIP Notes Unit-1 PPT , engineering, computer Science
 
Vision Basics
Vision BasicsVision Basics
Vision Basics
 
Image processing.pdf
Image processing.pdfImage processing.pdf
Image processing.pdf
 

More from Mattupallipardhu

Module 1.pptx
Module 1.pptxModule 1.pptx
Module 1.pptx
Mattupallipardhu
 
Pyhton-1a-Basics.pdf
Pyhton-1a-Basics.pdfPyhton-1a-Basics.pdf
Pyhton-1a-Basics.pdf
Mattupallipardhu
 
Lec_2.pdf
Lec_2.pdfLec_2.pdf
Lec_2.pdf
Mattupallipardhu
 
Lec_10.pdf
Lec_10.pdfLec_10.pdf
Lec_10.pdf
Mattupallipardhu
 
Lec_4.pdf
Lec_4.pdfLec_4.pdf
Lec_4.pdf
Mattupallipardhu
 
2-D Transformations.pdf
2-D Transformations.pdf2-D Transformations.pdf
2-D Transformations.pdf
Mattupallipardhu
 
Ray Tracing.pdf
Ray Tracing.pdfRay Tracing.pdf
Ray Tracing.pdf
Mattupallipardhu
 
Fundamentals of Computer Graphics.pdf
Fundamentals of Computer Graphics.pdfFundamentals of Computer Graphics.pdf
Fundamentals of Computer Graphics.pdf
Mattupallipardhu
 
raster algorithm.pdf
raster algorithm.pdfraster algorithm.pdf
raster algorithm.pdf
Mattupallipardhu
 
Hidden_surfaces.pdf
Hidden_surfaces.pdfHidden_surfaces.pdf
Hidden_surfaces.pdf
Mattupallipardhu
 
cathoderaytube.pdf
cathoderaytube.pdfcathoderaytube.pdf
cathoderaytube.pdf
Mattupallipardhu
 
2d Transformation.pdf
2d Transformation.pdf2d Transformation.pdf
2d Transformation.pdf
Mattupallipardhu
 
3. Syntax Analyzer.pptx
3. Syntax Analyzer.pptx3. Syntax Analyzer.pptx
3. Syntax Analyzer.pptx
Mattupallipardhu
 

More from Mattupallipardhu (13)

Module 1.pptx
Module 1.pptxModule 1.pptx
Module 1.pptx
 
Pyhton-1a-Basics.pdf
Pyhton-1a-Basics.pdfPyhton-1a-Basics.pdf
Pyhton-1a-Basics.pdf
 
Lec_2.pdf
Lec_2.pdfLec_2.pdf
Lec_2.pdf
 
Lec_10.pdf
Lec_10.pdfLec_10.pdf
Lec_10.pdf
 
Lec_4.pdf
Lec_4.pdfLec_4.pdf
Lec_4.pdf
 
2-D Transformations.pdf
2-D Transformations.pdf2-D Transformations.pdf
2-D Transformations.pdf
 
Ray Tracing.pdf
Ray Tracing.pdfRay Tracing.pdf
Ray Tracing.pdf
 
Fundamentals of Computer Graphics.pdf
Fundamentals of Computer Graphics.pdfFundamentals of Computer Graphics.pdf
Fundamentals of Computer Graphics.pdf
 
raster algorithm.pdf
raster algorithm.pdfraster algorithm.pdf
raster algorithm.pdf
 
Hidden_surfaces.pdf
Hidden_surfaces.pdfHidden_surfaces.pdf
Hidden_surfaces.pdf
 
cathoderaytube.pdf
cathoderaytube.pdfcathoderaytube.pdf
cathoderaytube.pdf
 
2d Transformation.pdf
2d Transformation.pdf2d Transformation.pdf
2d Transformation.pdf
 
3. Syntax Analyzer.pptx
3. Syntax Analyzer.pptx3. Syntax Analyzer.pptx
3. Syntax Analyzer.pptx
 

Recently uploaded

1.4 modern child centered education - mahatma gandhi-2.pptx
1.4 modern child centered education - mahatma gandhi-2.pptx1.4 modern child centered education - mahatma gandhi-2.pptx
1.4 modern child centered education - mahatma gandhi-2.pptx
JosvitaDsouza2
 
Francesca Gottschalk - How can education support child empowerment.pptx
Francesca Gottschalk - How can education support child empowerment.pptxFrancesca Gottschalk - How can education support child empowerment.pptx
Francesca Gottschalk - How can education support child empowerment.pptx
EduSkills OECD
 
How to Make a Field invisible in Odoo 17
How to Make a Field invisible in Odoo 17How to Make a Field invisible in Odoo 17
How to Make a Field invisible in Odoo 17
Celine George
 
The Accursed House by Émile Gaboriau.pptx
The Accursed House by Émile Gaboriau.pptxThe Accursed House by Émile Gaboriau.pptx
The Accursed House by Émile Gaboriau.pptx
DhatriParmar
 
Honest Reviews of Tim Han LMA Course Program.pptx
Honest Reviews of Tim Han LMA Course Program.pptxHonest Reviews of Tim Han LMA Course Program.pptx
Honest Reviews of Tim Han LMA Course Program.pptx
timhan337
 
special B.ed 2nd year old paper_20240531.pdf
special B.ed 2nd year old paper_20240531.pdfspecial B.ed 2nd year old paper_20240531.pdf
special B.ed 2nd year old paper_20240531.pdf
Special education needs
 
The French Revolution Class 9 Study Material pdf free download
The French Revolution Class 9 Study Material pdf free downloadThe French Revolution Class 9 Study Material pdf free download
The French Revolution Class 9 Study Material pdf free download
Vivekanand Anglo Vedic Academy
 
A Strategic Approach: GenAI in Education
A Strategic Approach: GenAI in EducationA Strategic Approach: GenAI in Education
A Strategic Approach: GenAI in Education
Peter Windle
 
Guidance_and_Counselling.pdf B.Ed. 4th Semester
Guidance_and_Counselling.pdf B.Ed. 4th SemesterGuidance_and_Counselling.pdf B.Ed. 4th Semester
Guidance_and_Counselling.pdf B.Ed. 4th Semester
Atul Kumar Singh
 
Acetabularia Information For Class 9 .docx
Acetabularia Information For Class 9  .docxAcetabularia Information For Class 9  .docx
Acetabularia Information For Class 9 .docx
vaibhavrinwa19
 
CLASS 11 CBSE B.St Project AIDS TO TRADE - INSURANCE
CLASS 11 CBSE B.St Project AIDS TO TRADE - INSURANCECLASS 11 CBSE B.St Project AIDS TO TRADE - INSURANCE
CLASS 11 CBSE B.St Project AIDS TO TRADE - INSURANCE
BhavyaRajput3
 
Operation Blue Star - Saka Neela Tara
Operation Blue Star   -  Saka Neela TaraOperation Blue Star   -  Saka Neela Tara
Operation Blue Star - Saka Neela Tara
Balvir Singh
 
The Challenger.pdf DNHS Official Publication
The Challenger.pdf DNHS Official PublicationThe Challenger.pdf DNHS Official Publication
The Challenger.pdf DNHS Official Publication
Delapenabediema
 
The geography of Taylor Swift - some ideas
The geography of Taylor Swift - some ideasThe geography of Taylor Swift - some ideas
The geography of Taylor Swift - some ideas
GeoBlogs
 
"Protectable subject matters, Protection in biotechnology, Protection of othe...
"Protectable subject matters, Protection in biotechnology, Protection of othe..."Protectable subject matters, Protection in biotechnology, Protection of othe...
"Protectable subject matters, Protection in biotechnology, Protection of othe...
SACHIN R KONDAGURI
 
Unit 2- Research Aptitude (UGC NET Paper I).pdf
Unit 2- Research Aptitude (UGC NET Paper I).pdfUnit 2- Research Aptitude (UGC NET Paper I).pdf
Unit 2- Research Aptitude (UGC NET Paper I).pdf
Thiyagu K
 
Digital Tools and AI for Teaching Learning and Research
Digital Tools and AI for Teaching Learning and ResearchDigital Tools and AI for Teaching Learning and Research
Digital Tools and AI for Teaching Learning and Research
Vikramjit Singh
 
Chapter 3 - Islamic Banking Products and Services.pptx
Chapter 3 - Islamic Banking Products and Services.pptxChapter 3 - Islamic Banking Products and Services.pptx
Chapter 3 - Islamic Banking Products and Services.pptx
Mohd Adib Abd Muin, Senior Lecturer at Universiti Utara Malaysia
 
Adversarial Attention Modeling for Multi-dimensional Emotion Regression.pdf
Adversarial Attention Modeling for Multi-dimensional Emotion Regression.pdfAdversarial Attention Modeling for Multi-dimensional Emotion Regression.pdf
Adversarial Attention Modeling for Multi-dimensional Emotion Regression.pdf
Po-Chuan Chen
 
678020731-Sumas-y-Restas-Para-Colorear.pdf
678020731-Sumas-y-Restas-Para-Colorear.pdf678020731-Sumas-y-Restas-Para-Colorear.pdf
678020731-Sumas-y-Restas-Para-Colorear.pdf
CarlosHernanMontoyab2
 

Recently uploaded (20)

1.4 modern child centered education - mahatma gandhi-2.pptx
1.4 modern child centered education - mahatma gandhi-2.pptx1.4 modern child centered education - mahatma gandhi-2.pptx
1.4 modern child centered education - mahatma gandhi-2.pptx
 
Francesca Gottschalk - How can education support child empowerment.pptx
Francesca Gottschalk - How can education support child empowerment.pptxFrancesca Gottschalk - How can education support child empowerment.pptx
Francesca Gottschalk - How can education support child empowerment.pptx
 
How to Make a Field invisible in Odoo 17
How to Make a Field invisible in Odoo 17How to Make a Field invisible in Odoo 17
How to Make a Field invisible in Odoo 17
 
The Accursed House by Émile Gaboriau.pptx
The Accursed House by Émile Gaboriau.pptxThe Accursed House by Émile Gaboriau.pptx
The Accursed House by Émile Gaboriau.pptx
 
Honest Reviews of Tim Han LMA Course Program.pptx
Honest Reviews of Tim Han LMA Course Program.pptxHonest Reviews of Tim Han LMA Course Program.pptx
Honest Reviews of Tim Han LMA Course Program.pptx
 
special B.ed 2nd year old paper_20240531.pdf
special B.ed 2nd year old paper_20240531.pdfspecial B.ed 2nd year old paper_20240531.pdf
special B.ed 2nd year old paper_20240531.pdf
 
The French Revolution Class 9 Study Material pdf free download
The French Revolution Class 9 Study Material pdf free downloadThe French Revolution Class 9 Study Material pdf free download
The French Revolution Class 9 Study Material pdf free download
 
A Strategic Approach: GenAI in Education
A Strategic Approach: GenAI in EducationA Strategic Approach: GenAI in Education
A Strategic Approach: GenAI in Education
 
Guidance_and_Counselling.pdf B.Ed. 4th Semester
Guidance_and_Counselling.pdf B.Ed. 4th SemesterGuidance_and_Counselling.pdf B.Ed. 4th Semester
Guidance_and_Counselling.pdf B.Ed. 4th Semester
 
Acetabularia Information For Class 9 .docx
Acetabularia Information For Class 9  .docxAcetabularia Information For Class 9  .docx
Acetabularia Information For Class 9 .docx
 
CLASS 11 CBSE B.St Project AIDS TO TRADE - INSURANCE
CLASS 11 CBSE B.St Project AIDS TO TRADE - INSURANCECLASS 11 CBSE B.St Project AIDS TO TRADE - INSURANCE
CLASS 11 CBSE B.St Project AIDS TO TRADE - INSURANCE
 
Operation Blue Star - Saka Neela Tara
Operation Blue Star   -  Saka Neela TaraOperation Blue Star   -  Saka Neela Tara
Operation Blue Star - Saka Neela Tara
 
The Challenger.pdf DNHS Official Publication
The Challenger.pdf DNHS Official PublicationThe Challenger.pdf DNHS Official Publication
The Challenger.pdf DNHS Official Publication
 
The geography of Taylor Swift - some ideas
The geography of Taylor Swift - some ideasThe geography of Taylor Swift - some ideas
The geography of Taylor Swift - some ideas
 
"Protectable subject matters, Protection in biotechnology, Protection of othe...
"Protectable subject matters, Protection in biotechnology, Protection of othe..."Protectable subject matters, Protection in biotechnology, Protection of othe...
"Protectable subject matters, Protection in biotechnology, Protection of othe...
 
Unit 2- Research Aptitude (UGC NET Paper I).pdf
Unit 2- Research Aptitude (UGC NET Paper I).pdfUnit 2- Research Aptitude (UGC NET Paper I).pdf
Unit 2- Research Aptitude (UGC NET Paper I).pdf
 
Digital Tools and AI for Teaching Learning and Research
Digital Tools and AI for Teaching Learning and ResearchDigital Tools and AI for Teaching Learning and Research
Digital Tools and AI for Teaching Learning and Research
 
Chapter 3 - Islamic Banking Products and Services.pptx
Chapter 3 - Islamic Banking Products and Services.pptxChapter 3 - Islamic Banking Products and Services.pptx
Chapter 3 - Islamic Banking Products and Services.pptx
 
Adversarial Attention Modeling for Multi-dimensional Emotion Regression.pdf
Adversarial Attention Modeling for Multi-dimensional Emotion Regression.pdfAdversarial Attention Modeling for Multi-dimensional Emotion Regression.pdf
Adversarial Attention Modeling for Multi-dimensional Emotion Regression.pdf
 
678020731-Sumas-y-Restas-Para-Colorear.pdf
678020731-Sumas-y-Restas-Para-Colorear.pdf678020731-Sumas-y-Restas-Para-Colorear.pdf
678020731-Sumas-y-Restas-Para-Colorear.pdf
 

Image processing.pptx

  • 1. Introduction and Fundamentals of Digital Image Processing
  • 2. Origin • Significance of Digital Image Processing: • Digital Image Processing is an interdisciplinary field that involves manipulating and analyzing digital images to extract useful information, enhance visual quality, and make informed decisions. • Its applications span a wide range of domains, including medical diagnosis, remote sensing, entertainment, surveillance, and more. • Evolution and Importance: • The evolution from analog to digital image processing has revolutionized how we capture, manipulate, and interpret visual information. • Digital images are now integral to modern communication, scientific research, and artistic expression.
  • 3. What's an image? • An image refers to a 2D light intensity function f(x, y), where (x, y) denote spatial coordinates and the value of ‘f’ at any point (x, y) is proportional to the brightness or gray levels of the image at that point. • A digital image is an image f(x, y) that has been discretized both in spatial coordinates and brightness. • The elements of such a digital array are called image elements or pixels. A simple image model: • To be suitable for computer processing, an image f(x, y) must be digitalized both spatially and in amplitude. • Digitization of the spatial coordinates (x, y) is called image sampling. • Amplitude digitization is called gray-level quantization. • The storage and processing requirements increase rapidly with the spatial resolution and the number of gray levels. • Example: A 256 gray-level image of size 256x256 occupies 64K bytes of memory. • Images of very low spatial resolution produce a checkerboard effect. • The use of insufficient number of gray levels in smooth areas of a digital image results in false contouring.
  • 4. Fundamental Image Processing Steps Image Acquisition • Image acquisition is the first step in image processing. This step is also known as preprocessing in image processing. It involves retrieving the image from a source, usually a hardware-based source. Image Enhancement • Image enhancement is the process of bringing out and highlighting certain features of interest in an image that has been obscured. This can involve changing the brightness, contrast, etc.
  • 5. Fundamental Image Processing Steps Image Restoration • Image restoration is the process of improving the appearance of an image. However, unlike image enhancement, image restoration is done using certain mathematical or probabilistic models. Color Image Processing • Color image processing includes a number of color modeling techniques in a digital domain. This step has gained prominence due to the significant use of digital images over the internet. Wavelets and Multiresolution Processing • Wavelets are used to represent images in various degrees of resolution. The images are subdivided into wavelets or smaller regions for data compression and for pyramidal representation. Compression • Compression is a process used to reduce the storage required to save an image or the bandwidth required to transmit it. This is done particularly when the image is for use on the Internet.
  • 6. Fundamental Image Processing Steps Morphological Processing • Morphological processing is a set of processing operations for morphing images based on their shapes. Segmentation • Segmentation is one of the most difficult steps of image processing. It involves partitioning an image into its constituent parts or objects. Representation and Description • After an image is segmented into regions in the segmentation process, each region is represented and described in a form suitable for further computer processing. Representation deals with the image’s characteristics and regional properties. Description deals with extracting quantitative information that helps differentiate one class of objects from the other. Recognition • Recognition assigns a label to an object based on its description.
  • 7. Components and applications of image processing Image sensors Image sensors detect the intensity, amplitude, coordinates, and other characteristics of images and send the information to image processing hardware. It contains the problem domain. Image Processing Hardware Image processing hardware is the specialized hardware that is utilized to process the image sensor instructions. It sends the output to a general-purpose computer. Computer The computer used in the image processing system is the same computer that we use in our daily lives. Image Processing Software The software that contains all of the mechanisms and algorithms utilized in an image processing system is known as image processing software. Mass Storage During image processing, the pixels are stored in mass storage.
  • 8. Components and applications of image processing Hard Copy Device Once the image has been processed, it is saved to a hard copy device. It might be a pen drive or another type of external ROM device. Image Display It includes the monitor or display screen on which the processed images are shown. Network The network connects all of the aforementioned aspects of the image processing system.
  • 9. Visual Perception • Visual perception is the process by which the human brain interprets and makes sense of visual information received from the eyes. It involves the complex interaction between the eyes, the optic nerves, and various regions of the brain responsible for processing visual stimuli. Visual perception allows us to perceive the world around us, recognize objects, navigate our environment, and interact with it effectively. The basic elements of visual perceptions are: • Structure of Eye • Image Formation in the Eye • Brightness Adaptation and Discrimination
  • 10. Structure of Eye: • The human eye is a slightly asymmetrical sphere with an average diameter of the length of 20mm to 25mm. It has a volume of about 6.5cc. The eye is just like a camera. The external object is seen as the camera take the picture of any object. • Light enters the eye through a small hole called the pupil, a black looking aperture having the quality of contraction of eye when exposed to bright light and is focused on the retina which is like a camera film. • The lens, iris, and cornea are nourished by clear fluid, know as anterior chamber. The fluid flows from ciliary body to the pupil and is absorbed through the channels in the angle of the anterior chamber. • The delicate balance of aqueous production and absorption controls pressure within the eye. • Cones in eye number between 6 to 7 million which are highly sensitive to colors. Human visualizes the colored image in daylight due to these cones. The cone vision is also called as photopic or bright-light vision. • Rods in the eye are much larger between 75 to 150 million and are distributed over the retinal surface. Rods are not involved in the color vision and are sensitive to low levels of illumination.
  • 11. Image Formation in the Eye: When the lens of the eye focus an image of the outside world onto a light-sensitive membrane in the back of the eye, called retina the image is formed. The lens of the eye focuses light on the photoreceptive cells of the retina which detects the photons of light and responds by producing neural impulses. The distance between the lens and the retina is about 17mm and the focal length is approximately 14mm to 17mm. Brightness Adaptation and Discrimination: Digital images are displayed as a discrete set of intensities. The eyes ability to discriminate black and white at different intensity levels is an important consideration in presenting image processing result. The range of light intensity levels to which the human visual system can adapt is of the order of 1010 from the scotopic threshold to the glare limit. In a photopic vision, the range is about 106.
  • 12. Image Sensing and Acquisition: • Images can be generated by the combination of an illuminating source and reflection or absorption of energy from that source by the elements of the scene being imaged. • The illuminating source could be sun or any other source of electromagnetic energy such as radar, IR rays or X-ray energy. • Depending upon the nature of source, illumination energy is reflected from or transmitted through object. • This reflected or transmitted energy is focused onto a photo converter which converts the energy into visible light.
  • 13. Image Sensing and Acquisition: • There are 3 principal sensor arrangements (produce an electrical output proportional to light intensity). (i)Single imaging Sensor (ii)Line sensor (iii)Array sensor Image Acquisition using a single sensor The most common sensor of this type is the photodiode, which is constructed of silicon materials and whose output voltage waveform is proportional to light. The use of a filter in front of a sensor improves selectivity. For example, a green (pass) filter in front of a light sensor favours light in the green band of the color spectrum. As a consequence, the sensor output will be stronger for green light than for other components in the visible spectrum. Fig: Combining a single sensor with motion to generate a 2-D image
  • 14. Contd. • In order to generate a 2-D image using a single sensor, there have to be relative displacements in both the x- and y-directions between the sensor and the area to be imaged. An arrangement used in high precision scanning, where a film negative is mounted onto a drum whose mechanical rotation provides displacement in one dimension. • The single sensor is mounted on a lead screw that provides motion in the perpendicular direction. Since mechanical motion can be controlled with high precision, this method is an inexpensive (but slow) way to obtain high-resolution images.
  • 15. Image Acquisition using Sensor Strips Fig: (a) Image acquisition using linear sensor strip (b) Image acquisition using circular sensor strip. • The strip provides imaging elements in one direction. Motion perpendicular to the strip provides imaging in the other direction. This is the type of arrangement used in most flatbed scanners. Sensing devices with 4000 or more in-line sensors are possible. • In-line sensors are used routinely in airborne imaging applications, in which the imaging system is mounted on an aircraft that flies at a constant altitude and speed over the geographical area to be imaged. • One-dimensional imaging sensor strips that respond to various bands of the electromagnetic spectrum are mounted perpendicular to the direction of flight. The imaging strip gives one line of an image at a time, and the motion of the strip completes the other dimension of a two-dimensional image. • Sensor strips mounted in a ring configuration are used in medical and industrial imaging to obtain cross-sectional (“slice”) images of 3-D objects. A rotating X-ray source provides illumination and the portion of the sensors opposite the source collect the X-ray energy that pass through the object (the sensors obviously have to be sensitive to X-ray energy). • This is the basis for medical and industrial computerized axial tomography (CAT) imaging.
  • 16. Image Acquisition using Sensor Arrays Fig: An example of the digital image acquisition process (a) energy source (b) An element of a scene (d) Projection of the scene into the image (e) digitized image • This type of arrangement is found in digital cameras. A typical sensor for these cameras is a CCD array, which can be manufactured with a broad range of sensing properties and can be packaged in rugged arrays of 4000 * 4000 elements or more. • CCD sensors are used widely in digital cameras and other light sensing instruments. The response of each sensor is proportional to the integral of the light energy projected onto the surface of the sensor, a property that is used in astronomical and other applications requiring low noise images. • The first function performed by the imaging system is to collect the incoming energy and focus it onto an image plane. If the illumination is light, the front end of the imaging system is a lens, which projects the viewed scene onto the lens focal plane. • The sensor array, which is coincident with the focal plane, produces outputs proportional to the integral of the light received at each sensor.
  • 17. A Simple Image Formation Model • An image is defined by two dimensional function f(x,y). The value or amplitude of f at spatial coordinates (x,y) is a positive scalar quantity. When an image is generated from a physical process, its value are proportional to energy radiated by physical source. • As a consequence, f(x,y) must be nonzero and finite; that is, The function f(x,y) may be characterized by two components: (1) the amount of source illumination incident on the scene being viewed and (2) the amount of illumination reflected by the objects in the scene. • These are called illumination and reflectance components denoted by i(x,y) and r(x,y) respectively. The two function combine as product to form f(x,y): f(x,y)=i(x,y) r(x,y) • Where 0 < i(x,y)< ∞ and 0 <r(x,y)< 1 r(x,y)=0 means total absorption r(x,y)=1 means total reflectance. • We call the intensity of a monochrome image at any coordinates (x,y) the gray level (l) of the image at that point. That is l=f(x,y). The interval of l ranges from [0,L-1]. Where l=0 indicates black and l=1 indicates white. All the intermediate values are shades of gray varying from black to white.
  • 18. Image Sampling and Quantization • Sampling and quantization are the two important processes used to convert continuous analog image into digital image. Image sampling refers to discretization of spatial coordinates (along x axis) whereas quantization refers to discretization of gray level values (amplitude (along y axis)). • The one dimensional function shown in fig 2.16(b) is a plot of amplitude (gray level) values of the continuous image along the line segment AB in fig 2.16(a). The random variation is due to the image noise. • To sample this function, we take equally spaced samples along line AB as shown in fig 2.16 (c). • In order to form a digital function, the gray level values also must be converted(quantizes) into discrete quantities. • The right side of fig 2.16 (c) shows the gray level scale divided into eight discrete levels, ranging from black to white. The result of both sampling and quantization are shown in fig 2.16 (d).
  • 19. Representing Digital Image • Representing Digital Image An image may be defined as a two-dimensional function, f(x, y), where x and y are spatial (plane) coordinates, and the amplitude of „f ‟ at any pair of coordinates (x, y) is called the intensity or gray level of the image at that point. Fig: Zoomed image, where small white boxes inside the image represent pixels Fig: Coordinate convention used to represent digital images
  • 20. Contd. • Digital image is composed of a finite number of elements referred to as picture elements, image elements, pels, and pixels. Pixel is the term most widely used to denote the elements of a digital image. We can represent M*N digital image as compact matrix as shown in fig below When x, y, and the amplitude values of f are all finite, discrete quantities, we call the image a digital image. The field of digital image processing refers to processing digital images by means of a digital computer.
  • 21. • If k is the number of bits per pixel, then the number of gray levels, L, is an integer power of 2. • When an image can have k 2 gray levels, it is common practice to refer to the image as a “k-bit image”. For example, an image with 256 possible grey level values is called an 8 bit image. • Therefore the number of bits required to store a digitalized image of size M*N is • When M=N then
  • 22. • Spatial resolution is the smallest discernable (detect with difficulty )change in an image. Graylevel resolution is the smallest discernable (detect with difficulty) change in gray level. • Image resolution quantifies how much close two lines (say one dark and one light) can be to each other and still be visibly resolved. The resolution can be specified as number of lines per unit distance, say 10 lines per mm or 5 line pairs per mm. Another measure of image resolution is dots per inch, i.e. the number of discernible dots per inch. Spatial and Gray-Level Resolution Fig: A 1024 x 2014, 8 bit image subsampled down to size 32 x 32 pixels. The number of allowable kept at 256.
  • 23. • Image of size 1024*1024 pixels whose gray levels are represented by 8 bits is as shown in fig above. The results of subsampling the 1024*1024 image. The subsampling was accomplished by deleting the appropriate number of rows and columns from the original image. • For example, the 512*512 image was obtained by deleting every other row and column from the 1024*1024 image. The 256*256 image was generated by deleting every other row and column in the 512*512 image, and so on. • The number of allowed gray levels was kept at 256. These images show dimensional proportions between various sampling densities, but their size differences make it difficult to see the effects resulting from a reduction in the number of samples. • The simplest way to compare these effects is to bring all the subsampled images up to size 1024 x 1024.
  • 24. Fig: (a) 1024 x 1024, 8 bit image (b) 512 x 512 image resampled into 1024 x 1024 pixels by row and column duplication. (c) through (f) 256 x 256, 128 x 128, 64 x 64, and 32 x 32 images resampled into 1024 x 1024 pixels.
  • 25. Gray-Level Resolution Fig: 452 x 374, 256 level image. (b)- (d) Image displayed in 128, 64, 32,16,8,4 and 2 grey level, while keeping spatial resolution constant. • In this example, we keep the number of samples constant and reduce the number of grey levels from 256 to 2.
  • 26. Some Basic Relationship between Pixels Neighbors of a Pixel In a 2-D coordinate system each pixel p in an image can be identified by a pair of spatial coordinates (x, y). Referring to the Fig below, a pixel p has two horizontal neighbors (x−1, y), (x+1, y) and two vertical neighbors (x, y−1), (x, y+1). These 4 pixels together constitute the 4-neighbors of pixel p, denoted as N4(p). The pixel p also has 4 diagonal neighbors which are: (x+1, y+1), (x+1, y−1), (x−1, y+ 1), (x−1, y−1). The set of 4 diagonal neighbors forms the diagonal neighborhood denoted as ND(p). The set of 8 pixels surrounding the pixel p forms the 8-neighborhood denoted as N8(p). We have N8(p) = N4(p) ∪ ND(p). Figure : Pixel Neighborhood: The center pixel p is shown in a dashed pattern and the pixels in the defined neighborhood are shown in filled color.
  • 27. Adjacency, Connectivity, Regions, AND Boundaries Adjacency • The concept of adjacency has a slightly different meaning from neighborhood. Adjacency takes into account not just spatial neighborhood but also intensity groups. • Suppose we define a set S={0,L-1} of intensities which are considered to belong to the same group. Two pixels p and q will be termed adjacent if both of them have intensities from set S and both also conform to some definition of neighborhood. • 4 Adjacency: Two pixels p and q are termed as 4-adjacent if they have intensities from set S and q belongs to N4(p). • 8 Adjacency Two pixels p and q are termed as 4-adjacent if they have intensities from set S and q belongs to N8(p). • Mixed adjacency or m-adjacency : (there shouldn’t be closed path) Two pixels with intensity values from set S are m-adjacent if
  • 28. • Mixed adjacency is a modification of 8-adjacency and is used to eliminate the multiple path connections that often arise when 8- adjacency is used. Fig: (a) Arrangement of pixels; (b) pixels that are 8-adjacent to the center pixel (c) madjacency
  • 29.
  • 30. Path Path • A (digital) path (or curve) from pixel p with coordinates (x0,y0) to pixel q with coordinates (xn, yn) is a sequence of distinct pixels with coordinates (x0, y0), (x1, y1), …, (xn, yn) • Where (xi yi) and (xi-1, yi-1) are adjacent for 1 ≤ i ≤ n. • Here n is the length of the path. • If (x0, y0) = (xn, yn), the path is closed path. • We can define 4-, 8-, and m-paths based on the type of adjacency used.
  • 31. Connected components • Let S represent a subset of pixels in an image. Two pixels p and q are said to be connected in S if there exists a path between them consisting entirely of pixels in S. For any pixel p in S, the set of pixels connected to it in S is called a connected component of S. If it has only one connected component, then set S is called connected set. • A Region R is a subset of pixels in an image such that all pixels in R form a connected component. • A Boundary of a region R is the set of pixels in the region that have one or more neighbors that are not in R. If R happens to be an entire image, then its boundary is defined as the set of pixels in the first and last rows and columns of the image. • Distance Measure For pixels p,q and z, with coordinates (x,y),(s,t) and (v,w), repectively, D is a distance function if
  • 32. • The distance between two pixels p and q with coordinates (x1, y1), (x2, y2) respectively can be formulated in several ways: Pixels having a Euclidean distance r from a given pixel will lie on a circle of radius r centered at it and r = distance In this case, the pixels having a D4 distance from (x,y) less than or equal to some value r from a diamond centered at (x,y). For example, the pixels with D4 distance ≤2 from (x,y) (the center point) form the following contours of constant distance:
  • 33. • Pixels having a city-block distance 1 from a given pixel are its 4-neighbors. • Green line is Euclidean distance. Red, blue and yellow are City Block Distance. It's called city-block distance, because it is calculated as if on each pixel between your two coordinates stood a block (house) which you have to go around. That means, you can only go along the vertical or horizontal lines between the pixels but not diagonal. It's the same like the movement of the rook on a chess field. • In this case, the pixels having a D8 distance from (x,y) less than or equal to some value r from a square centered at (x,y). For example, the pixels with D8 distance ≤2 from (x,y) (the center point) form the following contours of constant distance.
  • 34. • To measure D8 distance, you can only go along the vertical or horizontal or diagonal lines between the pixels. • Pixels having a chess-board distance 1 from a given pixel are its 8-neighbors. Dm distance between two points is defined as the shortest m path between the points. When V={1} p,p2 and p4 have value 1
  • 35. • Dm shortest distance between p and p4 is 2 When V={1} p,p1,p2 and p4 have value 1 or p,p2,p3 and p4 have value 1 Dm shortest distance between p and p4 is 3
  • 36. Image Formats • Image Format describes how data related to the image will be stored. Data can be stored in compressed, Uncompressed, or vector format. Each format of the image has a different advantage and disadvantage. Image types such as TIFF are good for printing while JPG or PNG, are best for the web. • TIFF(.tif, .tiff) Tagged Image File Format this format store image data without losing any data. It does not perform any compression on images, and a high-quality image is obtained but the size of the image is also large, which is good for printing, and professional printing. • JPEG (.jpg, .jpeg) Joint Photographic Experts Group is a loss-prone (lossy) format in which data is lost to reduce the size of the image. Due to compression, some data is lost but that loss is very less. It is a very common format and is good for digital cameras, nonprofessional prints, E-Mail, Powerpoint, etc., making it ideal for web use. • GIF (.gif) GIF or Graphics Interchange Format files are used for web graphics. They can be animated and are limited to only 256 colors, which can allow for transparency. GIF files are typically small in size and are portable. • PNG (.png) PNG or Portable Network Graphics files are a lossless image format. It was designed to replace gif format as gif supported 256 colors unlike PNG which support 16 million colors. • Bitmap (.bmp) Bit Map Image file is developed by Microsoft for windows. It is same as TIFF due to lossless, no compression property. Due to BMP being a proprietary format, it is generally recommended to use TIFF files. • EPS (.eps) Encapsulated PostScript file is a common vector file type. EPS files can be opened in applications such as Adobe Illustrator or CorelDRAW. • RAW Image Files (.raw, .cr2, .nef, .orf, .sr2) These Files are unprocessed and created by a camera or scanner. Many digital SLR cameras can shoot in RAW, whether it be a .raw, .cr2, or .nef. These images are the equivalent of a digital negative, meaning that they hold a lot of image information. These images need to be processed in an editor such as Adobe Photoshop or Lightroom. It saves metadata and is used for photography.
  • 37.
  • 38. Raster file formats What is a raster image ? • Raster images are made up of a set grid of dots called pixels where each pixel is assigned a color. Unlike a vector image, raster images are resolution dependent, meaning they exist at one size. When you transform a raster image, you stretch the pixels themselves, which can result in a “pixelated” or blurry image. When you enlarge an image, your software is essentially guessing at what image data is missing based on the surrounding pixels. More often than not, the results aren’t great. • Raster images are typically used for photographs, digital artwork and web graphics (such as banner ads, social media content and email graphics). Adobe Photoshop is the industry-standard image editor that is used to create, design and edit raster images as well as to add effects, shadows and textures to existing designs.
  • 39. CMYK vs. RGB • All raster images can be saved in one of two primary color models: CMYK and RGB. CMYK a four-color printing process that stands for cyan, magenta, yellow and key (black). These colors represent the four inks that will combine during the printing process. Files saved in this format will be optimized for physical printing. RGB is a light-based color model that stands for red, green and blue. These are the three primary colors of light that combine to produce other colors. Files saved in this format will be optimized for the web, mobile phones, film and video—anything that appears on a screen.
  • 40. Lossy vs. lossless • Each raster image file is either lossless or lossy, depending on how the format handles your image data. • Lossless image formats capture all of the data of your original file. Nothing from the original file, photo, or piece of art is lost—hence the term “lossless.” The file may still be compressed, but all lossless formats will be able to reconstruct your image to its original state. • Lossy image formats approximate what your original image looks like. For example, a lossy image might reduce the amount of colors in your image or analyze the image for any unnecessary data. These clever technical tricks will typically reduce the file size, though they may reduce the quality of your image. • Typically, lossy files are much smaller than lossless files, making them ideal to use online where file size and download speed are vital
  • 41. JPEG/JPG • JPEG is a lossy raster format that stands for Joint Photographic Experts Group, the technical team that developed it. This is one of the most widely used formats online, typically for photos, email graphics and large web images like banner ads. JPEG images have a sliding scale of compression that decreases file size tremendously, but increases artifacts or pixelation the more the image is compressed.
  • 42. You should use a JPEG when… • You’re dealing with online photos and/or artwork. JPEGs offer you the most flexibility with raster editing and compression making them ideal for web images that need to be downloaded quickly. • You want to print photos and/or artwork. At high resolution files with low compression, JPEGs are perfect for editing and then printing. • You need to send a quick preview image to a client. JPEG images can be reduced to very small sizes making them great for emailing. Don’t use a JPEG when… • You need a web graphic with transparency. JPEGs do not have a transparency channel and must have a solid color background. GIF and PNG are your best options for transparency. • You need a layered, editable image. JPEGs are a flat image format meaning that all edits are saved into one image layer and cannot be undone. Consider a PSD (Photoshop) file for a fully editable image.
  • 43. GIF • GIF is a lossless raster format that stands for Graphics Interchange Format. The big question: how is it pronounced? • The creator of GIF says “JIFF” like the peanut butter. This writer (and lots of the world) says “GIFF” because graphics starts with a “guh.” • GIF is also a widely used web image format, typically for animated graphics like banner ads, email images and social media memes. Though GIFs are lossless, they can be exported in a number of highly customizable settings that reduce the amount of colors and image information, which in turn reduces the file size.
  • 44. You should use a GIF when… • You want to create web animation. GIF images hold all of the animation frames and timing information in one single file. Image editors like Photoshop make it easy to create a short animation and export it as a GIF. • You need transparency. GIF images have an “alpha channel” that can be transparent, so you can place your image on any colored background. • You need a small file. The compression techniques in the GIF format allow image files to shrink tremendously. For very simple icons and web graphics, GIF is the best image file format. Don’t use a GIF when… • You need a photographic-quality image. Though GIFs can be high resolution, they have a limit of 256 colors (unless you know a few tricks). Photos typically have thousands of colors and will look flat and less vibrant (and sometimes weird due to color banding) when converted to GIF. • You need to print an image. Because of the color limit, most printed photos will lack depth. If you need to print photos, look at TIFF, PSD and JPG. • You need a layered, editable image. GIFs are a flat image format meaning that all edits are saved into one image layer and cannot be undone. Consider a PSD (Photoshop) file for a fully editable image.
  • 45. PNG • PNG is a lossless raster format that stands for Portable Network Graphics. Think of PNGs as the next-generation GIF. This format has built-in transparency, but can also display higher color depths, which translates into millions of colors. PNGs are a web standard and are quickly becoming one of the most common image formats used online.
  • 46. • You should use a PNG when… • You need high-quality transparent web graphics. PNG images have a variable “alpha channel” that can have any degree of transparency (in contrast with GIFs that only have on/off transparency). Plus, with greater color depths, you’ll have a more vibrant image than you would with a GIF. • You have illustrations with limited colors. Though any image will work, PNG files are best with a small color palette. • You need a small file. PNG files can shrink to incredibly tiny sizes—especially images that are simple colors, shapes or text. This makes it the ideal image file type for web graphics. • Don’t use a PNG when… • You’re working with photos or artwork. Thanks to PNGs’ high color depth, the format can easily handle high resolution photos. However, because it is a lossless web format, file sizes tend to get very large. If you’re working with photos on the web, go with JPEG. • You’re dealing with a print project. PNG graphics are optimized for the screen. You can definitely print a PNG, but you’d be better off with a JPEG (lossy) or TIFF file.
  • 47. TIFF/TIF • TIFF is a lossless raster format that stands for Tagged Image File Format. Because of its extremely high quality, the format is primarily used in photography and desktop publishing. You’ll likely encounter TIFF files when you scan a document or take a photo with a professional digital camera. Do note that TIFF files can also be used as a “container” for JPEG images. These files will be much smaller than traditional TIFF files, which are typically very large.
  • 48. • You should use a TIFF when… • You need high-quality print graphics. Along with RAW, TIFF files are among the highest quality graphic formats available. If you’re printing photos—especially at enormous sizes—use this format. • You are making a high-quality scan. Using TIFF to scan your documents, photos and artwork will ensure that you have the best original file to work off of. • Don’t use at TIFF when… • You’re working with web graphics. While many web browsers support it, TIFF files are optimized for print. Go with JPEG or PNG when you need to display high-quality images online.
  • 49. Vector file formats What is a vector image ? • Vector images are digital artwork in which points, lines and curves are calculated by the computer. • They essentially giant math equations, and every “equation” can be assigned a color, stroke or thickness (among other styles) to turn the shapes into art. • Unlike raster images, vector images are resolution independent. When you shrink or enlarge a vector image, your shapes get larger, but you won’t lose any detail or get any pixelation. • Because your image will always render identically, no matter the size, there is no such thing as a lossy or lossless vector image type. • Vector images are typically used for logos, icons, typesetting and digital illustrations. Adobe Illustrator is the industry-standard image editor that is used to create, design and edit vector images (though it can also incorporate raster images, as well).
  • 50. PDF • PDF stands for Portable Document Format and is an image format used to display documents and graphics correctly, no matter the device, application, operating system or web browser. At its core, PDF files have a powerful vector graphics foundation, but can also display everything from raster graphics to form fields to spreadsheets. • Because it is a near universal standard, PDF files are often the file format requested by printers to send a final design into production. Both Adobe Photoshop and Illustrator can export straight to PDF, making it easy to start your design and get it ready for printing. • You should use a PDF when… • You’re ready to print. As we mentioned, many printers prefer PDF as their primary delivery format because it is so ubiquitous. Check with your printer to see how they’d like you to prepare your file. • You want to display documents on the web. You wouldn’t use a PDF for a single icon or logo, but it’s great for posters, flyers, magazines and booklets. PDFs will keep your entire design in one package, making it easy to view, download or print. • Don’t use a PDF when… • You need to edit your design. PDFs are great containers, but use other applications for the contents. You can edit raster images with Photoshop and vector graphics with Illustrator. When you’re done, you can combine those into a PDF for easy viewing.