This paper addresses the limitations of battery-operated wireless sensor networks, particularly in wireless body area networks (WBAN), by proposing a compressive sensing PEGASIS protocol for efficient data handling. The study demonstrates that this approach enhances energy efficiency, allowing for uninterrupted data transmission of complex medical images during emergency monitoring. Comparisons with traditional protocols like LEACH reveal the superior performance of PEGASIS in terms of energy consumption and network stability.

![5217
ISSN: 2347-1697
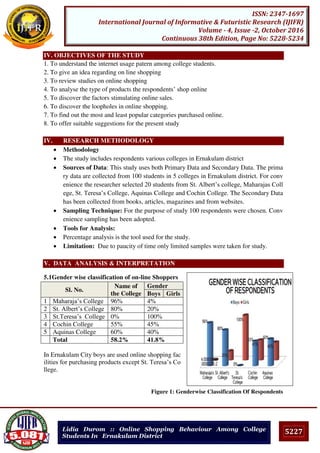
International Journal of Informative & Futuristic Research (IJIFR)
Volume - 4, Issue -2, October 2016
Continuous 38th Edition, Page No: 5216-5222
R. Saranya, S. Uma :: Handling Large Medical Images With
Compressive Sensing And PEGASIS Protocol For Energy
Optimization
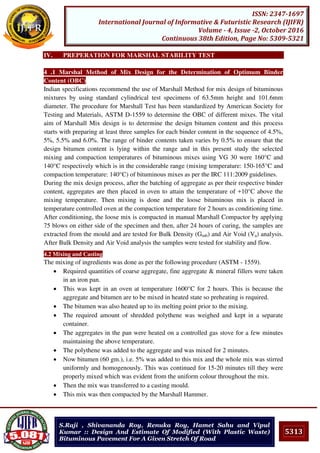
instantly from remote locations. For this remote monitoring of patients to happen real time
the entire network requires uninterrupted data exchange that are complex data objects in
terms of text, images and videos that needs to be exchanged across the network efficiently.
One such area in WBAN is the long-term and ubiquitous real-time ECG monitoring that is
becoming increasingly popular [1]. Though these areas have started gaining momentum,
such systems face a large number of constraints, such as limited memory, limited energy,
and limited computation and communication capabilities. In WBAN energy requirement is
necessary for sensing, wireless communication and data processing. The actual limitation of
this body area network is the cost to wirelessly transmit data which is on the higher side and
demands some data reduction strategy at the sensor node. Compressed sensing (CS) is one
suitable approach to lower energy consumption and complexity in WBAN. Their results
show that CS outperforms state-of-the-art wavelet transform-based compression methods in
terms of energy efficiency. This paper discusses on employing combination of compressed
sensing and energy efficient PEGASIS protocol for efficient data handling in WBAN.
II. WBAN AND ITS LIMITATIONS
Wireless body area networks (WBANs) are a subset of Wireless Sensor Networks and
provide support for telemedicine or remote healthcare monitoring. WBANs are biomedical
carriers capable of carrying biomedical data to facilitate early diagnosis and treatment in a
continuous health monitoring system by using various biomedical wireless sensors used for
the human body. A remote data center operates in co-ordination with these sensors to
process the bio-medical signals through cellular network. Some of the major limitations
posed by this WBAN are its power consumption and sampling rate. Compressed sensing
(CS) is a signal acquisition/compression methodology which gives an alternative to
traditional signal acquisition along with PEGASIS protocol for improving on the factor of
minimizing energy utilization.
III. COMPRESSIVE SENSING
The traditional method of reconstructing images from the measured data follows Shannon
sampling theorem. The sampling rate must be twice as that of the highest frequency [2].
Similarly, the fundamental theorem of linear algebra suggests that the number of collected
measurements or samples of a discrete finite-dimensional signal should be at least as large
as its dimension for reconstruction. This underlying principle was followed to most of the
recent technology such as medical imaging, analog to digital conversion, audio and video.
Compressive sampling or Compressive sensing or parse recovery provides a new approach
to data acquisition that overcomes this common thinking. Compressive sensing is a new
type of sampling theory which predicts certain signals or images which can be recovered
from what was previously believed to be highly incomplete information.
Algorithms such as ℓ1-minimization can be used for recovery. Compressive sensing has
many potential applications in signal processing and imaging. Compressive sensing is a
new framework for sensor design and signal acquisition [3]. It also performs sensing with](https://image.slidesharecdn.com/ijifrsection2october2016-161107013634/85/IJIFR-VOLUME-4-ISSUE-2-SECTION-2-OCTOBER-2016-2-320.jpg)
![5218
ISSN: 2347-1697
International Journal of Informative & Futuristic Research (IJIFR)
Volume - 4, Issue -2, October 2016
Continuous 38th Edition, Page No: 5216-5222
R. Saranya, S. Uma :: Handling Large Medical Images With
Compressive Sensing And PEGASIS Protocol For Energy
Optimization
image compression thereby helps in image size reduction with improved quality.
The major advantage of Compressive Sensing is that it enables a large reduction in the
computation costs and sampling for sensing signals which has a compressible
representation. Nyquist Shannon sampling theorem states that in order to capture an
arbitrary band limited signal, certain minimum number of samples are required. Using
compressive sensing it is possible to gradually reduce the number of samplings to be stored,
when the signal is sparse in a known basis. In other words using compressive sensing one
can recover certain images and signals from fewer measurements or samples using
traditional methods. Compressive Sensing relies on two principles sparsity that pertains to
the signals of interest and incoherence that pertains to the sensing modality.
Sparsity provides the idea that in the continuous time signal, information rate may be much
smaller than its bandwidth, or that a discrete-time signal depends on a number of degrees of
freedom that is comparably much smaller than its finite length. Incoherence expresses the
idea that the objects having a sparse representation must be spread out in the domain they
are acquired and extends the duality between time and frequency [4]. In recent years,
compressed sensing has been widely used in the areas of computer science, applied
mathematics, and electrical engineering.
IV. ENERGY EFFICIENT ALGORITHM
Energy conservation has become a major concern that needs to be addressed by many
sectors over the world. There are many Federal programs that provide incentives to save
energy and promote the use of renewable energy resources. There is a high time demand
from Individuals, companies, and organizations seeking energy efficient products as the
energy cost to run equipment has grown to be a major factor that overruns the total setup
cost. Energy consumption is very critical to all electronic gadgets in terms of both cost and
availability. Electricity costs impose a substantial strain on the budget of data and
computing centers. Google engineers, maintaining thousands of servers, warned that if
power consumption continues to grow, power costs can easily overtake hardware costs by a
large margin. Energy has become a leading design constraint for computing and digital
devices. Hardware engineers and system designers explore new directions to reduce the
energy consumption of their products. Energy efficiency is one of the easiest and most cost
effective ways to combat climate change clean the air we breathe, improve the
competitiveness of our businesses and reduce energy costs for consumers. The Department
of Energy is working with universities, businesses and the National Labs to develop new,
energy-efficient technologies while boosting the efficiency of current technologies on the
market [5].
V. IMPORTANCE OF ENERGY OPTIMIZATION IN WBAN
WBAN consist of miniature sensors that are able to sense and communicate with other
devices. These wireless sensors will be in the form of wearables like rings and watches.
These wireless sensors will detect changes in human body and passes information to the](https://image.slidesharecdn.com/ijifrsection2october2016-161107013634/85/IJIFR-VOLUME-4-ISSUE-2-SECTION-2-OCTOBER-2016-3-320.jpg)
![5219
ISSN: 2347-1697
International Journal of Informative & Futuristic Research (IJIFR)
Volume - 4, Issue -2, October 2016
Continuous 38th Edition, Page No: 5216-5222
R. Saranya, S. Uma :: Handling Large Medical Images With
Compressive Sensing And PEGASIS Protocol For Energy
Optimization
measuring device. These measurements can be displayed in the monitor as like scanning
machine and even this reading can be transmitted to a mobile app with the help of Bluetooth
and the patient with high risk can be monitored frequently and the results can be stored in
other device for future references. When more devices are involved in WBAN, there should
not be any interruption between the communications of nodes. To avoid interruption and
network traffic, energy saving of the resources is must.
VI. PEGASIS PROTOCOL
Power-Efficient Gathering in Sensor Information Systems (PEGASIS) is a clustering and chaining
protocol that is focused around the chain structure formation for efficient data exchange. Each node
communicates only with a close neighboring node and takes turns by transmitting to the base station,
thus the amount of energy spent per round get reduced. The main aim of this protocol is to extend
the lifetime of a network by achieving a high level of energy efficiency and uniform consumption of
energy across all network nodes. PEGASIS reduce the delay that data incur on their way to the sink.
The PEGASIS protocol achieves about 90-100% to improvement when compared to the LEACH
protocol [6].
6.1 Working of PEGASIS Protocol
PEGASIS, convention is focused around the chain structure. Chain is a collection of nodes
belonging to a cluster and each chain can have one and only group head. The group head
takes the complete control of nodes in the chain through accepting and sending messages
between nodes that fit in with the chain. The bunch head devour expansive vitality as the
chain keeps expanding. In PEGASIS, information exchange takes place with the nearest
neighbor policy thereby transmission across the chain to base station is taken care by the
group head thereby spare the battery for WSN and expanding the lifetime of the system [7].
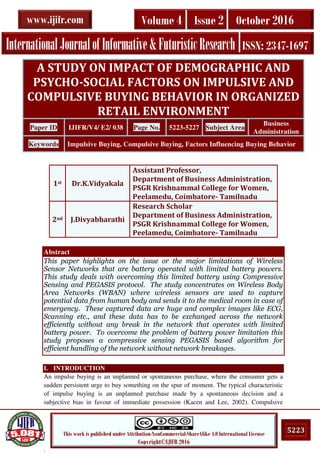
6.2 Application Of Pegasis Protocol With Compressive Sensing
Figure1. Application of PEGASIS Protocol with Compressive Sensing
6.2.1 WBAN
WBAN is the Wireless Body Area Network. In today’s technological world with technology
developments on the verge and technological gadgets thronging the market, health issues
and concerns have become a greater mystique. In such a prevailing situation it is necessary](https://image.slidesharecdn.com/ijifrsection2october2016-161107013634/85/IJIFR-VOLUME-4-ISSUE-2-SECTION-2-OCTOBER-2016-4-320.jpg)
![5221
ISSN: 2347-1697
International Journal of Informative & Futuristic Research (IJIFR)
Volume - 4, Issue -2, October 2016
Continuous 38th Edition, Page No: 5216-5222
R. Saranya, S. Uma :: Handling Large Medical Images With
Compressive Sensing And PEGASIS Protocol For Energy
Optimization
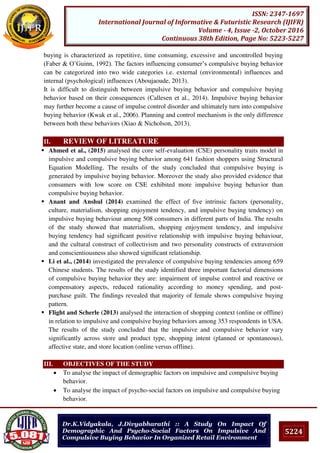
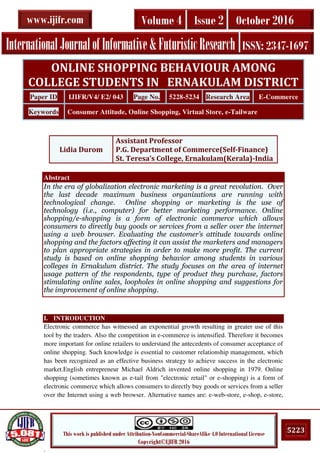
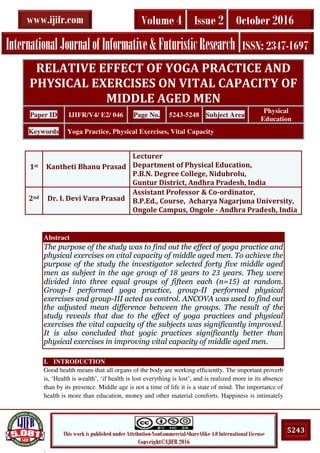
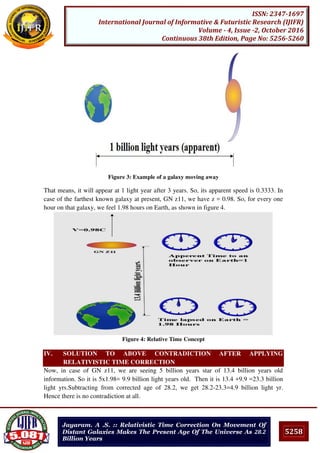
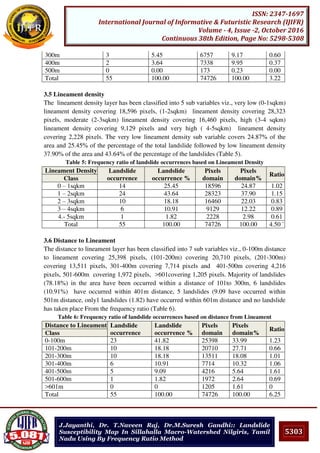
Figure 3: Stability and Lifetime in large networks of LEACH, PEGASIS
As shown in the Fig. 3 PEGASIS achieves around 2x the number of rounds compared to LEACH at
all values of number of nodes deployed in the network. This shows that as compared to LEACH,
PEGASIS offers better stability and lifetime in large networks.
VIII. CONCLUSION
This paper makes a detailed study on the WBAN architecture and the implementation of
compressive sensing and PEGAIS protocol for enhanced data delivery with the available battery
power. The paper also makes a comparative study of LEACH and PEGASIS protocol and the study
proves that the PEGASIS protocol performs better in handling energy factor and sets the network
work for longer hours without any network failure. In future this work can be extended to
implement the model of WBAN with compressive sensing and PEGASIS protocol.
IX. REFERENCES
[1] Cao. H. Leung. V, Chow. C, and Chan. H. (2009, Dec). Enabling Technologies for Wireless
Body Area Networks: A Survey and Outlook. IEEE Communication Magazine. [Online].
47(12), 84-93. “Home page” http://dl.acm.org/citation.cfm?id=2294013
[2] M. Unser. (2000). Sampling—50 Years after Shannon. Proceedings of IEEE. [Online].
88(4), 569-587. “Home page”, http://bigwww.epfl.ch/publications/unser0001.pdf
[3] Massimo Fornasier and Holger Rauhut. (2010, Apr).Compressive Sensing. [Online]. “Home
page”, www.math.umu.se/digitalAssets/115/115905_csfornasierrauhut.pdf
[4] Emmanuel J. Candès and Michael B. Wakin. (2008, Mar). An Introduction To Compressive
Sampling. IEEE Signal Processing Magazine. [Online]. “Home page”,
http://pami.uwaterloo.ca/~basir/ECE750/p9.pdf
[5] Susanne Albers. (2010, May). Energy Efficient Algorithms. Communications of the ACM.
[Online]. 53(5), “Home page”, http://cacm.acm.org/magazines/2010/5/87271-energy-
efficient-algorithms/fulltext
[6] Daniel Benedict Ndawi. (2015, Oct). Improved Pegasis Protocol for Energy Efficient
Wireless Sensor Network by Ant Colony Optimization. International Journal and Magazine
LEACH PEGASIS
Number of Rounds
Nodedeathrates](https://image.slidesharecdn.com/ijifrsection2october2016-161107013634/85/IJIFR-VOLUME-4-ISSUE-2-SECTION-2-OCTOBER-2016-6-320.jpg)
![5222
ISSN: 2347-1697
International Journal of Informative & Futuristic Research (IJIFR)
Volume - 4, Issue -2, October 2016
Continuous 38th Edition, Page No: 5216-5222
R. Saranya, S. Uma :: Handling Large Medical Images With
Compressive Sensing And PEGASIS Protocol For Energy
Optimization
of Technology. [Online]. “Home page”
http://www.ijmetmr.com/oloctober2015/DanielBenedictNdawi-A-28.pdf
[7] Stephanie Lindsey and Cauligi S. Raghavendra. PEGASIS: Power-Efficient Gathering in
Sensor Information Systems. [Online]. , “Home page”,
http://ceng.usc.edu/~raghu/pegasisrev.pdf
X. AUTHOR’S BIOGRAPHIES
1
R.Saranya received master’s degree in Computer Science from
Bharathiar University, Coimbatore in 2013 and doing Part Time M.Phil
Computer Science in, C.M.S. College of Science & Commerce
(Autonomous), Coimbatore, Tamil Nadu. She is working as a Teacher
in Cambridge Matric Hr.Sec School. Her research interests are Image
Processing.
2
S.Uma received master’s degree in Information Technology from
Bharathidasan University, Trichy in 2004 and M.Phil degree in
Computer Science from Bharathidasan University, Trichy in 2007. She is
currently an Assistant Professor in Department of Information
Technology, C.M.S.College of Science & Commerce (Autonomous),
Coimbatore, Tamil Nadu. Her research interests are Data Mining and
Image Processing.
To Cite This Paper
[1]
[2]
Saranya, R. , Uma, S. (2016): “Handling Large Medical Images With Compressive
Sensing And PEGASIS Protocol For Energy Optimization” International Journal of
Informative & Futuristic Research ( ISSN: 2347-1697 ), Vol. 4 No. (2), October 2016, pp.
5216-5222, Paper ID: IJIFR/V4/E2/036.](https://image.slidesharecdn.com/ijifrsection2october2016-161107013634/85/IJIFR-VOLUME-4-ISSUE-2-SECTION-2-OCTOBER-2016-7-320.jpg)
![5227
ISSN: 2347-1697
International Journal of Informative & Futuristic Research (IJIFR)
Volume - 4, Issue -2, October 2016
Continuous 38th Edition, Page No: 5223-5227
Dr.K.Vidyakala, J.Divyabharathi :: A Study On Impact Of
Demographic And Psycho-Social Factors On Impulsive And
Compulsive Buying Behavior In Organized Retail Environment
VIII. REFERENCES
[1] Anant Jyoti Badgaiyana,n, Anshul Vermab,(2014) “Intrinsic factors affecting impulsive
buying behaviour—Evidence from India”, Journal of Retailing and Consumer Services, Vol.
21, Pp.537-549.
[2] Moin Ahmed Moon , Hassan Rasool, Saman Attiq (2015) “Personality and Irregular Buying
Behavior: Adaptation and Validation of Core Self Evaluation Personality Trait Model in
Consumer Impulsive and Compulsive Buying Behavior”, Journal of Marketing and
Consumer Research,Vol.15 Pp.121-131.
[3] Shuang Li, Alexander Unger, Chongzeng Bi (2014), “Different facets of compulsive buying
among Chinese students”, J Behav Addict, Vol.3 Iss.4, Pp.238–245.
[4] Richard L. Flight, Jarrod Scherle (2013) “Shopping Context and the Impulsive and
Compulsive Buyer”, Atlantic Marketing Journal, Vol. 2: Iss. 2, Pp.54-69.
[5] Callesen, M. B., Weintraub, D., Damholdt, M. F., & Møller, A. (2014). “Impulsive and
compulsive behaviors among Danish patients with Parkinson's disease: Prevalence,
depression, and personality. Parkinsonism & related disorders”,Vol. 20, Iss.1, Pp. 22-26.
[6] Defty, M., Xiao, S. H. & Iyer, G. (2013, May), The Influence of Buyer Attitudes on the
Organization’s Green Buying Paper presented at 2013 Academy of Marketing Science
Annual Conference, Monterey Bay, California.US
To Cite This Paper
[1]
[2]
Vidyakala, K., Divyabharathi, J. (2016): “A Study On Impact Of Demographic And
Psycho-Social Factors On Impulsive And Compulsive Buying Behavior In Organized
Retail Environment” International Journal of Informative & Futuristic Research
(ISSN: 2347-1697 ), Vol. 4 No. (2), October 2016, pp. 5223-5227, Paper ID:
IJIFR/V4/E2/038.](https://image.slidesharecdn.com/ijifrsection2october2016-161107013634/85/IJIFR-VOLUME-4-ISSUE-2-SECTION-2-OCTOBER-2016-12-320.jpg)
![5233
ISSN: 2347-1697
International Journal of Informative & Futuristic Research (IJIFR)
Volume - 4, Issue -2, October 2016
Continuous 38th Edition, Page No: 5228-5234
Lidia Durom :: Online Shopping Behaviour Among College
Students In Ernakulam District
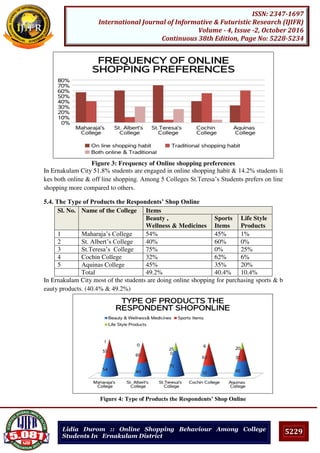
8) The ease and convenience provided by these stores for 24x7 has made very easy
shopping for consumers.
VII. SUGGESTIONS
1. The online shoppers secure their PC from viruses and other attacks by using a good anti-
malware program.
2. Online shoppers indicate that they would not even buy electronics without consulting
online reviews first.
3. The e-stores specifically mention about the security of transactions of their e-stores
which will increase the faith of customers for online shopping
4. Government should play a pivotal role in encouraging online shopping.
5. Online retailers should focus on better home page presentation to appeal the prospects
and sustain the existing buyers.
6. Use credit card instead of debit card for online purchases.
7. E-marketers must give a thought to secure, time saving, information about product and
services factors when they design their product strategy.
8. Payment through PayPal account
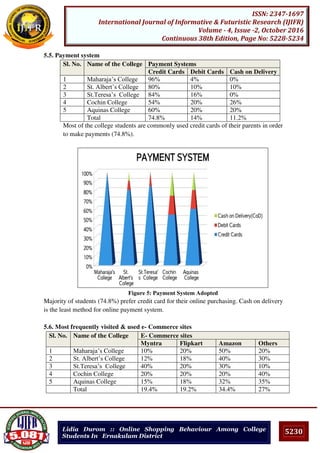
VIII. CONCLUSION
Online shopping is becoming more popular day by day with the increase in the usage of Wo
rld Wide Web known as www. Understanding customer’s need for online selling has becom
e challenge for marketers. .The e-commerce market has a great potential for youth segment.
If the demographic features are considered carefully then it can be easily identified that max
imum number of respondents of online shopping are lying in age group of 18- 25 years. Spe
cially understanding the consumer’s attitudes towards online shopping , making improveme
nt in the factors that influence consumers to shop online and working on factors that affect c
onsumers to shop online will help marketers to gain the competitive edge over others. The b
uying behaviour of youth can be elaborated through findings obtained through survey. By fo
cussing on various factors identified in this study, the corporate can make their marketing str
ategies in better way.
IX. REFERENCES
[1] Renuka Sharma, Mehta ad Shashanka (2014), “understanding online shopping behaviour of
Indian shoppers”, international journal of management and business studies, CVol.4, pp.9-
17
[2] M.M. Goyal (2014), “online shopping: a survey on consumers perception”, the international
journal of business and management, Vol .2(11), 73-79
[3] Devika Veeralakshmi (2013), “A study on online shopping behaviour of customers”,
International journal of scientific research and management, pp-28-32
[4] Anju Pawar and Neha chahal (2013), “Online shopping trends in Faridabad city”, Asia
pacific journal of marketing and management review, Vol.2 (3),pp-111-116
[5] Nazir, Tayyab and Javed (2012), “How online shopping is affecting consumers buying
behaviour in Pakistan”, International journal of computer science issues, Vol 9(3),pp-486-
495](https://image.slidesharecdn.com/ijifrsection2october2016-161107013634/85/IJIFR-VOLUME-4-ISSUE-2-SECTION-2-OCTOBER-2016-23-320.jpg)
![5234
ISSN: 2347-1697
International Journal of Informative & Futuristic Research (IJIFR)
Volume - 4, Issue -2, October 2016
Continuous 38th Edition, Page No: 5228-5234
Lidia Durom :: Online Shopping Behaviour Among College
Students In Ernakulam District
[6] Shergill and Zhabin chen ( 2005), “Web based shopping: consumers attitude towards online
shopping in New Zealand”, Journal of electronic commerce research vol-6 No.2, pp-79-94
[7] Payal Upadhay and Jasvinder Kaur, “Analysis of online shopping behaviour of customers in
Kota city”, International journal of multidisciplinary and academic research, Vol.2, No.1 pp-
1-28
To Cite This Paper
[1]
[2]
Durom, L.(2016): “Online Shopping Behaviour Among College Students In
Ernakulam District” International Journal of Informative & Futuristic Research
(ISSN: 2347-1697 ), Vol. 4 No. (2), October 2016, pp. 5228-5234, Paper ID:
IJIFR/V4/E2/043.](https://image.slidesharecdn.com/ijifrsection2october2016-161107013634/85/IJIFR-VOLUME-4-ISSUE-2-SECTION-2-OCTOBER-2016-24-320.jpg)
![5242
ISSN: 2347-1697
International Journal of Informative & Futuristic Research (IJIFR)
Volume - 4, Issue -2, October 2016
Continuous 38th Edition, Page No: 5235-5242
Thokchom Vidyarani Devi :: Socio-Economic Status And Exposure
To Radio In Rural Area Of Manipur
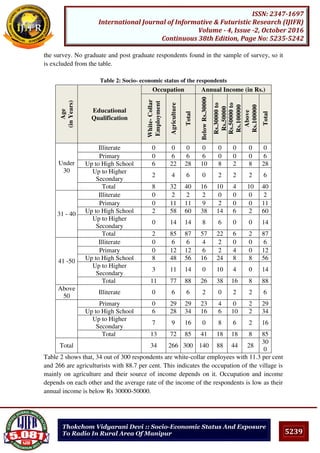
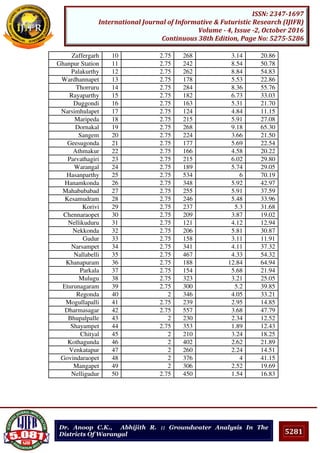
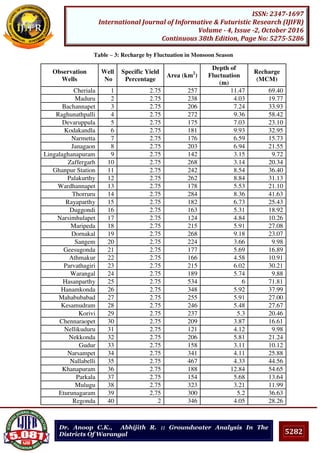
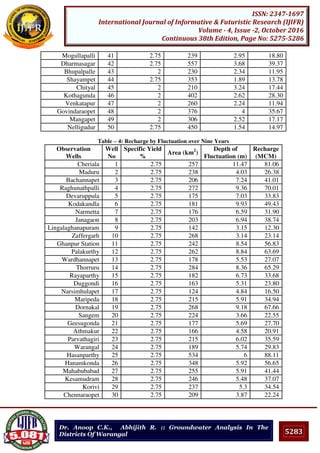
Table 7 shows the association between the monthly savings and exposure to the radio. Respondents
who have more monthly savings have greater exposure to the medium.
6. CONCLUSION
Exposure to the media is found to increase with increase in educational attainment. It is found that
radio which is not barred to the illiterates section, but the educated are more exposed to it.
Occupation and exposure to the media are also related factors. The agriculturists have expose to the
medium very highly. The agriculturists can adjust their work according to the broadcast time of the
radio. Also the white-collar employees also have high exposure.The income and exposure to the
mass media is also related factor. Since income is found to influence many of the human behaviours.
Increase in mass media exposure of the respondents is very consistent with their increase in income
status. But, radio is the cheapest medium; the analysis also revealed that all income groups have
greater exposure to it. Monthly savings is also another factor which influences the exposure to the
mass media. Radio have greater exposed to the higher monthly savings group.Thus, the study
revealed that the socio-economic status is highly positively associated with exposure to the radio.
7. REFERENES
1. All India Radio, Imphal (2011), Radio Audience Survey
2. Choudhury, Payel Sen (2011), Media in Development Communication, Global Media Journal-
India Edition/ ISSN 2249-5835.
3. Dube, S.C. (1967), “A note on Communication in Economic Development”, in Lerner, Daniel
and Schramm, Wilbur, (eds.), Communication and Change in Developing Countries, East-West
Centre Press, Honolulu.
4. Joseph, Joni C, Mass Media and Rural Development, Published by Rawat Publication , 1997.
5. Khan, Nawaz (2012), Radio and Social Change: Patterns of Radio Listening and Socio-Cultural
Change in Rural Areas of Manipur, Thesis.
6. Kothari, C.R (2009), Research Methodology, New age International Publishers, New Delhi.
7. Kumar, Keval J (1994), Mass Communication in India, Fourth Updated Edition, Published by
JAICO Publishing House.
8. Manipal University, Media and Development, Published by Sikkim Manipal University, 2006
9. Pandey, G.P, and Arun Kumar Singh (2000), Communication and Social Transformation; New
Delhi, Manak Publication
10. Raghavan, G.N.S. (1980), “Do Media Reach the Masses: The Indian Experience”,
Communicator, Vol. 15, No. 3.
11. Rao, Lakshmana, Y.V. (1966), Communication and Development, University of Minesota Press.
12. S, Ganesh (1995), Lectures on Mass communication, Published by Indian Publishers
Distributors
13. Wimmer, D Roger and Dominick, R Joseph (2002), Mass Media Research, Sage Publication.
14. Yadava, J.S. (1979), “Communication Strategy and the Challenge of Rural Development”,
Communicator, Vol. 14, No. 2.
To Cite This Paper
[1]
[2]
Devi, V.T. (2016): “Socio-Economic Status and Exposure to Radio in Rural Area of
Manipur” International Journal of Informative & Futuristic Research (ISSN: 2347-
1697), Vol. 4 No. (2), October 2016, pp. 5235-5242, Paper ID: IJIFR/V4/E2/044.](https://image.slidesharecdn.com/ijifrsection2october2016-161107013634/85/IJIFR-VOLUME-4-ISSUE-2-SECTION-2-OCTOBER-2016-32-320.jpg)
![5247
ISSN: 2347-1697
International Journal of Informative & Futuristic Research (IJIFR)
Volume - 4, Issue -2, October 2016
Continuous 38th Edition, Page No: 5243-5248
Kantheti Bhanu Prasad, Dr. I. Devi Vara Prasad:: Relative Effect
Of Yoga Practice And Physical Exercises On Vital Capacity Of
Middle Aged Men
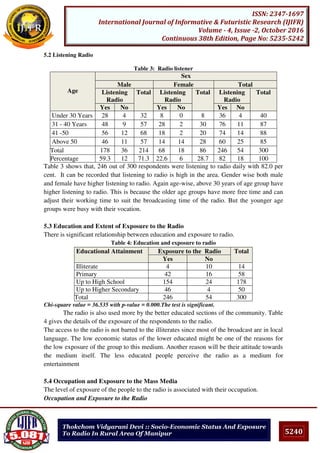
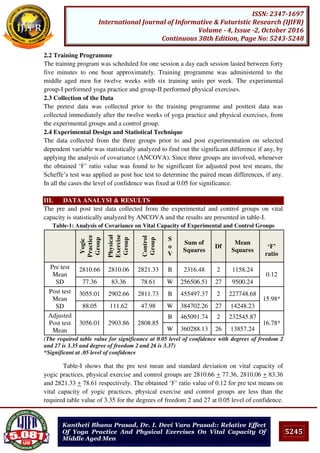
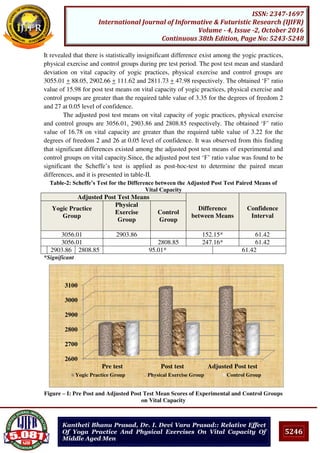
Table-II shows that there was significant difference existed between yogic practices
and physical exercise groups, yogic practices and control groups, physical exercise and
control groups on vital capacity. Since, the mean differences 152.15, 247.16 and 95.01 are
higher than the confidence interval value of 61.42; it reveals that both experimental groups
had significantly improved the vital capacity. However, yogic practices were significantly
better than physical exercise in altering the vital capacity.The pre, post and adjusted post
test mean values on vital capacity of the experimental and control groups is graphically
represented in figure- I for better understanding.
IV. DISCUSSION
Yoga helps to tone up the entire body to regularize blood compositions and improve
blood circulations, tones up glands and visceral muscles. Robson states that “yoga develops
flexibility and vital capacity”. Regular practice of yoga helps to keep our body fit, controls
cholesterol level, reduces weight, normalizes blood pressure and improves heart
performances. Further, preliminary studies in the United States and India suggest that yoga
may be helpful for specific conditions, such as asthma, epilepsy, anxiety, stress and others.
Regular exercise results in an increase in the blood flow and improves oxygen carrying and
waste removal capacity and further increases work load capacity (Vitale, 1973). Exercise
increases the volume of hemoglobin and erythrocyte of the blood. Also blood vessels are
seen to maintain elasticity and suppleness when stressed systematically probably by the
beneficial effect of the heart. Yogic practices demonstrated a significant difference in heart
rate, with breathing practices and asanas lowering heart rate significantly so yogic practices
into a lower-impact workout may be beneficial. Chaya et al., (2008) reported that long-term
practice of yogic asanas along with pranayama and meditation causes reduced sympathetic
activity resulting in reduced metabolic rate and greater metabolic efficiency in yoga
practitioners. Hagins et al., (2007) suggested that yoga is a mind-body practice where
practice of physical postures is combined with control of breathing, meditation along with
stretching exercise, isometric exercise, and dynamic exercises of skeletal muscles. Raub
(2002) find that Practice of hatha yoga may help control such physiological variables as
blood pressure, respiration, HR and metabolic rate to improve overall exercise capacity.
V. CONCLUSION
The result of the study reveals that due to the effect of yoga practice and physical exercises
the vital capacity of the subjects was significantly improved. It is also concluded that yogic
practices significantly better than physical exercises in improving vital capacity of middle
aged men.
VI. REFERENCES
[1] Brandon, Raphael. (2011). Peak Performance, www.google.co.in.
[2] Chaya MS, Nagendra HR. (2008). Long-term effect of yogic practices on diurnal metabolic rates
of healthy subjects. Int J Yoga. 1:27–32.
[3] Cope Haley, (Jan 2011), www.google.co.in.](https://image.slidesharecdn.com/ijifrsection2october2016-161107013634/85/IJIFR-VOLUME-4-ISSUE-2-SECTION-2-OCTOBER-2016-37-320.jpg)
![5248
ISSN: 2347-1697
International Journal of Informative & Futuristic Research (IJIFR)
Volume - 4, Issue -2, October 2016
Continuous 38th Edition, Page No: 5243-5248
Kantheti Bhanu Prasad, Dr. I. Devi Vara Prasad:: Relative Effect
Of Yoga Practice And Physical Exercises On Vital Capacity Of
Middle Aged Men
[4] Cowen VS. and Adams, TB., (2007). “Heart rate in yoga asana practice: a comparison of styles”,
Journal of Body Work and movement Therapies, 11(1), pp.91-95.
[5] Cowen, Virginia S. and Adams, Troy B., (2005), “Physical and perceptual benefits of yoga
asana practice: Results of a Pilot Study”, Journal of Body Work and Movement Therapies, 9(3),
pp. 211-219.
[6] Dev, AB., (1999). Yoga for Better Health, New Delhi: Diamond Pocket Books – Publishers, 10.
[7] Hagins M, Moore W, Rundle A. (2007). Does practicing hatha yoga satisfy recommendations
for intensity of physical activity which improves and maintains health and cardiovascular
fitness? BMC Complement Altern Med. 7:40.
[8] Harinath K, Malhotra AS, Pal K, Prasad R, Kumar R, Kain TC, et al. (2004). Effects of hatha
yoga and omkar meditation on cardiorespiratory performance, psychologic profile, and
melatonin secretion. J Altern Complement Med. ;10:261–8.
[9] Raub JA. (2002). Psychophysiologic effects of Hatha Yoga on musculoskeletal and
cardiopulmonary function: A literature review. J Altern Complement Med. 8:797–812.
[10] Sasi AK, Sivapriya DV, Thirumeni S. (2011). Effects of surya namaskar on cardiovascular and
respiratory parameters in school students. Recent Res Sci Tech. 3:19–24.
[11] Vitale, Frank, (1973). Individualized Fitness Programs. Englewood Cliffs, New Jersey Prentice
Hall Inc., p.9. 144.
To Cite This Paper
[1]Prasad,B.K.,VaraPrasad,D.I. (2016): “Relative Effect Of Yoga Practice And Physical
Exercises On Vital Capacity Of Middle Aged Men” International Journal of
Informative & Futuristic Research (ISSN: 2347-1697), Vol. 4 No. (2), October 2016,
pp. 5243-5248, Paper ID: IJIFR/V4/E2/046.](https://image.slidesharecdn.com/ijifrsection2october2016-161107013634/85/IJIFR-VOLUME-4-ISSUE-2-SECTION-2-OCTOBER-2016-38-320.jpg)
![5254
ISSN: 2347-1697
International Journal of Informative & Futuristic Research (IJIFR)
Volume - 4, Issue -2, October 2016
Continuous 38th Edition, Page No: 5249-5255
S. Arun, V.S. Shinu :: A New Green Synthetic Protocol For The
Synthesis Of N-Substituted Beta Amino Ketone Derivatives Using
Ammonium Fluoride As Catalyst
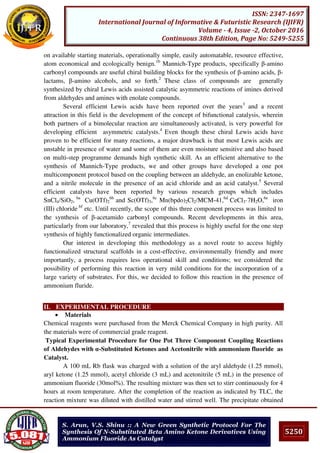
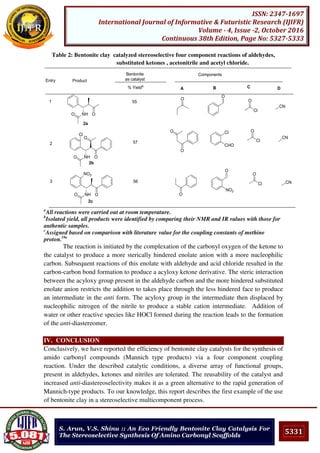
The suggested Mechanism of the reaction is shown in Scheme 1. The reaction is initiated by
the co-ordination of the carbonyl oxygen of the ketone moiety with catalyst. Ammonium
fluoride acts as a Lewis acid and thus activates the enol 3 formation. The addition of
aldehyde moiety 4 followed by acid chloride to this complex resulted in the carbon-carbon
bond formation to produce a β-acyloxy ketone derivative 5. The acyloxy group in 5 is then
displaced by the more nucleophilic nitrogen of the nitrile to produce a stable cation
intermediate 7. Addition of water leads to the formation of the β-amino ketone derivative 8.
IV. CONCLUSION
In summary, we have reported the efficiency of ammonium fluoride catalyst for the
synthesis of β-amino ketone derivatives via four-component coupling reaction. The study
reveals that the catalyst is more efficient in catalyzing the reaction. The method offers
several advantages such as high yields, short reaction times, mild reaction conditions,
simple experimental procedures, cost effectiveness and tolerance to a wide variety of
reactants. The catalysts used are also environmentally friendly, inexpensive and highly
efficient.
V. REFERENCES
[1] J. Zhu, H. Bienayme (Eds.); Wiley-VCH: Weinheime, 2005.(b) Rothenberg, G. Wiley-VCH,
Verlag GmbH & Co. KGa: Weinheim, 2008.
[2] (a) Josephsohn, N. S.; Snapper, M. L.; Hoveyda, A. H. J. Am. Chem. Soc. 2004, 126, 3734-3735
.(b)Kobayashi, S.; Ishitani, H. Chem. Rev. 1999, 99, 1069-1094; (c) Cordova, A Acc. Chem.
Res. 2004, 37, 102-112. (c) R. Robinson,J. Chem. Soc. 1917, 111
[3] (a) D. Schinzer (Ed.); Kluwer Academic Publishers: Dordrecht, The Netherlands, 1989; (b) ;
Wiley-VHC: Weinheim, Germany, 2000; (c) Kobayashi, S.; Salter, M. M.; Yamazaki, Y.;
Yamashita, Y. . Chem. Asian J. 2010, 5, 493-495; (d) Poisson, T.; Tsubogo, T.; Yamashita, Y.;
Kobayashi, S. Org. Chem. 2010, 75, 963-965; (e) Matsubara, R.; Berthiol, F.; Nguyen, H. V.;
Kobayashi, S. . Chem. Soc. Jpn. 2009, 82, 1083-1102; (f) Ishitani, H.; Ueno, M.; Kobayashi, S.
.J Am. Chem. Soc. 2000, 122, 8180-8186; (g) Ishitani, H.; Ueno, M.; Kobayashi, S. J. Am.
Chem. Soc. 1997, 119, 7153-7154; (h) Wenzel, A. G.; Jacobsen, E. N. J. Am. Chem. Soc. 2002,
124, 12964-12965; (i) Kobayashi, S.; Ueno, M. In Comprehensive Asymmetric Catalysis,
Supplement I; E. N. Jacobsen, A. Pfalz, H. Yamamoto (Eds.); Springer: Berlin, 2003; Chapter
29.5
[4] For recent reviews see: (a) Shibasaki, M.; Kanai, M.; Matsunaga, S.; Kumagai, N. Acc. Chem.
Res. 2009, 42, 1117-1127; (b) Kanai, M.; Kato, N.; Ichikawa, E.; Shibasaki, M. Synlett 2005,
1491–1508; (c) Shibasaki, M.; Matsunaga, S. Chem. Soc. Rev. 2006, 35, 269–279. (d)
Shibasaki, M.; Kanai, M. Org. Biomol. Chem. 2007, 5, 2027–2039; (e) Matsunaga, S.;
Shibasaki, M. Bull. Chem. Soc. Jpn. 2008, 81, 60–75; (f) Shibasaki, M.; Matsunaga, M.;
Kumagai, N. Synlett. 2008, 1583–1602; (g) Yamamoto, H.; Futatsugi, K. Angew. Chem., Int.
Ed. 2005, 44, 1924–1942; (h) Ma, J.; Cahard, D. Angew. Chem., Int. Ed. 2004, 43, 4566–4583;
(i) Taylor, M. S.; Jacobsen, E. N. Angew. Chem., Int. Ed. 2006, 45, 1520–1543
[5] (a) Rao, I. N.; Prabhakaran, E. N.; Das, S. K.; Iqbal, J. J. Org. Chem. 2003, 68, 4079–4082; (b)
Maghsoodlou, M. T.; Hassankhani, A.; Shaterian, H. R.; Habibi-Khorasani, S. M.; Mosaddegh,
E. Tetrahedron Lett. 2007, 48, 1729-1734; (c) Khodaei, M. M.; Khosropour, A.R.; Fattahpour,
P. Tetrahedron Lett. 2005, 46, 2105-2108.
[6] (a) Mirjalili, B. B. F.; Hashemi, M. M.; Sadeghi, B.; Emtiazi, H. J. Chinese Chem. Soc. 2009,
56, 386-391; (b) Pandey, G.; Singh, R. P.; Garg, A.; Singh, V. K. Tetrahedron Lett. 2005, 46,](https://image.slidesharecdn.com/ijifrsection2october2016-161107013634/85/IJIFR-VOLUME-4-ISSUE-2-SECTION-2-OCTOBER-2016-44-320.jpg)
![5255
ISSN: 2347-1697
International Journal of Informative & Futuristic Research (IJIFR)
Volume - 4, Issue -2, October 2016
Continuous 38th Edition, Page No: 5249-5255
S. Arun, V.S. Shinu :: A New Green Synthetic Protocol For The
Synthesis Of N-Substituted Beta Amino Ketone Derivatives Using
Ammonium Fluoride As Catalyst
2137-2140 ; (c) Heravi, M. M.; Daraie, M.; Behbahani, F. K.; Malakooti, R.. Synth. Commun.
2010, 40, 1180-1186 ; (d) Khan, A. T.; Choudhury, L. H.; Parvin, T.; Ali, M. D. A.
Tetrahedron Lett. 2006, 47, 8137-8141.
[7] (a) Bahulayan, D.; Das, S. K.; Iqbal, J. ; J. Org. Chem. 2003, 68, 5735-5738; (b) Shinu, V. S.;
Sheeja, B.; Purushothaman, E.; Bahulayan, D. Tetrahedron Lett. 2009, 50, 4838–4842; (c)
Shinu, V. S.; Pramitha, P.; Bahulayan, D. Tetrahedron Lett. 2011, 52, 3110–3115; (d)
Bahulayan, D.; Shinu, V. S.; Pramitha, P.; Arun, S.; Sheeja, B. Synth. Commun. 2012, 42, 1162–
1176
To Cite This Paper
[1]Arun,S., Shinu,V.S. (2016) : “A New Green Synthetic Protocol For The Synthesis Of N-
Substituted Beta Amino Ketone Derivatives Using Ammonium Fluoride As Catalyst”
International Journal of Informative & Futuristic Research (ISSN: 2347-1697), Vol. 4 No.
(2), October 2016, pp. 5249-5255, Paper ID: IJIFR/V4/E2/040.](https://image.slidesharecdn.com/ijifrsection2october2016-161107013634/85/IJIFR-VOLUME-4-ISSUE-2-SECTION-2-OCTOBER-2016-45-320.jpg)
![5260
ISSN: 2347-1697
International Journal of Informative & Futuristic Research (IJIFR)
Volume - 4, Issue -2, October 2016
Continuous 38th Edition, Page No: 5256-5260
Jayaram. A .S. :: Relativistic Time Correction On Movement Of
Distant Galaxies Makes The Present Age Of The Universe As 28.2
Billion Years
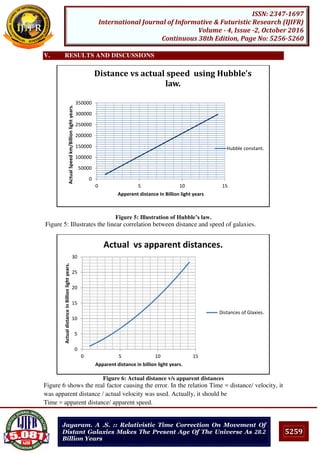
Figure 7: Actual speed and Apparent speed against apparent distances.
Figure 7 shows the degree of error between two speeds with respect to apparent distances of
galaxies.
VI. CONCLUSION
The maximum value of z=1, when v=c. So, if a galaxy at the edge of the observable
universe is moving at z=1, apparent speed= 0.5c as, the scale factor =1+z=2. That means in
travelling 14.1 billion light years of apparent distance, it must have taken 2x14.1=28.2
billion years. That means, actual age of the universe = twice the apparent age = 2/H0. This
result is obtained after applying relativistic time correction to the speed of galaxies.
VII. REFERENCES
[1] Hubble constant and the age the universe
http://www.astro.caltech.edu/~george/ay127/readings/FreedmanMadore2010.pdf
[2] variation with time http://physics.stackexchange.com/questions/18301/value-of-the-hubble-
parameter-over-time
[3] Wikipedia Hubble’s law https://en.wikipedia.org/wiki/Hubble%27s_law
[4] Constant over time https://briankoberlein.com/2016/09/13/the-constant-of-time/
[5] Local variation of Hubble constant https://arxiv.org/pdf/1407.7364.pdf
[6] Hubble time http://physics.stackexchange.com/questions/136056/how-does-the-hubble-
parameter-change-with-the-age-of-the-universe
[7] Quasar http://www.bigbangcentral.com/accel_page.html
[8] Fundamentals http://spiff.rit.edu/classes/phys301/lectures/age/age.html
[9] Hubble telescope http://www.forbes.com/sites/startswithabang/2016/10/14/hubbles-latest-
breakthrough-reveals-trillions-of-unknown-galaxies-in-the-universe/#52aef1ba4ddc
[10] GN-z11 Source: http://astronomy.as.virginia.edu/
To Cite This Paper
[1]
0
50000
100000
150000
200000
250000
300000
0 5 10 15
Speedinkm/second.
Apparent distance in Billion light years.
Actual
Speed
Apparent
Speed
Jayaram. A .S. (2016) : “Relativistic Time Correction On Movement Of Distant Galaxies
Makes The Present Age Of The Universe As 28.2 Billion Years” International Journal of
Informative & Futuristic Research (ISSN: 2347-1697), Vol. 4 No. (2), October 2016, pp.
5256-5260, Paper ID: IJIFR/V4/E2/048.](https://image.slidesharecdn.com/ijifrsection2october2016-161107013634/85/IJIFR-VOLUME-4-ISSUE-2-SECTION-2-OCTOBER-2016-50-320.jpg)
![5266
ISSN: 2347-1697
International Journal of Informative & Futuristic Research (IJIFR)
Volume - 4, Issue -2, October 2016
Continuous 38th Edition, Page No: 5261-5267
V. Venkata Rao :: A Study On Time Value Of Money
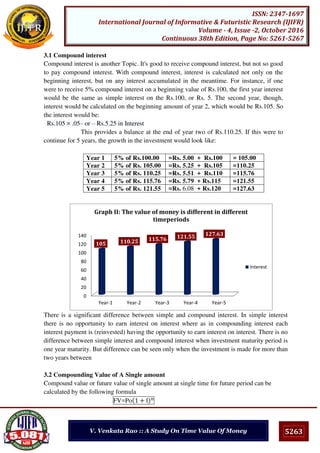
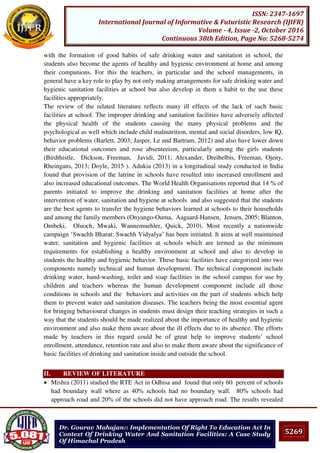
IV. DISCOUNTING TECHNIQUE
It is an important component of Time value of money it can be useful to know the present
value of future cash inflows. Present value is exact contrary to compound value. The process
of determining present value of future cash flows is called discounting. It is concerned with
determining the present value of future amount with that value investors will take decision
whether accept or reject of the investment proposal.
4.1. Present Value of Future Single amount:
It is one of the ingredients of discounting technique it can be useful to know Present
value of future single cash flow. Through the following formula we can calculate the
present value.
PV=FV / + I
Where
PV=Present Value, FV= Future value receivable at the end of ‘n’ years
I = Interest rate N = Duration of the cash flow
Example: 6
An Investor wants to know the Present value of Rs.20, 000, it will come after 3 years current
market interest rate is 10%
PV=20,000 / + .
= 20,000 (0.751)
=Rs. 15,020.
4.2 Present Value of a series of Cash flows
We have calculated present value of a single cash flow to be received in future date.
Not only that some cases we need to convert future series of cash inflows into present
values. This may be uneven cash inflows or even cash inflows.
4.2.1 Present Value of Even Cash inflows
In future if we will get even cash inflows annually up to certain future. Through the
following formula we can calculate the present value.
PV=CF [
+I n−
I +I n
]
Example: 7
Mr. Anand wants to invest his funds in a particular project, expected cash inflows from that
project Rs.50, 000 annually up to six years period and he wants to know the Present value of
future cash inflows. Current market interest rate is 10%
PV=CF [
+I n−
I +I n
]
= 50,000 [
+ . −
. + .
]
= 50,000 (4.355) = 2, 17,750
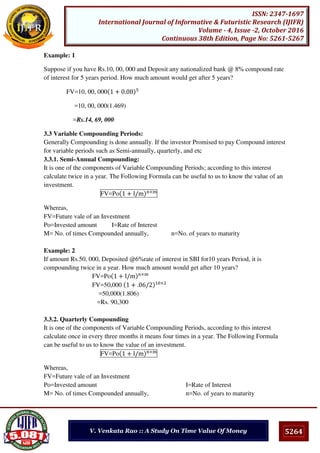
4.2.2 Present Value of uneven Cash inflows
In future if we will get uneven cash inflows annually up to certain future. Through
the following formula we can calculate the present value.](https://image.slidesharecdn.com/ijifrsection2october2016-161107013634/85/IJIFR-VOLUME-4-ISSUE-2-SECTION-2-OCTOBER-2016-56-320.jpg)
![5267
ISSN: 2347-1697
International Journal of Informative & Futuristic Research (IJIFR)
Volume - 4, Issue -2, October 2016
Continuous 38th Edition, Page No: 5261-5267
V. Venkata Rao :: A Study On Time Value Of Money
PV=
C
+I
+
C
+I
+
C
+I
+…….. +
C
+I n
Where
C1, C2, C3 and Cn = Expected future cash flows
I= Rate of Interest Rate
n = Duration of cash flows
Example: 8
Ms. Sahasra wants to invest of her funds in particular Project, expected cash inflows from that
project Rs.10,000 Rs.15,000 Rs.20,000, Rs.22,000 and Rs.18,000 in years 1,2,3,4 and 5
respectively. Current market interest rate is 10% and finds out the Present value of future cash
inflows.
PV=
C
+I
+
C
+I
+
C
+I
+…….. +
C
+I n
PV=
,
+ .
+
,
+ .
+
,
+ .
+
,
+ .
+
8,
+ .
=9,090 +12,390 +15,020 +15,026 +11,178
=Rs.62, 704
V. CONCLUSION
Companies apply the time value of money to make yes-or-no decisions on capital projects as
well as to decide between competing projects. Two of the most popular methods are net
present value and internal rate of return. You start with the cost of the project and determine
the rate of return that would make the present value of the future cash flows equal to your
upfront cost. This concept is crucial in areas like capital budgeting, lease-or-buy decisions,
accounts receivable analysis and many others.
VI. REFERENCES
[1] IM Pandy Vikas Publications “ Financial Management”
To Cite This Paper
[1]Rao, V.V. (2016) : “A Study On Time Value Of Money” International Journal of
Informative & Futuristic Research (ISSN: 2347-1697), Vol. 4 No. (2), October 2016, pp.
5261-5267, Paper ID: IJIFR/V4/E2/049.](https://image.slidesharecdn.com/ijifrsection2october2016-161107013634/85/IJIFR-VOLUME-4-ISSUE-2-SECTION-2-OCTOBER-2016-57-320.jpg)
![5273
ISSN: 2347-1697
International Journal of Informative & Futuristic Research (IJIFR)
Volume - 4, Issue -2, October 2016
Continuous 38th Edition, Page No: 5268-5274
Dr. Gourav Mahajan:: Implementation Of Right To Education Act In
Context Of Drinking Water And Sanitation Facilities: A Case Study
Of Himachal Pradesh
The above table clearly shows that the status of toilet facilities for the children with special
needs in both the primary and the upper primary schools operating under the department of
state education even after the 5 years of implementation of RTE Act. Till 2012 none of
these schools had toilet facility for CSWN. In 2013 11.61 % of the primary schools and
11.29% of the upper primary schools were equipped with such facility which further
increased to 17.96 % of primary schools while 22.21 % of upper primary schools in 2015.
The increase is still insignificant as the majority of the schools are lacking the basic facility
for CSWN.
VIII. CONCLUSION
The much has been done and much has to be done to provide better basic drinking and
sanitation facilities in the schools. More comprehensive strategies need to be designed not
only to provide these facilities but also to ensure its proper maintenance. Special efforts are
required to ensure separate toilet facilities for the girls of the adolescence stage as biological
realities mean that girls need adequate sanitary facilities at school to manage menstruation.
Basic facilities that provide for good hygiene and privacy, along with sensitive health
promotion assist girls to stay in school and complete their education. Children with
disabilities are also vulnerable to dropping out of school. Accessible school facilities are a
key to school attendance for children with disabilities. An effective water, sanitation and
hygiene programmes seeks to remove barriers by promoting inclusive design – user-
friendly, child-friendly facilities that benefit all users, including adolescent girls, small
children and children who are sick or disabled.
IX. REFERENCES
[1] Adukia, A. Sanitation and Education; Harvard Graduate School of Education: Cambridge,
MA,USA, 2013.
[2] Alexander, K.T., Dreibelbis, R., Freeman, M.C., Ojeny, B., & Rheingans, R. (2013).
Improving service delivery of water, sanitation, and hygiene in primary schools: A cluster-
randomized trial in western Kenya. Journal of Water Health, 11, 507–519.
[3] Bartlett, S.(2003). Water, sanitation and urban children: The need to go beyond “improved”
provision. Environment Urban, 15, 57–70.
[4] Birdthistle, I., Dickson, K., Freeman, M., & Javidi, L. (2011). What Impact does the
Provision of Separate Toilets for Girls at Schools Have on Their Primary and Secondary
School Enrolment, Attendance and Completion?: A Systematic Review of the Evidence;
Social Science Research Unit, EPPI-Centre, Institute of Education, University of London:
London, UK, 2011.
[5] Blanton, E.; Ombeki, S.; Oluoch, G.O.; Mwaki, A.; Wannemuehler, K.; Quick, R.(2010).
Evaluation of the role of school children in the promotion of point-of-use water treatment
and handwashing in schools and households—Nyanza province, western Kenya, 2007. The
American Journal of Tropical Medicine and Hygiene , 82, 664–671.
[6] Doyle, B.A. (2015). Increasing Education and Other Opportunities for Girls and Women
with Water, Sanitation and Hygiene. Available online:
http://www.ircwash.org/resources/increasing-education-and-otheropportunities-
[7] Govt. of Himachal Pradesh. (2010). Statistical Data: Unified Distt. Information System for
Education,2010. Retrieved from
http://edumis.hp.gov.in/Application/uploadDocuments/content/Enrolment_Profile_2010-11.pdf](https://image.slidesharecdn.com/ijifrsection2october2016-161107013634/85/IJIFR-VOLUME-4-ISSUE-2-SECTION-2-OCTOBER-2016-63-320.jpg)
![5274
ISSN: 2347-1697
International Journal of Informative & Futuristic Research (IJIFR)
Volume - 4, Issue -2, October 2016
Continuous 38th Edition, Page No: 5268-5274
Dr. Gourav Mahajan:: Implementation Of Right To Education Act In
Context Of Drinking Water And Sanitation Facilities: A Case Study
Of Himachal Pradesh
[8] Govt. of Himachal Pradesh. (2011). Statistical Data: Unified Distt. Information System for
Education,2011. Retrieved from
http://edumis.hp.gov.in/Application/uploadDocuments/content/Enrolment_Profile_2011-12.pdf
[9] Govt. of Himachal Pradesh. (2012). Statistical Data: Unified Distt. Information System for
Education,2012. Retrieved from
http://edumis.hp.gov.in/Application/uploadDocuments/content/Enrolment_Profile_2012-13.pdf
[10] Govt. of Himachal Pradesh. (2013). Statistical Data: Unified Distt. Information System for
Education,2013. Retrieved from
http://edumis.hp.gov.in/Application/uploadDocuments/content/Enrolment_Profile_2013-14.pdf
[11] Govt. of Himachal Pradesh. (2014). Statistical Data: Unified Distt. Information System for
Education, 2014. Retrieved from
http://edumis.hp.gov.in/Application/uploadDocuments/content/Enrolment_Profile_2014-15.pdf
[12] Govt. of Himachal Pradesh. (2015). Statistical Data: Unified Distt. Information System for
Education, 2015. Retrieved from
http://edumis.hp.gov.in/Application/uploadDocuments/content/Enrolment_Profile_2015-16.pdf
[13] Jasper, C., Le, T.T., & Bartram, J. (2012). Water and sanitation in schools: A systematic
review of the health and educational outcomes. International Journal of Environmental
Research Public Health, 9, 2772–2787.
[14] Mishra, A. (2011). Understanding of Right to Education Act, 2009 with specific reference
to Orissa: Problems and challenges. Available online at www.ksrm.ac.in
[15] Onyango-Ouma, W., Aagaard-Hansen, J.,& Jensen, B.B (2005). The potential of
schoolchildren as health change agents in rural western Kenya. Social Science and
Medicine, 61, 1711–1722.
[16] O’Reilly, C.E., Freeman, M.C., Ravani, M., Migele, J., Mwaki, A., Ayalo, M., Ombeki, S.,
Hoekstra, R.M., & Quick, R. (2008) The impact of a school-based safe water and hygiene
programme on knowledge and practices of students and their parents: Nyanza Province,
western Kenya, 2006. Epidemiology and Infection, 136, 80–91.
[17] Singh, V. (2016). Status of implementation of the Right to Education Act, 2009 in Himachal
Pradesh. International Journal of Scientific Engineering and Applied Science, 2(1), 491-505.
[18] Soni, R.B.L., & Rahman, M.A. (2013). Status of implementation of RTE Act-2009 in
context of disadvantaged children at elementary stage. Available online at
http://www.ncert.nic.in/departments/nie/dee/publication/pdf/StatusreportRTE2013.pdf
[19] Uma (2013). Right to Education (RTE): A critical appraisal. Journal Of Humanities And
Social Science, 6(4), 55-60.
To Cite This Paper
[1]Mahajan,G.(2016) : “Implementation Of Right To Education Act In Context Of
Drinking Water And Sanitation Facilities: A Case Study Of Himachal Pradesh”
International Journal of Informative & Futuristic Research (ISSN: 2347-1697), Vol. 4 No.
(2), October 2016, pp. 5268-5264, Paper ID: IJIFR/V4/E2/042.](https://image.slidesharecdn.com/ijifrsection2october2016-161107013634/85/IJIFR-VOLUME-4-ISSUE-2-SECTION-2-OCTOBER-2016-64-320.jpg)
![5285
ISSN: 2347-1697
International Journal of Informative & Futuristic Research (IJIFR)
Volume - 4, Issue -2, October 2016
Continuous 38th Edition, Page No: 5275-5286
Dr. Anoop C.K., Abhijith R. :: Groundwater Analysis In The
Districts Of Warangal
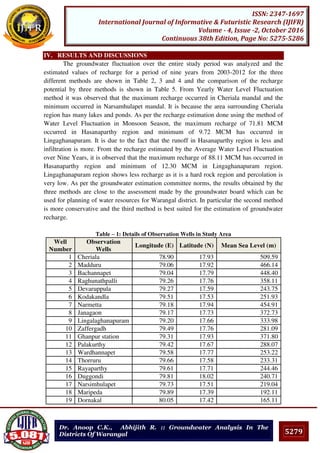
Dornakal 19 65.30 23.07 67.66
Sangem 20 21.50 9.98 22.55
Geesugonda 21 22.54 16.89 27.70
Athmakur 22 20.22 10.91 20.91
Parvathagiri 23 29.80 30.21 35.59
Warangal 24 29.05 9.88 29.83
Hasanparthy 25 70.19 71.81 88.11
Hanamkonda 26 42.97 37.99 56.65
Mahabubabad 27 37.59 27.00 41.44
Kesamudram 28 33.96 27.67 37.07
Korivi 29 31.68 20.46 34.54
Chennaraopet 30 19.02 16.61 22.24
Nellikuduru 31 12.94 9.98 13.71
Nekkonda 32 30.87 21.24 32.91
Gudur 33 11.91 10.12 13.51
Narsampet 34 37.32 25.88 38.54
Nallabelli 35 54.32 44.56 55.61
Khanapuram 36 64.94 54.65 66.38
Parkala 37 21.94 13.64 24.05
Mulugu 38 25.05 11.99 28.51
Eturunagaram 39 39.85 36.63 42.90
Regonda 40 33.21 28.26 38.54
Mogullapalli 41 14.85 18.80 19.39
Dharmasagar 42 47.79 39.37 56.37
Bhupalpalle 43 12.52 11.95 14.80
Shayampet 44 12.43 13.78 18.35
Chityal 45 18.25 17.44 18.71
Kothagunda 46 21.89 28.30 28.96
Venkatapur 47 14.51 11.94 16.02
Govindaraopet 48 41.15 35.67 41.36
Mangapet 49 19.69 17.17 21.21
Nelligudur 50 16.83 14.97 19.06
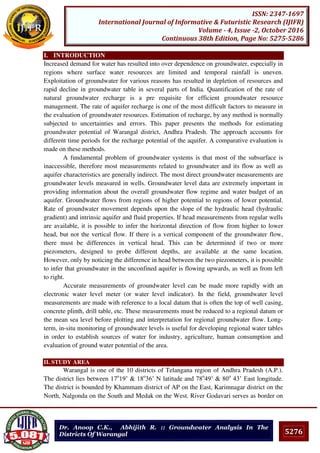
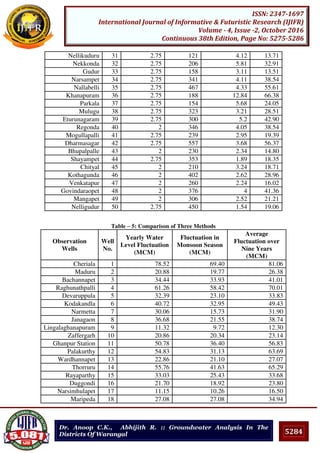
V. CONCLUSIONS
In this work, the optimum average recoverable groundwater reserve that can be exploited
from the aquifer was found out using different time scale for the depth of fluctuation.
Among the three methods, the recharge obtained by the first method is more conservative
and the results obtained from the third method are best suited for recharge of groundwater in
Warangal district. Here the estimation of groundwater potential using the water level
fluctuations in the dug wells enhances the assessment of water resources.
VI. REFERENCES
[1] Chandra, Satish and Saxena. R.S., (1975). “Water balance study for estimation of
groundwater resources”, Journal of Irrigation and power, India, pp. 443-449](https://image.slidesharecdn.com/ijifrsection2october2016-161107013634/85/IJIFR-VOLUME-4-ISSUE-2-SECTION-2-OCTOBER-2016-75-320.jpg)
![5286
ISSN: 2347-1697
International Journal of Informative & Futuristic Research (IJIFR)
Volume - 4, Issue -2, October 2016
Continuous 38th Edition, Page No: 5275-5286
Dr. Anoop C.K., Abhijith R. :: Groundwater Analysis In The
Districts Of Warangal
[2] Johnson. A.I., (1963). “Application of Laboratory permeability data” Open file Report,
USGS, Water resources Divison, Denver, Colarado, pp.34
[3] Karanth, K.R., (1987). “Groundwater Assessment, Development and Management”, Tata
McGraw-Hill Publishing company limited, NewDelhi, pp. 576-657
[4] Kumar, C.P. and Seethapathi, P.V., (2002). “Assessment of natural groundwater recharge in
upper Ganga Canal Command area”, Journal of Applied hydrology, Association of
hydrologists of India, Vol. XV, No. 4, October 2002, pp. 13-20
[5] Kumar, C.P., (1977). “Estimation of Natural groundwater recharge”. ISH Journal of
hydraulic Engineering, Vol.3, No.1, pp 61-74
[6] [Linsley R.K. (1992), “Groundwater, water resources engineering, fourth edition” Tata
McGraw-Hill publishing company Ltd.
[7] Ministry of Water Resources (1997) “Groundwater Resources estimation Methodology”
Report of the groundwater resources estimation committee, Government of New Delhi.
[8] Mishra, G.C., (1993). “Current status of Methodology for groundwater assessment in the
country in different region”, National Institute of Hydrology, Technical Report No. TR-140,
1992-93, p 25
[9] Sophocleous, Marios A., (1991). “Combining the soil water balance and water level
fluctuation methods to estimate natural groundwater recharge: Practical Aspects”, Jounal of
Hydrology, Vol.124, pp.229-241
[10] Kumar, Sumant, Singh, Surjeet. (2013). “Status of Managed aquifer recharge in India”,
Proceeding on International conference on integrated Water, Wastewater and Isotope
hydrology, Vol.1, pp 93-99
[11] Yeshoda.L.,Meenambal.T., Ranganna.G., (2013) “Estimation of groundwater potential – A
Comparative analysis”, Proceeding on International conference on integrated Water,
Wastewater and Isotope hydrology,Vol.1, pp 100-104
[12] Gupta. S .K, (2011) “Modern hydrology and sustainable water development-First Edition” A
John Wiley & Sons Publication pp. 70-89.
AUTHOR’S BIOGRAPHIES
Dr. Anoop C K, Associate Professor and Head of Research to the Dept.
of Civil Engineering, has done his PhD from NIT Warangal with
specialization in Environmental and Water Resource Management.
Abhijith R, Assistant Professor to the Dept. of Civil Engineering has
done his Master in Technology from NIT Surathkal, Karnataka with
specialization in Marine Structures.
To Cite This Paper
[1]Anoop C.K., Abhijith R. (2016):“Groundwater Analysis in the Districts of Warangal”
International Journal of Informative & Futuristic Research (ISSN: 2347-1697), Vol. 4
No. (2), October 2016, pp. 5275-5286, Paper ID: IJIFR/V4/E2/052.](https://image.slidesharecdn.com/ijifrsection2october2016-161107013634/85/IJIFR-VOLUME-4-ISSUE-2-SECTION-2-OCTOBER-2016-76-320.jpg)
![5297
ISSN: 2347-1697
International Journal of Informative & Futuristic Research (IJIFR)
Volume - 4, Issue -2, October 2016
Continuous 38th Edition, Page No: 5287-5297
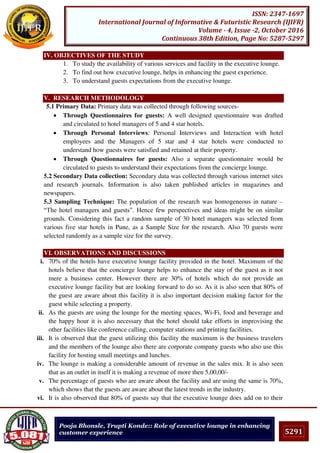
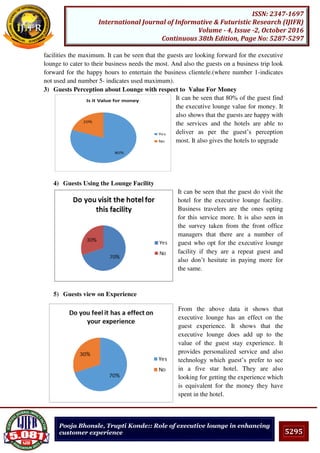
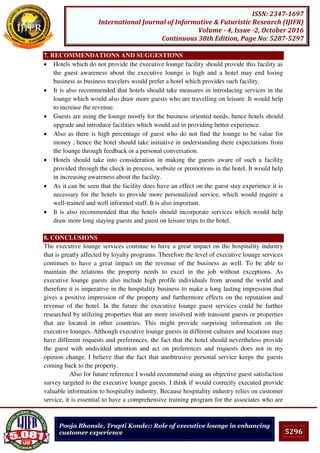
Pooja Bhonsle, Trupti Konde:: Role of executive lounge in enhancing
customer experience
providing the service. By providing professional and polished customer service the hotel is
able to demonstrate that every guest is as important and that the guest is the reason for the
hotel’s existence. In my opinion the basis for excellent executive lounge service starts from
recruitment and continues through training. This combined with well-planned executive
lounge service processes results in high-quality customer service and in impressed guests.
9. BIBLIOGRAPHY AND REFERENCES
[1] Ref : Journal of International Business & Cultural Studies;Feb2009, Vol. 1, p1
[2] Ref: Concierge hotel floors mark return of business travelers. (HOTELS),Article from
Commercial Property News, March 1, 2005
[3] Which Hotel attributes Matter? A review of previous and a framework for future
research, 2003.
[4] VIP services in the hospitality Industry,2013
[5] Customer Satisfaction and customer loyalty measurement in hotel settings: An Empirial
Analysis, Tourism & Hospitality Management 2010, Conference Proceedings, 2010.
[6] Standards, training and guests’ Perception in luxury hotels, Honours College at Digital
Commons @EMU.
[7] Customer Satisfaction Measurement of Budget-type Hotels Based on Customer Value,
Tourism Tribune,2014
[8] Performance Measurement Systems in Tourism, Hospitality, and Leisure Small
Medium-Sized Enterprises: A Balanced Scorecard Perspective, Journal of Travel
Research,2005
To Cite This Paper
[1]Bhonsle, P., Konde, T.(2016): “Role of executive lounge in enhancing customer
experience” International Journal of Informative & Futuristic Research (ISSN: 2347-
1697), Vol. 4 No. (2), October 2016, pp. 5287-5297, Paper ID: IJIFR/V4/E2/057.](https://image.slidesharecdn.com/ijifrsection2october2016-161107013634/85/IJIFR-VOLUME-4-ISSUE-2-SECTION-2-OCTOBER-2016-87-320.jpg)
![5308
ISSN: 2347-1697
International Journal of Informative & Futuristic Research (IJIFR)
Volume - 4, Issue -2, October 2016
Continuous 38th Edition, Page No: 5298-5308
J.Jayanthi, Dr. T.Naveen Raj, Dr.M.Suresh Gandhi:: Landslide
Susceptibility Map In Sillahalla Macro-Watershed Nilgiris, Tamil
Nadu Using By Frequency Ratio Method
5. REFERENCES
[1] Cevik E, Topal T, (2003) GIS-based landslide susceptibility mapping for a problematic
segment of the natural gas pipeline, hendek (Turkey). Environ Geol 44:949-942
[2] Chung, C.-J.F., Fabric, A.G., 2003. Validation of spatial prediction models for landslide hazards
mapping. Nat. Hazards 30 (3), 451-472.
[3] Cruden D.M., (1991) A simple definition of a landslide. Bulletin International Association of
engineering Geology, Vol. 43.pp:27-29.
[4] Dai F., Lee C.F., Ngai Y.Y., (2002) Landslide risk assessment and management: an overview,
Engineering Geology, 64,pp.65-87.
[5] Dai., Lee C.F., (2002) Landslide Hazard characteristic and slope instability modelling using
GIS, Lantau Island, Hong Kong .Geomorphology, Vol. 42,pp:213-228.
[6] Ganapathy, G. P.,Hala, C. L., (2012), Landslide Hazards Mitigation in the Nilgiris District,
India – Environmental and Societal Issues, International Journal of Environmental science and
Development, 3, pp 497 – 500.
[7] Guzzetti, F., (2000), Landslide fatalities and theevalution of landslide risk in Italy, Engineering
Geology, 58pp89-107.
[8] Komac, M., 2006. A landslide susceptibility model using the analytical hierarchy process
method and multivariate statistics in perialpine slovenia. Geomorphology 74 (1 - 4), 17-28.
[9] Lee S, Choi J, Min K (2004a) probabilistic landslide hazard mapping using GIS and remote
sensing data at Boun, Korea. Int J Remote Sens 25:2037-2052
[10]Lee, S., Pradhan, B., (2006), probabilistic landslide hazard and risk mapping on Penang Island,
Malaysia. J Earth Syst Sci, 115, pp 661-672.
[11] Lee, S., Talib, J.A., (2005), Probabilistic landslide susceptibility and factors effects analysis.
Environ Geol, 47, pp 982-990.
[12]Mathew, J., V.K., Rawat, G.S., (2007), Weight of evidence modeling for landslide hazard
zonation mapping in part of Bhagirathi valley, Uttarakhand Current Sciences, 92(5), pp 628-
638.
[13]Susen ML, Doyuran V (2004b) A comparison of the based landslide susceptibility assessment
methods: multivariate versus bivariate. Environ Geol 45:665-679
[14]Varnes, D.J., (1984), Landslide Hazard zonation: A Review of Principles and Practise, natural
Hazards (UNESCO) Paris. 3, pp63.
[15]Wieczorek, G. F., (1984), prepares a detailed landslide Inventory Map for Hazard Evaluation
and Reduction: Bulletin of the asocitation of Engineering Geologists, 21, pp 337-342.
To Cite This Paper
[1]Jayanthi,J., Raj,N.T., Gandhi,S.M. (2016): “Landslide Susceptibility Map In
Sillahalla Macro-Watershed Nilgiris, Tamil Nadu Using By Frequency Ratio
Method” International Journal of Informative & Futuristic Research (ISSN: 2347-
1697), Vol. 4 No. (2), October 2016, pp. 5298-5308, Paper ID: IJIFR/V4/E2/062.](https://image.slidesharecdn.com/ijifrsection2october2016-161107013634/85/IJIFR-VOLUME-4-ISSUE-2-SECTION-2-OCTOBER-2016-98-320.jpg)
![5320
ISSN: 2347-1697
International Journal of Informative & Futuristic Research (IJIFR)
Volume - 4, Issue -2, October 2016
Continuous 38th Edition, Page No: 5309-5321
S.Raji , Shivananda Roy, Renuka Roy, Hamet Sahu and Vipul
Kumar :: Design And Estimate Of Modified (With Plastic Waste)
Bituminous Pavement For A Given Stretch Of Road
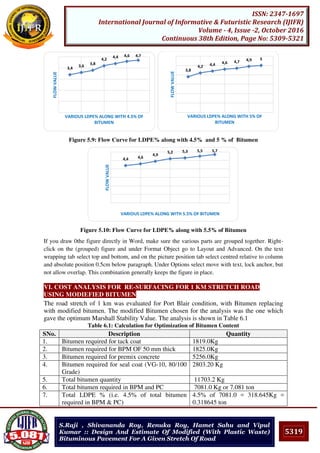
8. Quantity of Bitumen required in BPM & PC
after the addition of LDPE
7081.0 – 318.645 = 6762.355 Kg
=6.762355ton
9. Total quantity of bitumen saved 318.645 Kg = 0.318645 ton
10. Total cost of the project Rs.25,92,047.50
11. Final cost of project Rs 25,78,106.782
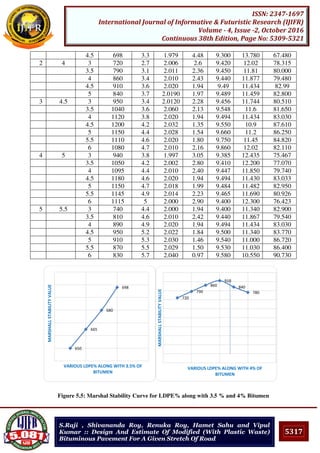
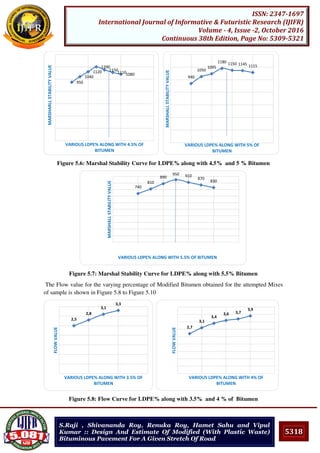
VII. CONCLUSION
This project work included preparation and testing of various Marshall specimen with
60/70 grade (VG30) of varying percentage of conventional bitumen as well as varying
percentage of modified bitumen (using waste plastic), to know the optimum content of
bitumen required for getting the maximum Marshall value, flow value. And it has been
observed that the values of other parameters i.e. Vv, Vb VMA and VFB in the cases
conventional and LDPE modified bitumen have found out to be within required
specifications. The study also found that at 4% of bitumen along with 4.5% of plastic
modified bitumen shows higher value of Marshall Stability value and suitable flow value
which achieves greater density. The study revealed that utilization of waste plastic in road
construction can be considered for waste management as well as to improve longevity of
road performance. Though the cost analysis was carried out only for the Bitumen
requirement for re-surfacing purpose which showed the reduction by around 4.5%
i.e318.645Kg (0.318645 ton) for 1km stretch of road. This will provide more stable and
durable mix for the flexible pavements. The serviceability and resistance to moisture will
also be better when compared to the conventional method of construction.
However this modified bitumen used in designed mix for pavement construction will have
strong, durable and eco-friendly roads which will relieve the earth from all type of plastic-
waste. This will help in increase in the life span as well as maintenance period of roads.
VIII. REFERENCES
[1] Mr. P.B Rajmane, Prof. A.K Gupta, Prof. D. B. Desai , Effective Utilization of Waste Plastic In
Construction Of Flexible Pavement For Improving Their Performance, IOSR Journal of
Mechanical & Civil Engineering.
[2] Kapil Soni, K.K Panjabi, Improving the performance of bituminous concrete mix by waste
plastic, ISSN Research Article.
[3] Arijit Kumar Banerji, Antu Das, Arobinda Mondal, Rahul Biswas, Md. Obaidullah, A
comparative evaluation on the properties of HMA with variations in aggregate gradation of
laboratory and field produced mixes, IJRET.
[4] Dr. Abhay Kumar Wayal , Mudassir D. Wagle, Use of waste plastic and waste rubber in
aggregate and bitumen for road material, International Journal Of Emerging Technology And
Advanced Engineering.
[5] Amit Gawande, G.S.Zamre, V.C. Renge, G.R.Bharsakale, Saurabh Tayde, Utilization of waste
plastic in asphalting of roads, Scientific Reviews & Chemical Composition.
[6] S.Rajasekaran, Dr. R. Vasudevan, Dr. Samuvel Paulraj, Reuse of waste plastics coated
aggregates – bitumen mix composite for road application green method, American journal of
engineering research.
[7] S. K. Khanna, C. E. G. Justo, A. Veeraragavan, Highway Engineering by, Revised 10th
edition,Nem Chand & Bros.,Roorkee,2014
[8] IRC,Guidelines for the design of flexible pavement, IRC:37-2001( Second Revision),Indian
Road Congress, New Delhi.](https://image.slidesharecdn.com/ijifrsection2october2016-161107013634/85/IJIFR-VOLUME-4-ISSUE-2-SECTION-2-OCTOBER-2016-110-320.jpg)
![5321
ISSN: 2347-1697
International Journal of Informative & Futuristic Research (IJIFR)
Volume - 4, Issue -2, October 2016
Continuous 38th Edition, Page No: 5309-5321
S.Raji , Shivananda Roy, Renuka Roy, Hamet Sahu and Vipul
Kumar :: Design And Estimate Of Modified (With Plastic Waste)
Bituminous Pavement For A Given Stretch Of Road
[9] BIS, Indian standard methods of testing tar and bituminous materials” ,IS 1202-1209,1978,
Bureau of Indian Standard, New Delhi
[10] American Standard of testing Machine)ASTM 1559, Marshal Stability test procedures
[11] MoRTH “Specification for road and bridge works”(4th
Revision), 2001, Indian Road Congress.
9 BIOGRAPHIES
.
To Cite This Paper
[1]Raji,S., Roy,S., Roy,R., Sahu, H., Kumar,V. (2016): “Design And Estimate Of
Modified (With Plastic Waste) Bituminous Pavement For A Given Stretch Of Road”
International Journal of Informative & Futuristic Research (ISSN: 2347-1697), Vol. 4
No. (2), October 2016, pp. 5309-5321, Paper ID: IJIFR/V4/E2/051.
Corresponding author is a Civil Engineer and has done her Post graduation
(M.E.) in construction Management & Technology. She is born and
brought up in Andaman Islands and did her graduation from Gujarat
University in the year 1993 and her Post graduation from NITTTR,
Chandigarh with Punjab University. She is been in teaching profession for
last 22 years and has been actively guiding both Diploma & Degree
(B.Tech) students of Civil Engineering Department of BRAIT, in their
Major Projects Her field of interest is Traffic Engineering. The other four
authors are her students.](https://image.slidesharecdn.com/ijifrsection2october2016-161107013634/85/IJIFR-VOLUME-4-ISSUE-2-SECTION-2-OCTOBER-2016-111-320.jpg)
![5325
ISSN: 2347-1697
International Journal of Informative & Futuristic Research (IJIFR)
Volume - 4, Issue -2, October 2016
Continuous 38th Edition, Page No: 5322-5326
P. D. Smitha, K. R. Binoy, Ashalatha S. Nair :: Cytological Analysis
Of Callus Cultures Of Diploid Musa Acuminata c.v.Njalipoovan
study high frequency of cytological variations were observed in Type1 non-embryogenic
calli compared to Type 2 embryogenic calli. Cytological analysis of callus culture revealed
a wide range of variation in chromosome number during culture. The variation partly
reflects the nuclear conditions of primary explant and partly it results from the nuclear
change under in vitro conditions, induction and during further growth in vitro, in the
presence of growth substance. Increase in the concentration of 2,4-D enhanced the
frequency of polyploid cells with the age of culture as reported in Allium sativum L. (Novak
et.al,1981). Prolonged culture of callus on high concentrations of 2,4-D in the medium
resulted in polyploid cells due to endomitosis was also reported in barley (Ziauddin and
Kaswa,1990). According to Balzan (1978) considerable increase in the volume of nuclei in
plant cells during in vitro cultures, can be attributed to the high degree of ploidy. Polyploid
plant material has been widely used in plant breeding programs for the production of new
improved and elite varieties permitting the restoration of hybrid fertility and it was known to
be the most wide spread cytogenetic process which has greatly contributed species
formation and evolution in higher plants (Stebbins, 1971). According to Jones and Smith
(1967) polyploidy clearly plays a part in initiating discontinuity both within and between
species. There was also evidence that embryogenic response can be introduced by breeding
into agronomically valuable genotypes.
V. CONCLUSION
The result of this study also indicates that different hormonal concentration enhance
polyploidy could be induced during in vitro culture in a relatively short period, and that
abnormal ploidy levels coincide with poor regeneration ability. Callus cultures of Musa
indicate its potential source as a reservoir of variable genotypes. The use of chromosomal
changes in plant regeneration experiments allows the exploitation of the available genetic
variation. However, in this culture, it remains to be investigated to what extent this variation
can be advantageously exploited through plant regeneration.
VI. REFERENCES
[1] Heslop-Harrison JS, Schwarzacher T (2007) Domestication, genomics and the future for
Banana. Annals of Botany 100: 1073-1084
[2] INIBAP (2001). Minutes of the second PROMUSA steering committee meeting, Bangkok,
Thailand,7-8 November 2000. INFOMUSA 9:1-14
[3] Narayana CK, Sathiamoorthy M and Mustaffa MM (2006) Commercial value added banana
products. NRCB Technical Bulletin.7.
[4] Vidhya R and Nair AS (2002) Molecular analysis of somaclonal variations in Musa
acuminata (AAA) Cv. Red. Phytomorphology 52 (4): 293-300.
[5] Stebbins, G.L., Jr. 1971. Processes of Organic Evolution. Englewood Cliffs, N: Prentice-
Hall
[6] Larkin PJ, Scowcroft WR. 1981. Somaclonal variation and crop improvement. In: Genetic
Engineering of Plants. An Agricultural Perspective, T. Kosuge, C.R. Meredilh and M.
Hollander (eds.) Plenum Press, 289-314.](https://image.slidesharecdn.com/ijifrsection2october2016-161107013634/85/IJIFR-VOLUME-4-ISSUE-2-SECTION-2-OCTOBER-2016-115-320.jpg)
![5326
ISSN: 2347-1697
International Journal of Informative & Futuristic Research (IJIFR)
Volume - 4, Issue -2, October 2016
Continuous 38th Edition, Page No: 5322-5326
P. D. Smitha, K. R. Binoy, Ashalatha S. Nair :: Cytological Analysis
Of Callus Cultures Of Diploid Musa Acuminata c.v.Njalipoovan
[7] Fluminhan A, Kameya T. 1996. Behavior of chromosomes in anaphase cells in embryogenic
callus cultures of maize (Zea mays L.).Theoretical and Applied Genetics 92: 982±990
To Cite This Paper
[1]Smitha,D.P., Binoy, R. K., Nair, S.A. (2016): “Cytological Analysis Of Callus
Cultures Of Diploid Musa Acuminata c.v.Njalipoovan” International Journal of
Informative & Futuristic Research (ISSN: 2347-1697), Vol. 4 No. (2), October 2016, pp.
5322-5326, Paper ID: IJIFR/V4/E2/054.](https://image.slidesharecdn.com/ijifrsection2october2016-161107013634/85/IJIFR-VOLUME-4-ISSUE-2-SECTION-2-OCTOBER-2016-116-320.jpg)
![5332
ISSN: 2347-1697
International Journal of Informative & Futuristic Research (IJIFR)
Volume - 4, Issue -2, October 2016
Continuous 38th Edition, Page No: 5327-5333
S. Arun, V.S. Shinu :: An Eco Friendly Bentonite Clay Catalysis For
The Stereoselective Synthesis Of Amino Carbonyl Scaffolds
V. REFERENCES
[1] G. Rothenberg,.; Wiley-VCH, Verlag GmbH &Co.KGa: Weinheim, 2008
[2] For reviews, see: (a) R. Elco.; S. Rachel.; V.A.O; Romano, Angew. Chem. Int. Ed. 2011, 50,
6234-6246; (b) L. H Choudhary, ; T Parvin,.; Tetrahedron; 2011, 67, 8213-8228; (c) D. Bonne.;
Y Coquerel; T Constantieux.; J Rodriguez,; Tetrahedron: Asymmetry 2010, 21, 1085-1109; (d)
B. B. Toure ; D. G. Hall,; Chem. Rev.; 2009, 109, 4439-4486; (e) K. Dortz, Jr. Stendel, K. H. ; J
.Chem. Rev. 2009, 109, 3227-3274; (f) B .Ganem,. ; Acc. Chem. Res. 2009, 42, 463-472; (g) L.
A. Wes Johann, D. G. Rivera, O.E Vercillo, ; Chem. Rev. ; 2009, 109, 796-814; (h) I. Ugi.; A.
Domling; Angew .Chem. Int. Ed. 2000, 39, 3168-3210; (i) A Domling; Chem. Rev. 2006, 106,
17-89; (j) A Domling, W Wang.; K Wang.; Chem. Rev. 2012, 112, 3083; (k) V A Guelvich, G
A Zhdanko, . V.A.O. Romano,; G. V. Nenajdenko.; Chem. Rev. ; 2010, 110, 5235-5331; (i) U
Corienda, R Felco, V. A. O. Romano; Chem. Soc. Rev.,; 2010, 41, 3969-4009
[3] a)L.F. Tietze, F. Haunert in stimulating concepts in chemistry (Eds.: M Shibasaki, J F Stoddart,
F. Vogtle), Wiley-VCH, Weinheim, 2000 pp. 39-64; b) Hulme G Oddon, P. Schmitt, Chem. Eur.
J 2000, 6, 3321-3339; c) L. F. Tietze, A. Modi, Med. Res. Rev. 2000, 20, 304-322; d) G. H.
Posner, Chem. Rev. 1986, 86, 831-844; e) R. W. Armstrong, A. P. Combs, P. A. Tempest, S. D.
Brown, T. A. Keating,; Acc. Chem. Res; 1996, 29, 123-131,
[4] L. F. Tietze Chem. Rev 1996, 96, 115-136.
[5] P. Arya, D. T. H. Chou, M. G. Baek,; Angew. Chem.; 2001, 113, 351-358; Angew. Chem. Int.
Ed .2001, 40, 339-346; b) S. L Shreiber, Science 2000, 287, 1964-1969.
[6] Lurtz Weber, MultiComponent Reactions and evolutionary chemistry, DDT, vol.7, No.2,
[7] I. Ugi., Pure Appl. Chem, 2001, 73, No.1, 187-191,
[8] (a) M. Arend, B. Westerman, N. Risch,; Angew. Chem;. 1998, 1096-1122: Angew. Chem. Int.
Ed.; 1998, 37, 1044-1070. (b) A. Laurent and C. F. Gerhardt.; Ann. Chem. et Physique; 1838,
66, 181; (c) A. Strecker. Ann. Chem.; 1850, 75, 27.
[9] A Dömling, Chem. Rev. 2006, 106, 17-89.
[10] (a) I. Ugi, Angew. Chem. Int. Ed. Engl. 1962, 1, 8-20. (b) S Lehnhoff,.; M Goebel,.; , R. M.
Karl.; R Klösel,.; I. Ugi,. Angew. Chem. Int. Ed. Engl. 1995, 34, 10, 1104-1107.
[11] I. Kanizsai; Z. Szakonyi, R Sillanpää, ; F. Fülöp,. Tetrahedron Lett. 2006, 47, 9113- 9116.
[12] U. Kusebauch, B. Beck, K. Messer, E. Herdtweck, A. Dömling,; Org. Lett. 2003, 5, 4021-4024.
[13] J. Zhu. H. Bienaymé,, Wiley-VCH, Verlag GmbH & Co. KGaA, Weinheim, 2005. pp.7-8
[14] A. Domling, Org. Chem. Highlights; 2004, April 5
[15] D. Enders, M. Moser, Geibel, G.; M. C Laufer; Synthesis; 2004, 2040- 2046.
[16] J. Barluenga, E Aguilar, S Fustero, B. Olano,; J. Org. Chem. 1993, 58, 5972-5975.
[17] a) K. Kobinata,; M. Uramoto,.; M. Nishii,.; H. Kusakabe,.; G. Nakamura,.; Isono,. Agric. Biol.
Chem. 1980, 44, 1709-1711. (b) U. Dahn; H. Hagenmaier; H. Hohne; W. A. Konig; G. Wolf; H.
Zahner. Arch. Microbiol. 1976, 107, 143-60.
[18] a) H.D. Dakin, R.J. Weast; J. Biol. Chem. 1928, 91, 745 b) D. Bahulayan,.; S. K. Das,.; J. Iqbal,;
J. Org. Chem;. 2003, 68, 5735-5738; c) B. Bhatia,.; M. M. Reddy, J. Iqbal,; J. Chem. Soc. Chem.
Commun. 1994, 713-714. d) R Ghosh; S. Maity,; Chakraborty, Synlett 2005, 115-118 e) M. M
Khodaei,.; A. R Khosropour,.; P. Fattahpour,. Tetrahedron Lett. 2005, 46, 2105-2108. f) P.
Rafiee,; F. Shahbazi,.; M. Joshaghani,.; F. Tork,. J. Mol. Catl. A: chemical; l 2005, 242, 129-
134. g) Zohreh Mirjafary, Hamdollah Saeidian, Azam Sadeghi, Firouz Matloubi Moghaddam;
Catalysis Communications .; 2008, 9, 299–306.; h) Jihillu. S. Yadav, Basi. V. Subba Reddy,
Kaltela S. Shankar and Kokku Premalatha, Org. Commun.1:4; 2008 76-83 i) R. Ghosh,.; S.
Maiti,.; A. Chakraborty,.; S. Chakraborty,.; A. K. Mukherjee,. Tetrahedron 2006, 62, 4059-4064
; j) Biswanth Das, K. Ravinder Reddy, R. Ramu, P. Thirupathi, B. Ravikanth, Synlett. 2006, No.
11 1756-1758 k) Biswanth Das, Malampathi srilatha, Boyapati Veeranjaneyulu, Beethapudi
Rama Rao, Synthesis 2010, No.5, 803-806 l) E.N. Prabhakaran and Javed Iqbal J. Org. Chem.
1999, 64, 3339-3341 m) Ahmed Reza Momeni, Maryam Sadeghi Applied catalysis A: General;
2009, 357, 100-105 n) Majid M. Heravi, Leila Ranjbar, Fatemeh Derikvand, Fatemeh F.
Bamoharram ; Journal of Molecular catalysis A: Chemical; 2007, 276, 226-229 o) V. S. Shinu ,](https://image.slidesharecdn.com/ijifrsection2october2016-161107013634/85/IJIFR-VOLUME-4-ISSUE-2-SECTION-2-OCTOBER-2016-122-320.jpg)
![5333
ISSN: 2347-1697
International Journal of Informative & Futuristic Research (IJIFR)
Volume - 4, Issue -2, October 2016
Continuous 38th Edition, Page No: 5327-5333
S. Arun, V.S. Shinu :: An Eco Friendly Bentonite Clay Catalysis For
The Stereoselective Synthesis Of Amino Carbonyl Scaffolds
B. Sheeja, E. Purushothaman, D. Bahulayan, Tetrahedron Letters, 2009, 50, 4838–4843 p) V. S.
Shinu , P. Pramitha, D. Bahulayan, Tetrahedron Letters 52, 2011, 3110-3115 q) D. Bahulayan
,V. S. Shinu , P.Pramitha, S.Arun, B. Sheeja, Tetrahedron Letters, 2012, 42:8, 1162-1176
[19] (a) B. F. Mirjalili,.; M. M. Hashemi,.; B. Sadeghi,.; H. Emtiazi,.; J. Chinese Chem. Soc. 2009,
56, 386-391; (b) G. Pandey; R. P Singh; A. Garg ; V. K. Singh,; Tetrahedron Lett. 2005, 46,
2137-2140 (c) M. M. Heravi; M. Daraie,; F. K. Behbahani,; R. Malakooti.; Synth. Commun,
2010, 40, 1180-1186. (d) A. T Khan; L. H. Choudhary; T. Parvin; Md. Asif Ali, Tetarhedron
Lett. 2006, 47, 8137-8141. (e) A. T. Khan; T. Parvin,.; L. H. Choudhari.; Tetrahedron,; 2007,
63, 5593-5601.
[20] I. N. Rao,; E. N. Prabhakaran,.; S. K. Das,.; J. Iqbal,.; J. Org. Chem.; 2003, 68, 4079-4082.
[21] a) Bahulayan, D.; Das, S. K.; Iqbal, J. ; J. Org. Chem. 2003, 68, 5735-5738; (b) Shinu, V. S.;
Sheeja, B.; Purushothaman, E.; Bahulayan, D. Tetrahedron Lett. 2009, 50, 4838–4842; (c)
Shinu, V. S.; Pramitha, P.; Bahulayan, D. Tetrahedron Lett. 2011, 52, 3110–3115; (d)
Bahulayan, D.; Shinu, V. S.; Pramitha, P.; Arun, S.; Sheeja, B. Synth. Commun. 2012, 42, 1162–
1176
To Cite This Paper
[1]Arun,S., Shinu,S.V. (2016): “An Eco Friendly Bentonite Clay Catalysis For The
Stereoselective Synthesis Of Amino Carbonyl Scaffolds” International Journal of
Informative & Futuristic Research (ISSN: 2347-1697), Vol. 4 No. (2), October 2016, pp.
5327-5333, Paper ID: IJIFR/V4/E2/055.](https://image.slidesharecdn.com/ijifrsection2october2016-161107013634/85/IJIFR-VOLUME-4-ISSUE-2-SECTION-2-OCTOBER-2016-123-320.jpg)
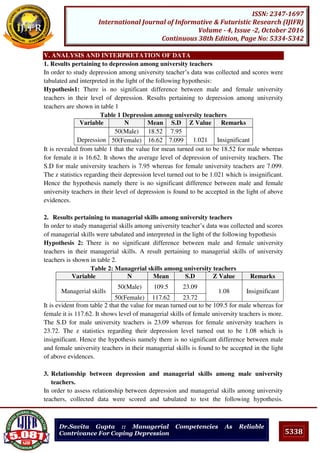
![5341
ISSN: 2347-1697
International Journal of Informative & Futuristic Research (IJIFR)
Volume - 4, Issue -2, October 2016
Continuous 38th Edition, Page No: 5334-5342
Dr.Savita Gupta :: Managerial Competencies As Reliable
Contrivance For Coping Depression
Using problem-solving techniques: Encouraging teachers to analyze, understand, and
deal with problem situations rather than avoiding them, blaming others, or feeling
helpless.
Handling emotions: looking closely at how emotions such as frustration, anxiety, and
fear contribute to ineffective coping strategies; and allowing participants to reassess
their feelings and “re-write” effective responses.
Dealing with life changes: Developing counseling skills among teachers in order to
help deal with stressful events. This includes listening and empathy; actively listening as
well as communicating ones’ thoughts effectively; and clarifying one’s personal
feelings.
VII. CONCLUSION
The above cited results enabled the researcher to conclude rationally that there is no
significant difference between male and female university teachers in their level of
depression. The reason can be similar kinds of limited facilities available to both. It may
also be due to the same adverse environment in which they work. Further, the lack of
respect and recognition from students towards both male and female teachers may be
leading to similar levels of depression amongst them. There is no significant difference
between male and female university teachers in their managerial skills. Managerial skills are
not just honed during learning; they also get imbibed with experience. The reason for
similar managerial skills amongst male and female university teachers can be the similar
type of formal education system and opportunities provided to them in service.No
significant relationship exists between level of depression and managerial skills of male
university teachers. Similar results are found in case of female university teachers as well. It
is due to the fact that depression and managerial skills are two different streams of mind,
flowing in two different directions. Depression sets in not just due to professional reasons,
but as a result of many personal experien ces as well. Further, depression is within oneself
and affects our own life. On the other hand, managerial skills are more to do with the
outside world. It is the way how we affect the functioning of others. Depression is a state of
working, while managerial skill is an attribute.
VIII. REFERENCES
[1] Ahsan,N. and Gun,F.(2009). A study of job satisfaction among university staff in Malaysia
Empirical study, european journal of social sciences-vol 8 Nov 1.
[2] Asthtiani, and Tarkhorani,(2007). Relationship between self concept, self esteem, anxiety,
depression and academic achievement in adolescents, journal of applied sciences7 (7):995-
1000, 2007.
[3] Balci,M. and Ankara,A.(1994). Work stress of university lecturers, Review of educational
sciences faculty, 27(1) Issue 1.
[4] Basu,R. (2009). Job satisfaction of secondary school teachers,Indian journal of psychometry
and education Vol 40 1&2.](https://image.slidesharecdn.com/ijifrsection2october2016-161107013634/85/IJIFR-VOLUME-4-ISSUE-2-SECTION-2-OCTOBER-2016-131-320.jpg)
![5342
ISSN: 2347-1697
International Journal of Informative & Futuristic Research (IJIFR)
Volume - 4, Issue -2, October 2016
Continuous 38th Edition, Page No: 5334-5342
Dr.Savita Gupta :: Managerial Competencies As Reliable
Contrivance For Coping Depression
[5] Beck, AT, CH Ward, M Mendelson, J Mock, and J Erbaugh. (1961). An inventory for
measuring depression, Arch Gen Psychiatry 4: 561-571.
[6] Beck, AT, Steer RA. (1984)Internal consistencies of the original and revised Beck
Depression Inventory. J Clin Psychol. 1984 Nov; 40(6):1365-7.
[7] Beck, AT, Rial WY, Rickets K. Short form of depression inventory: cross-validation.(1974)
Psychol Rep. 1974 Jun; 34(3):1184-6.
[8] Harvey,M. (2000).Under stress the concerns and coping strategies of teacher education,
students School education flinders university.
[9] Kyriacou, C. (1987). Teacher stress and burnout: An international review. Educational
Research, 29(2), 146-152.
[10] LAVINGIA, K. U., (1974). A study of job satisfaction among school teachers, Ph.D. Edu.,
Guj. U., 1974-2
[11] Mc Manaman (2004) Depression haunts teachers. Toronto Star featured article
[12] Mustafa,O. and Jaseena,N. (2008). Job satisfaction of pre school teachers of kerela,
International educator Vol.20 No.2.
[13] Unal,S. (2000). Professional stress of teachers its indicators and coping attitudes, Hacettepe
Universities Egitum Fakultesi Dergisi 19: 149-155.
IX. WEB PAGES
[1] www.agingsociety.org
[2] http://depression.wikia.com/wiki/beck_depression_inventory
[3] http://en.wikipedia.org/wiki/beck_depression_inventory
[4] http://www.ibogaine.desk.nl/graphics/3639b1c_23.pdf
[5] http://eku.comu.edu.tr/index/5/1/mbalkis_eduru.pdf
[6] http://www.depression.com
[7] http://ihcrp.georgetown.edu/agingsociety/pdfs/depression.pdf
[8] file://localhost/D:/depression%20folder/define_depression%20-%20Google%20Search.mht
[9] file://localhost/D:/depression%20folder/management_%20Definition,%20Synonyms%20fro
m%20Answers.com.mht
[10] file://localhost/D:/depression%20folder/Psych%20Central%20-
%20Depression%20Research.mht
[11] file://localhost/D:/depression%20folder/Teacher%20Depression.mht
[12] file://localhost/D:/depression%20folder/What%20Are%20Managerial%20Skills_%20-
%20Blurtit.mht
To Cite This Paper
[1]Gupta, S. (2016): “Managerial Competencies As Reliable Contrivance For Coping
Depression” International Journal of Informative & Futuristic Research (ISSN: 2347-
1697), Vol. 4 No. (2), October 2016, pp. 5334-5342, Paper ID: IJIFR/V4/E2/058.](https://image.slidesharecdn.com/ijifrsection2october2016-161107013634/85/IJIFR-VOLUME-4-ISSUE-2-SECTION-2-OCTOBER-2016-132-320.jpg)
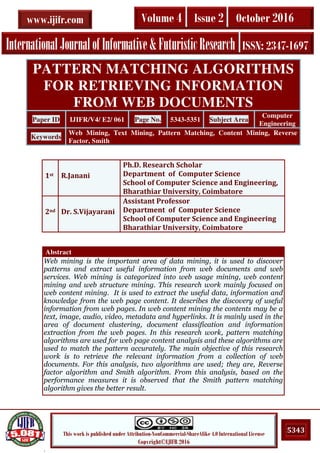
![5344
ISSN: 2347-1697
International Journal of Informative & Futuristic Research (IJIFR)
Volume - 4, Issue -2, October 2016
Continuous 38th Edition, Page No: 5343-5351
R.Janani, Dr. S.Vijayarani :: Pattern Matching Algorithms for
Retrieving Information from Web Documents
I. INTRODUCTION
Web mining is the application of data mining techniques to extract knowledge from
Web data, which includes Web documents, hyperlinks between documents, and usage logs
of web sites [1]. This research work mainly focused on web content mining. For analyzing
the content, pattern matching algorithms are used. Pattern matching algorithm is an essential
idea for many problems and it is used in various applications which include text mining,
data retrieval, DNA pattern matching and finding certain vital keywords in security
applications [2]. This algorithm has two strategies such as, exact matching and
approximates matching. In exact matching, the pattern is completely matched with the
specific text window of input text and it displays the initial index position [3]. In
approximate matching, if precise portion of the pattern matched with the selected text
window straight away it displays the output.
This paper organized as follows section II describes the related works; section III
illustrates the methodology of this research work. Result and discussion given in Section IV
and section V describes the conclusion of this research work.
II. RELATED WORKS
Sathish Kumar et al. [1] the research in the area of applications of neural networks and
pattern matching algorithms in classification is presented. Artificial neural networks for
classification and different pattern matching algorithms for matching the given DNA
patterns or strings with the existing DNA sequences available in the databases are specially
studied. A set of local searching algorithms were experimented for different test string
lengths and their time complexity is tabulated.
Abdulwahab Ali Al-mazroi et al. [5] proposed a new hybrid algorithm called BRSS by
combining two algorithms, Berry-Ravindran and Skip Search. The hybrid algorithm
demonstrates enhanced character comparisons, number of attempts and searching time
performances in all the different data size and pattern lengths, therefore the proposed
algorithm is useful for searching DNA, Protein and English text. This also proved that the
application of the hybrid algorithm will lead to better searching and matching of the patterns
than the use of one algorithm as data is becoming more complex presently.
Saima Hasib et al. [6] discussed the Aho-Corasick algorithm is best suited for multiple
pattern matching and it can be used in many application areas. The complexity of the
algorithm is linear in the length of the patterns plus the time taken of the searched text plus
the amount of output matches. It is found to be attractive in large numbers of keywords,
since all keywords can be simultaneously matched in one pass. Aho-Corasick provides
solution to many real world problems like Intrusion detection, Plagiarism detection,
bioinformatics, digital forensic, text mining and many more. Aho-Corasick is one of the
most productive algorithms in text mining.
Jorma Tarhio et al. [7] proposed an efficient string matching algorithm with compact
memory as well as high worst-case performance. Using a magic number heuristic based on
the Chinese Remainder Theorem, the proposed ACM significantly reduces the memory](https://image.slidesharecdn.com/ijifrsection2october2016-161107013634/85/IJIFR-VOLUME-4-ISSUE-2-SECTION-2-OCTOBER-2016-134-320.jpg)
![5345
ISSN: 2347-1697
International Journal of Informative & Futuristic Research (IJIFR)
Volume - 4, Issue -2, October 2016
Continuous 38th Edition, Page No: 5343-5351
R.Janani, Dr. S.Vijayarani :: Pattern Matching Algorithms for
Retrieving Information from Web Documents
requirement without bringing complex processes. Furthermore, the latency of off-chip
memory references is drastically reduced. The proposed ACM can be easily implemented in
hardware and software. As a result, ACM enables cost-effective and efficient IDSs.
Chinta Someswara Rao et al [13] implemented parallel string matching with JAVA
Multithreading with multi core processing, and performed a comparative study on Knuth
Morris Pratt, Boyer Moore and Brute force string matching algorithms. For testing, gene
sequence database are used which consists of lacks of records. From the test results it is
shown that the multi core processing is better compared to lower versions. Finally this
proposed parallel string matching with multi core processing is better compared to other
sequential approaches.
III. METHODOLOGY
The main objective of this research work is to retrieve the relevant information from
a collection of web documents. In order to perform this task this research work uses two
phases; Pre-processing phase and Searching phase. In the preprocessing phase the converter
has to be used to convert the wed documents into the pdf file format. In the searching phase,
there are two pattern matching algorithms are used namely reverse factor algorithm and
smith algorithm. The performance factors are time taken for searching the pattern, number
of iterations and the relevancy. Figure 1 shows the methodology of this research work.
Figure 1: System Architecture](https://image.slidesharecdn.com/ijifrsection2october2016-161107013634/85/IJIFR-VOLUME-4-ISSUE-2-SECTION-2-OCTOBER-2016-135-320.jpg)
![5346
ISSN: 2347-1697
International Journal of Informative & Futuristic Research (IJIFR)
Volume - 4, Issue -2, October 2016
Continuous 38th Edition, Page No: 5343-5351
R.Janani, Dr. S.Vijayarani :: Pattern Matching Algorithms for
Retrieving Information from Web Documents
A. Web Documents
In order to perform this task, the input documents are collected from the web. For this
analysis the ten web document links are used as input. The sample input document links are
given in Table 1.
TABLE 1: SAMPLE INPUT
S.
N.
Web Document Links
1 https://en.wikipedia.org/wiki/Document_clustering
2 https://en.wikipedia.org/wiki/Web_mining
3 https://en.wikipedia.org/wiki/Data_mining
4 https://en.wikipedia.org/wiki/Social_media_mining
5 http://scikit-learn.org/stable/auto_examples/text/document_clustering.html
6 http://wikid.eu/index.php/Image_Mining
7 http://www.tcs.com/SiteCollectionDocuments/White%20Papers/Insurance_Whitepaper_Mining_U
nstructured_Text_Data_for_Insurance_Analytics_08_2010
8 https://www.linguamatics.com/blog/text-mining-full-text-scientific-articles-more-facts-more-types-
facts-faster
9 http://searchbusinessanalytics.techtarget.com/definition/association-rules-in-data-mining
10 http://www.sciencedirect.com/science/article/pii
B. Preprocessing Phase
In this phase the converter is used for converting web documents into pdf file
format. The content analysis has to done in the pdf file format [8]. The name of the
converter is Wed2PDF. It is the open source online tool, and it helps web users, website
publishers and bloggers to save their web content to PDF files. So that they can print, share
and archive the web documents. This converter is made by Baltsoft software; it is an
information technology company and specializing in the development of high quality
software for organization, business and individuals [9]. The original web pages given into
the Web2PDF and it convert the web pages into PDF files. The converted PDF with their
names is given in Table 2.
TABLE 2: PDF CONVERSION OF WEB PAGES – PDF NAMES
S.No Web Document Links Converting the Link to Pdf
using Web2PDF
1 https://en.wikipedia.org/wiki/Document_clustering Document Clustering-
Wikipedia.pdf
2 https://en.wikipedia.org/wiki/Web_mining Web Mining-Wikipedia.pdf
3 https://en.wikipedia.org/wiki/Data_mining Data Mining-Wikipedia.pdf
4 https://en.wikipedia.org/wiki/Social_media_mining Social Media Mining-
Wikipedia.pdf
5 http://scikit-
learn.org/stable/auto_examples/text/document_clusterin
g.html
scikit-learn-org.pdf
6 http://wikid.eu/index.php/Image_Mining wikid-eu.pdf
7 http://www.tcs.com/SiteCollectionDocuments/White%2
0Papers/Insurance_Whitepaper_Mining_Unstructured_T
ext_Data_for_Insurance_Analytics_08_2010
www-tcs-com.pdf
8 https://www.linguamatics.com/blog/text-mining-full- www-linguamatics-com.pdf](https://image.slidesharecdn.com/ijifrsection2october2016-161107013634/85/IJIFR-VOLUME-4-ISSUE-2-SECTION-2-OCTOBER-2016-136-320.jpg)
![5347
ISSN: 2347-1697
International Journal of Informative & Futuristic Research (IJIFR)
Volume - 4, Issue -2, October 2016
Continuous 38th Edition, Page No: 5343-5351
R.Janani, Dr. S.Vijayarani :: Pattern Matching Algorithms for
Retrieving Information from Web Documents
text-scientific-articles-more-facts-more-types-facts-
faster
9 http://searchbusinessanalytics.techtarget.com/definition/
association-rules-in-data-mining
searchbusinessanalytics-
techtarget-com.pdf
10 http://www.sciencedirect.com/science/article/pii www-sciencedirect-com.pdf
C. Searching Phase
In this phase the pattern matching algorithms are used to search the particular pattern
in the text. For this analysis, two algorithms are used they are reverse factor algorithm and
smith algorithm.
1. Reverse Factor Algorithm
The Boyer-Moore based algorithms match some suffixes of the pattern [10]. But it is
possible to match the prefix of the pattern also by scanning from the right to left of the
string. Instead of doing this, we can do by using the smallest suffix automaton of the reverse
pattern of the string [11]. This approach is called as Reverse Factor algorithm. This
algorithm parses the character of the window from right to left with the help of the
automaton in its searching phase. This process continues until there is no more transition
outlined for the current character in the current automaton. This algorithm uses the suffix
automation and it is very fast for long patterns and small alphabets. The time complexity for
the preprocessing phase is O (m) and for the searching phase is O (mn).
Algorithm 1: Reverse Factor Algorithm
Input: A text string T and a pattern string P with lengths n and m respectively
W be the Window
Output: All occurrences of P in T.
Set i to 1;
Step 1: if i+m-1 >n then exit.
else let W is equal to T (i, i+m-1) be a window.
find LSP (W, P)
if |LSP (W, P)| is equal to m,
return the pattern; match is found at ti and a is equal to m-|LSP (W, P)|.
Else, set a=m-|LSP (W, P)|.
increment i by a
Go to Step 1.
2. Smith Algorithm
Smith algorithm is used to compute the shift with the text character just next to the
rightmost text character of the particular window [12]. This operation gives sometimes
shorter shift than using the rightmost text character of the particular window. The
preprocessing phase of this algorithm consists in computing the bad character shift function
and the Quick Search bad-character shift function [13]. The preprocessing phase is in O
(m+σ) time and the searching phase has a quadratic worst case time complexity.
Algorithm 2: Smith Algorithm
void SMITH(character x, integer m, character y, integer n)](https://image.slidesharecdn.com/ijifrsection2october2016-161107013634/85/IJIFR-VOLUME-4-ISSUE-2-SECTION-2-OCTOBER-2016-137-320.jpg)
![5348
ISSN: 2347-1697
International Journal of Informative & Futuristic Research (IJIFR)
Volume - 4, Issue -2, October 2016
Continuous 38th Edition, Page No: 5343-5351
R.Janani, Dr. S.Vijayarani :: Pattern Matching Algorithms for
Retrieving Information from Web Documents
begin
initialize j, bmBc[ASIZE], qsBc[ASIZE];
preprocess preBmBc(x, m, bmBc);
preprocess preQsBc(x, m, qsBc);
initialize j = 0;
while (j<= n - m)
begin
if (memcmp(x, y + j, m) is equal to 0)
OUTPUT(j);
Equal j to j + max of bmBc[y[j + m - 1]], qsBc[y[j + m]]
end
end
IV. RESULT AND DISCUSSION
In order to perform this analysis, the performance factors are search time, number of
iterations and relevancy for various types of inputs. The inputs are single word, multiple
words and a file for .pdf file format. For this analysis, the pattern matching algorithms were
implemented by using Java. Here the input query is “Mining”, “Text Mining” and “Text
mining is also known as text data mining” for single word, multiple words and a file
respectively. Based on this input query only the results are analyzed.
Search Time: It refers the time taken for searching the pattern within the input text. It
can be estimated by comparison of each character in pattern with the input text.
Iterations: It refers the total number of iterations for matching the pattern with the input
text. It is based on the given input document and various algorithms.
Relevancy: It refers the accuracy of the algorithm; the accuracy is calculated by using
the formula is given in Equation (1).
………Equ (1)
Table 3 shows the sample input for this experimentation and the size of the each files. These
input documents are collected from web pages.
TABLE 3: SAMPLE INPUT
File Name Size (Kb)
Document Clustering-Wikipedia.pdf 151
Web Mining-Wikipedia.pdf 198
Data Mining-Wikipedia.pdf 481
Social Media Mining-Wikipedia.pdf 271
scikit-learn-org.pdf 377
wikid-eu.pdf 91
Www-tcs-com.pdf 736
Www-linguamatics-com.pdf 81
Searchbusinessanalytics-techtarget-com.pdf 416
Www-sciencedirect-com.pdf 48
Accuracy=
� � � � � � ��
� � � � � � � �
X 100](https://image.slidesharecdn.com/ijifrsection2october2016-161107013634/85/IJIFR-VOLUME-4-ISSUE-2-SECTION-2-OCTOBER-2016-138-320.jpg)
![5351
ISSN: 2347-1697
International Journal of Informative & Futuristic Research (IJIFR)
Volume - 4, Issue -2, October 2016
Continuous 38th Edition, Page No: 5343-5351
R.Janani, Dr. S.Vijayarani :: Pattern Matching Algorithms for
Retrieving Information from Web Documents
V. CONCLUSION
Web mining is used to gather, organize and provide the exact information on the web based
on the user’s query. It is used to determine the relevance of the content to the search query.
This research work focused on web content mining, it uses the ideas of data mining. For
mining or analyzing the web content, the pattern matching algorithms are used in this
research work. The main objective of this work is to retrieve the relevant information form
web pages. In order to perform this task, there are two pattern matching algorithms are used
they are reverse factor algorithm and smith algorithm. From the experimental results it is
clearly observed that the Smith algorithm gives the better accuracy.
VI. REFERENCES
[1]. Sathish Kumar S and N. Duraipandian , Artificial Neural Network based String Matching
Algorithms for Species Classification – A Preliminary Study and Experimental Results,
International Journal of Computer Applications (0975 – 8887) Volume 52– No.14, August 2012
[2]. Mahmoud Moh’dMhashi , Mohammed Alwakeel, New Enhanced Exact String, Searching
Algorithm, IJCSNS International Journal of Computer Science and Network Security, VOL.10
No.4, April 2010
[3]. Christian Charras, Thierry Lecroq and Joseph Daniel, A Very fast string searching algorithm for
small alphabets and long patterns, Combinational Pattern Matching, 9th Annual Symposium,
CPM 98 Piscataway, New Jersey, USA, 2005
[4]. R.S. Boyer, J.S. Moore, "A fast string searching algorithm," Communication of the ACM, Vol.
20, No. 10, 1977, pp.762– 772.
[5]. Abdulwahab Ali Al-Mazroi and Nur’aini Abdul Rashid, A Fast Hybrid Algorithm for the Exact
String Matching Problem, American Journal of Engineering and Applied Sciences 4 (1): 102-
107, 2011.
[6]. Ababneh Mohammad, OqeiliSaleh and Rawan A Abdeen, Occurrences Algorithm for String
Searching Based on Brute-Force Algorithm, Journal of Computer Science, 2(1): 82-85, 2006.
[7]. Bin Wang, Zhiwei Li, Mingjing Li and Wei-Ying Ma, Large-Scale Duplicate Detection for Web
Image Search, Multimedia and Expo, IEEE International Conference, 353-356, 2006
[8]. Pandiselvam.P, Marimuthu.T, Lawrance. R, A Comparative Study on String Matching
Algorithms of Biological Sequences.
[9]. http://www.web2pdfconvert.com/
[10]. JormaTarhio and EskoUkkonen, Approximate Boyer-Moore String Matching, SIAM Journal on
Computing, Volume 22 Issue 2, 243 – 260, 1993.
[11]. Olivier Danvy, Henning Korsholm Rohde, On Obtaining the Boyer-Moore String-Matching
Algorithm by Partial Evaluation, Journal of Information Processing Letters, Volume 99 Issue 4,
158-162, 2005.
[12]. Akinul Islam Jony, Analysis of Multiple String Pattern Matching Algorithms, International
Journal of Advanced Computer Science and Information Technology (IJACSIT) Vol. 3, No. 4,
2014, Page: 344-353, ISSN: 2296-1739
[13]. Pandiselvam.P, Marimuthu.T, Lawrance. R, A comparative study on string matching algorithms
of biological sequences, https://arxiv.org/ftp/arxiv/papers/1401/1401.7416.pdf
To Cite This Paper
[1]Janani, R., Vijayarani, S. (2016): “Pattern Matching Algorithms for Retrieving
Information from Web Documents” International Journal of Informative &
Futuristic Research (ISSN: 2347-1697), Vol. 4 No. (2), October 2016, pp. 5343-5351,
Paper ID: IJIFR/V4/E2/061.](https://image.slidesharecdn.com/ijifrsection2october2016-161107013634/85/IJIFR-VOLUME-4-ISSUE-2-SECTION-2-OCTOBER-2016-141-320.jpg)
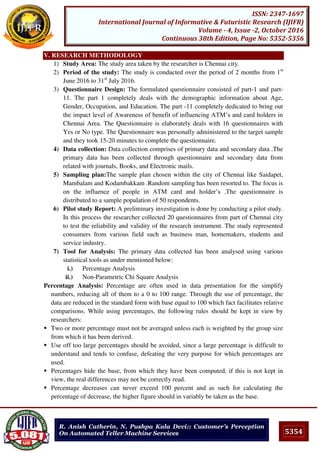
![5356
ISSN: 2347-1697
International Journal of Informative & Futuristic Research (IJIFR)
Volume - 4, Issue -2, October 2016
Continuous 38th Edition, Page No: 5352-5356
R. Anish Catherin, N. Pushpa Kala Devi:: Customer’s Perception
On Automated Teller Machine Services
Table-3: The table value of chi-square for 14 degree of freedom
Chi-square value Degree of Freedom Table Value
73.21393 14 23.685
Source: Primary Data
Inference:
The table value of chi-square for 14 degree of freedom at 5 percent level of
significance is 23.685. The calculate value of chi-square is much higher than this table value
and hence the result of the hypothesis is does not support the hypothesis. Therefore the
hypothesis is rejected.
Hypothesis:
Ho: There is no association between using ATM services of bank in Chennai city.
VII. CONCLUSION
Based on the ATM studies we hereby conclude that ATM is the easiest way of
depositing and withdrawing money. Transaction is possible any time, that’s why in India
some people call ATM as “all-time money”. If ATM machines are connected to internet
then it’s possible to do transaction from anywhere, 24 hours days and 365 days a year. With
the security of ATM improving it has now become a safe mode of transaction. Thus the
findings of the study may be very useful for bank officials and it may also help the ATM
section of the banks to develop their future plans and strategies. Hence it can be concluded
that ATM is safe, fast, reliable, convenient, excisable and any time money machine.
VIII. REFERENCES
1. Amutha.R, “A Study on Customer Satisfaction towards Quality of Service of an Indian Private
Sector Bank” Asia Pacific Journal of Management Research and Innovation 2013, Volume 2,
Issue 8.
2. Kumaran. C, “Customer Satisfaction with bank ATMs in Thiruvarur district” Asian Journal of
Management Research 2011, ISSN 2229 – 3795, Volume 2.
3. McAndrews,J.J “Impact of ATM on Customer Satisfaction” Journal of Banking Financial
Service 2006, ISSN 2202 – 4259 Volume 4, Issue 7.
4. Manvinder Singh Pahwa et al. “Analytical Study of Customer Satisfaction at ICICI bank with
Special reference to ATMs” International Journal of Finance, 2011, Vol 12.
5. RichaTuli et.al. “A comparative study of customer attitude towards ATM of SBI and ICICI
bank” International Journal of Marketing and Technology, 2012, ISSN: 2249 – 1058, Volume 2,
Issue 8.
6. Sivesan S(2012) “Service Quality and Customer Satisfaction”, International Journal of
Marketing, Financial services and Management research, vol.1, Issue 10.
7.
To Cite This Paper
[1]
Catherin,A.R., KalaDevi,P.K. (2016): “Customer’s Perception On Automated
Teller Machine Services” International Journal of Informative & Futuristic
Research (ISSN: 2347-1697), Vol. 4 No. (2), October 2016, pp. 5352-5356, Paper
ID: IJIFR/V4/E2/060.](https://image.slidesharecdn.com/ijifrsection2october2016-161107013634/85/IJIFR-VOLUME-4-ISSUE-2-SECTION-2-OCTOBER-2016-146-320.jpg)
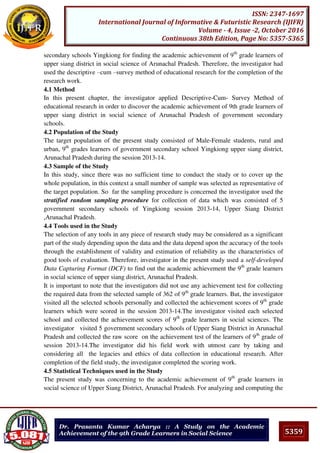
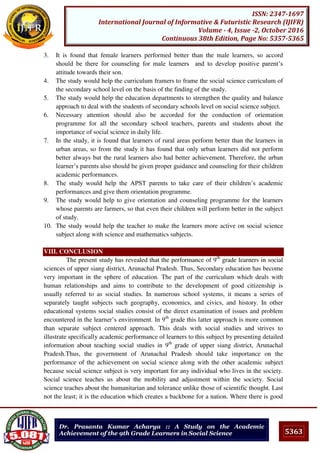
![5365
ISSN: 2347-1697
International Journal of Informative & Futuristic Research (IJIFR)
Volume - 4, Issue -2, October 2016
Continuous 38th Edition, Page No: 5357-5365
Dr. Prasanta Kumar Acharya :: A Study on the Academic
Achievement of the 9th Grade Learners in Social Science
24. NCERT (Ed) (1997): Fifth Survey of Educational Research and Training. Volume – I. New
Delhi.
25. NCERT (2000): Sixth Survey of Educational Research (1988-92) Abstract. National Council of
Educational Research and Training. Volume –II; New Delhi.
26. : NCERT (2006):Sixth Survey of Educational Research 1993- 2009, Volume – I. NCERT, New
Delhi.
27. NCERT (2006): Indian Educational Abstract. National Council of Educational Research and
Training. Volume – 6(2), July; New Delhi.
28. Osik, W.W.(1990): Early Education in Arunachal Pradesh; An article in Arunachal review.
29. Padhi Soubhagya Ranjen (2011): Educational Scenario of Tribals in India, Current Issues and
Concerns, Manglam Publishers and distributions, Delhi.
30. Pandva, R.P.(2010) : Educational Research. APH Publishing Corporation, 4435-36/7, Ansari
Road, Daryaganj, New Delhi – 110002
31. Arunachal Pradesh Human Development Report (2005): Department of Planning, Government
of Arunachal Pradesh, Itanagar.
32. Arunachal Pradesh as the Move (2008): Directorate of Information Public Relations and
Printing, Government of Arunachal Pradesh-791110.
33. Education Commission Report (1964 – 66): Education & National Development, Ministry of
Education, Government of India. New Delhi.
34. Government of India: National Policy of Education-1986, Ministry of Human Resource
Development, Govt of India, New Delhi
To Cite This Paper
[1]
Acharya, K.P. (2016): “A Study on the Academic Achievement of the 9th Grade
Learners in Social Science” International Journal of Informative & Futuristic
Research (ISSN: 2347-1697), Vol. 4 No. (2), October 2016, pp. 5357-5365, Paper
ID: IJIFR/V4/E2/066.](https://image.slidesharecdn.com/ijifrsection2october2016-161107013634/85/IJIFR-VOLUME-4-ISSUE-2-SECTION-2-OCTOBER-2016-155-320.jpg)
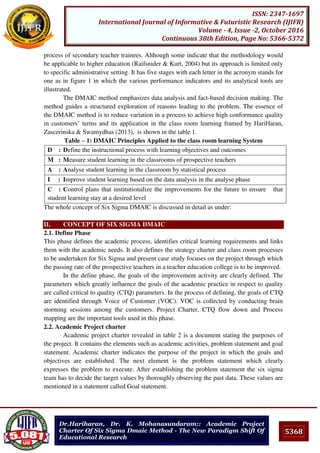
![5371
ISSN: 2347-1697
International Journal of Informative & Futuristic Research (IJIFR)
Volume - 4, Issue -2, October 2016
Continuous 38th Edition, Page No: 5366-5372
Dr.Hariharan, Dr. K. Mohanasundaram:: Academic Project
Charter Of Six Sigma Dmaic Method - The New Paradigm Shift Of
Educational Research
level which is the way to calculate the sigma level or yield of a process is determined using
process capability analysis. Minitab software may be used for analysing the data and it
generates a process capability report.In the present case, a survey is conducted among the
prospective teachers on the basis of collection opinion method through check lists. This is
the most appropriate way of finding the Key Critical Factors (KCF) of a teacher training
college which directly or indirectly affects the passing rate of the students. The procedure
followed is enumerated:
As the academic process has found the key critical factors of the institute so we are
opting for the student system. Being students this would be most appropriate to collect
the data.
The student performance will be adjudged in the most important fields like class room
learning.
A survey will be conducted among the students to categorize the degree of importance
of various factors of learning.
The learning deficiencies and some key performance areas will be located in sub-
systems like home environment and assigned weightage according to the importance.
2.5 Improve phase
Improve the process to remove cause of defects. The optimal solution for reducing
mean and variation is determined and confirmed in improve phase. The gains from the
improve phase are immediate and are corrective in nature. Specific problem identified
during analysis are attended in improve phase. This phase involves improving process
performance characteristics for achieving desired results and goals.
2.6 Control phase
This phase requires the process conditions to be properly documented and monitored
through statistical process control methods. After achieving the desired level of Sigma in the
learning stage of DMAIC cycle, there is a continuous control of the process. The control
phase aims to institutionalize the improvement results from six sigma methods through
documentation and standardization of the new procedures. It includes the setting up of
monitoring and process control systems. Control charts are used to monitor the system
performance. In the control phase control charts are prepared in respect of CTQs to sustain
the quality improvement
III. CONCLUSION
The academic six sigma as a comprehensive and flexible system of achieving,
sustaining and maximizing the process outcome through adopting the societal needs,
efficient use of facts, statistical quality control principles and attaining the objectives
through effortful consideration to manage, improve and reinventing the educational process
(Hari Haran & Mohanasundaram, 2013 ).
IV. REFERENCES
[1] Brue, G. (2003), Six Sigma for managers, Delhi, Tata McGraw hill, Fourth edition.](https://image.slidesharecdn.com/ijifrsection2october2016-161107013634/85/IJIFR-VOLUME-4-ISSUE-2-SECTION-2-OCTOBER-2016-161-320.jpg)
![5372
ISSN: 2347-1697
International Journal of Informative & Futuristic Research (IJIFR)
Volume - 4, Issue -2, October 2016
Continuous 38th Edition, Page No: 5366-5372
Dr.Hariharan, Dr. K. Mohanasundaram:: Academic Project
Charter Of Six Sigma Dmaic Method - The New Paradigm Shift Of
Educational Research
[2] Eugene, L.Grant., & Richards, S.Leawenwoth. (2000). Statistical quality control. New York:
The McGraw-Hill companies, Inc.
[3] Hariharan, R.& Mohanasundaram ,K.(2013 a). Impact of Six Sigma – DMAIC Approach in
Learning the ICT Concept by the Prospective Teachers. Book of abstracts of the
Association for Teacher Education in Europe Spring Conference 2013: Teacher of the 21st
Century: International conference Quality Education for Quality Teaching, p. 31, Riga,
Latvia. May 10-11, 2013.
[4] Hariharan, R., & Mohanasundaram, K. (2013 b).Quality analysis of teacher educative
process by six sigma based relational data base model. Book of abstracts of the International
conference on Learning and Teaching 2013:Transforming Learning and Teaching to meet
challenges of 21st centuryEducation : p.65,Taylors University,Grand Slam, Sha Alam,
Malaysia.
[5] Hariharan, R., Zascerinska, J., & Swamydhas.P. (2013). A Comparative Study of
Methodologies of Teaching Web Technologies to Prospective Teachers in India and Latvia.
International Journal of Modern Education Forum (IJMEF).Volume 2 Issue 4, November
2013.p.84-91. U.S.A. Science and Engineering Publishing Company (SEP).
[6] Hariharan, R., (2015). Impact of Six Sigma – DMAIC approach in learning the concepts of
ICT education by secondary teacher trainees. An unpublished thesis submitted to
Manonmaniam Sundaranar University, Tirunelveli.
[7] Shewhart, W. A. (1939). Statistical Method from the Viewpoint of Quality Control.
Washington, The Graduate School, Department of Agriculture.
[8] Shina, S. G. (2002). Six Sigma for Electronics Design and Manufacturing, New York,
McGraw-Hill.
[9] Small, B.B. Chairman Writing Committee, (1956). Statistical Quality Control Handbook,
Western Electric Company, Mack Printing Company Easton, PA.
[10] Xingxing, Zu., Lawrence, D, Fredendall., Thomas., & Douglas, J. (2008). The evolving
theory of quality management: The role of Six Sigma. Journal of Operations Management
26 (2008) 630–650. doi:10.1016/j.jom.2008.02.001
To Cite This Paper
[1]
Hariharan, Mohanasundaram K. (2016): “Academic Project Charter Of Six
Sigma Dmaic Method - The New Paradigm Shift Of Educational Research”
International Journal of Informative & Futuristic Research (ISSN: 2347-1697),
Vol. 4 No. (2), October 2016, pp. 5366-5372, Paper ID: IJIFR/V4/E2/063.](https://image.slidesharecdn.com/ijifrsection2october2016-161107013634/85/IJIFR-VOLUME-4-ISSUE-2-SECTION-2-OCTOBER-2016-162-320.jpg)
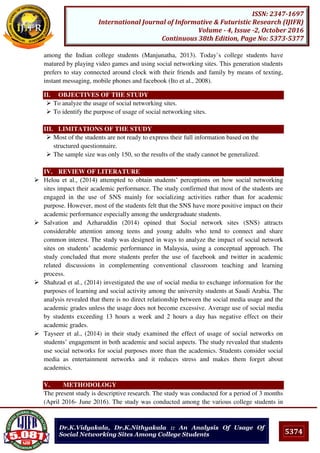
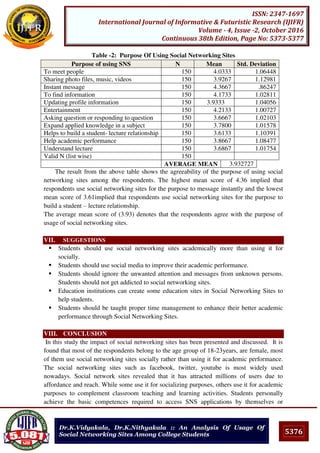
![5377
ISSN: 2347-1697
International Journal of Informative & Futuristic Research (IJIFR)
Volume - 4, Issue -2, October 2016
Continuous 38th Edition, Page No: 5373-5377
Dr.K.Vidyakala, Dr.K.Nithyakala :: An Analysis Of Usage Of
Social Networking Sites Among College Students
through friends. They open accounts for themselves, post photos or even video and audio,
exchange messages, and build groups of interest.
IX. REFERENCES
[1] Helou, Rahim and Oye 2012 “Students’ Perceptions on Social Networking Sites Influence on
Academic Performance”, International Journal of Social Networking and Virtual Communities,
Vol. 1, No. 1, pp. 7~15 ISSN: 2252-8784.
[2] Salvation and Adzharuddin 2014, “The Influence of Social Network Sites (SNS) upon
Academic Performance of Malaysian Students” International Journal of Humanities and Social
Science Vol. 4, No. 10(1).
[3] Esam Alwagait, Basit Shahzad, Sophia Alim “Impact of social media usage on students’
academic performance in Saudi Arabia” Recent Advances in Electrical Engineering and
Educational Technologies pp. 211-214, October 2014
[4] Tayseer, Zoghieb, Alcheikh, Awadallah 2014,” Social Network: Academic and Social Impact
on College Students”, ASEE 2014 Zone I Conference, April 3-5, 2014.
[5] Afendi Hamat, Mohamed Amin Embi, Haslinda Abu Hassan 2012, “The use of social
networking sites among Malaysian university Students”. International Education Studies,
Vol.5, No. 3, Pp. 56- 66. 28 July, 2013
[6] Manjunatha, S “The Usage of Social Networking Sites among the College Students in India”,
International Research Journal of Social Sciences, Vol.2, No.5, Pp.15-21, May 2013.
[7] Ito, M., Baumer, S., Bittanti, M., boyd, d., Cody, R., & Herr-Stephenson, B.Living and learning
with new media, Summary of findings from the digital youth project. Cambridge, MA: MIT
Press 2009.
To Cite This Paper
[1]
Vidyakala, K., Nithyakala, K. (2016): “An Analysis Of Usage Of Social
Networking Sites Among College Students” International Journal of Informative
& Futuristic Research (ISSN: 2347-1697), Vol. 4 No. (2), October 2016, pp. 5373-
5377, Paper ID: IJIFR/V4/E2/067.](https://image.slidesharecdn.com/ijifrsection2october2016-161107013634/85/IJIFR-VOLUME-4-ISSUE-2-SECTION-2-OCTOBER-2016-167-320.jpg)