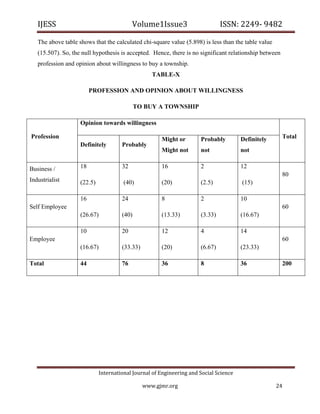
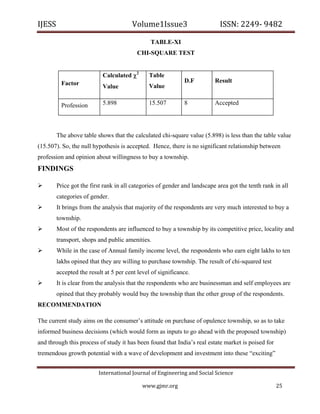
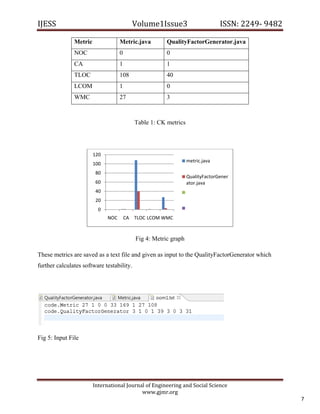
The document discusses various aspects of software quality measurement through CK metrics, emphasizing methods such as Weighted Methods per Class (WMC), Depth of Inheritance Tree (DIT), and Coupling Between Object Classes (CBO) to evaluate software testability. Additionally, it highlights the burgeoning real estate sector in India, illustrating its growth influenced by factors like government policies, urbanization, and consumer preferences towards affordable housing. The research aims to provide insights for industry practitioners on software testability and consumer behavior in real estate development.
![IJESS Volume1Issue3 ISSN: 2249‐ 9482
methods or instance variables of another object by the object of the class whose reusability is to
be measured. As Coupling between Object classes increases, reusability decreases and it becomes
harder to modify and test the software system. So there is the need to set some maximum value
of coupling level for its reusability. If the value of CBO for a class is beyond that maximum
value then the class is said to be non-reusable. It is the number of methods that can be triggered
by a message sent to an object.
Software Testability:
Software testability is affected by many different factors, including the required validity, the
process and tools used and the representation of the requirements. Voas et. al. [27] defines
software testability as the probability that a piece of software will fail on its next execution
during testing, provided it contains a fault. This fault sensitivity is obtained by multiplying the
probabilities that
(1) the location containing the fault is executed;
(2) the fault corrupts the program’s state; and
(3) the corrupted state gets propagated to the output.
High fault sensitivity indicates high testability and vice versa. The effort required to test a
program to ensure that it performs its intended function. Thus testability is also measured in form
of testability effort. The effect of values of CK metrics on testability is defined in the principles
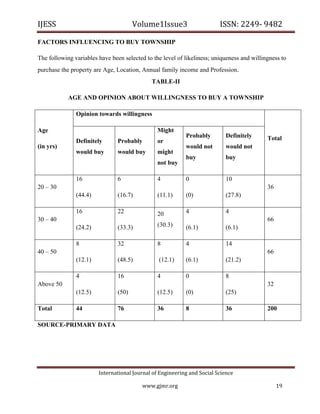
below:
Principles for measuring Testability are:
1. LOC, the larger the size of a class, more effort is required to test a class.
2. WMC, more the methods in a class, more difficult it is to test the class.
3. DIT, greater is the inheritance tree, more testing effort is required.
4. NOC, more no. of children more will be the testing effort.
5. CA, increased complexity will increase testability of the software.
International Journal of Engineering and Social Science
www.gjmr.org
4](https://image.slidesharecdn.com/ijesscomplimentarycopyvol1issue3-120425050747-phpapp01/85/Ijess-complimentary-copy-vol1issue3-5-320.jpg)
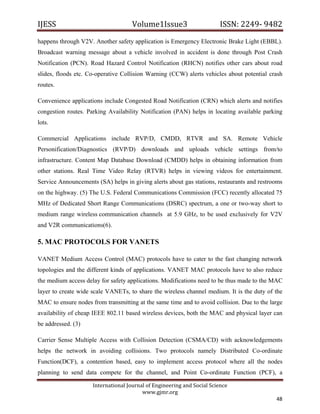
![IJESS Volume1Issue3 ISSN: 2249‐ 9482
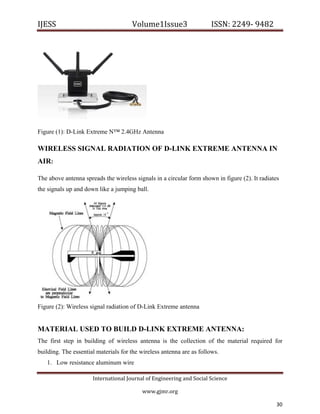
Fig 6: Software Testability
5. CONCLUSION:
The framework proposed in the paper will address testability during software development life
cycle. It may help putting testability benchmarking of software projects. The framework is
generic in nature, and may be used by industry practitioners to quantify testability in order to
make design decisions early in the development life cycle. In future, we have to emphasize on
more testability characteristics. We will introduce more software metrics too calculate testability
accurately.
6. REFERENCES:
[1]R. A. Khan, K. Mustafa, I Ahson, “An Empirical Validation of Object Oriented Design
Quality Metrics, Journal King Saud University, Computer & Information Science, Vol. 19, pp.
1-16, Riyadh (1427H/2007).
[2] Jungmayr, S. Testability Measurement and Software Dependencies. In Proceedings of the
12th International
Workshop on Software Measurement, pp. 179–202, October 2002.
[3]Bertolino, A., and Strigini, L., “On the Use of Testability Measures for Dependability
Assessment”, IEEE Transactions on Software Engineering, VOL. 22, NO. 2, February 1996.
[4] McCall, J. A., Richards, P. K., and Walters, G. F., “Factors in Software Quality”, Nat’l Tech.
Information Service, no. Vol. 1, 2 and 3, 1977.
[5]Booch, G., Object Oriented Design with Applications. Redwood City, CA: Benjamin/
Cummings, 1991.
[6]P. Coad and E. Yourdon, Object-Oriented Design. Englewood Cliffs, NJ: Prentice-Hall, 1991.
International Journal of Engineering and Social Science
www.gjmr.org
8](https://image.slidesharecdn.com/ijesscomplimentarycopyvol1issue3-120425050747-phpapp01/85/Ijess-complimentary-copy-vol1issue3-9-320.jpg)
![IJESS Volume1Issue3 ISSN: 2249‐ 9482
[7]Magiel Bruntink, Arie van Deursen, “Predicting Class Testability using Object-Oriented
Metrics” Proceedings of the Fourth IEEE International Workshop on Source Code Analysis and
Manipulation (SCAM’04), pp 1-10, 2004
International Journal of Engineering and Social Science
www.gjmr.org
9](https://image.slidesharecdn.com/ijesscomplimentarycopyvol1issue3-120425050747-phpapp01/85/Ijess-complimentary-copy-vol1issue3-10-320.jpg)