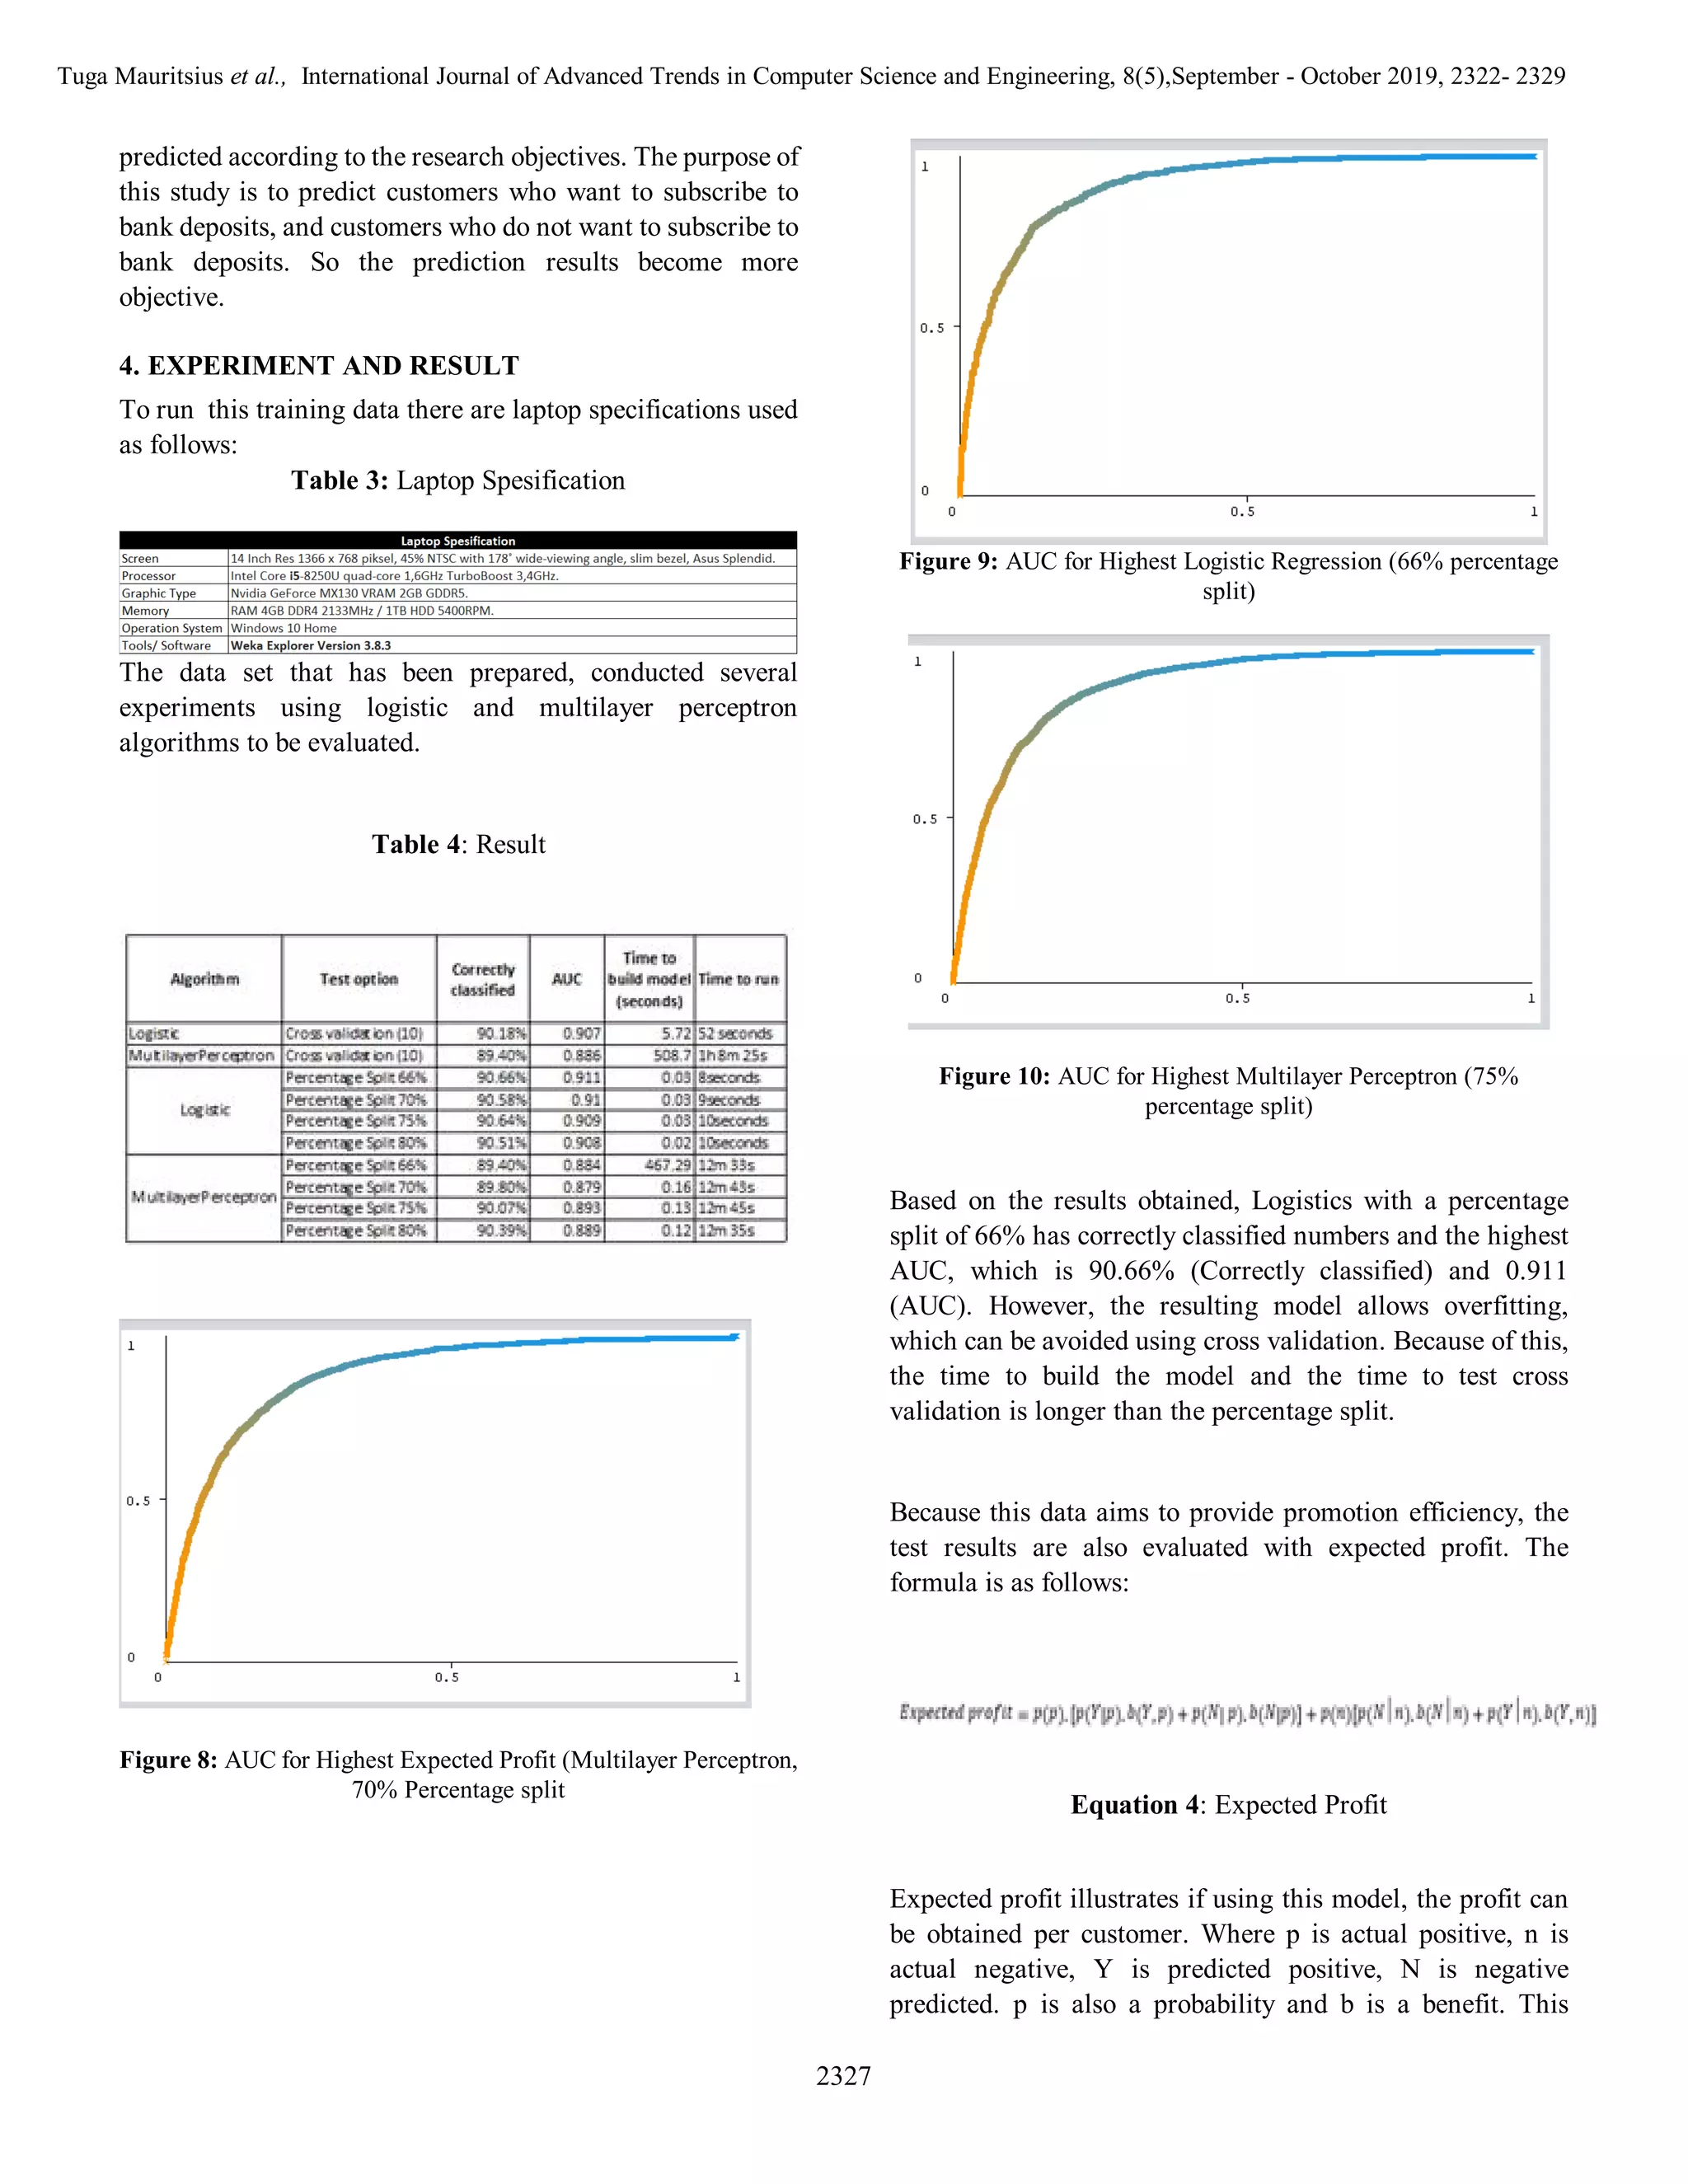
This paper aims to build predictive models using the CRISP-DM framework to classify bank customers into predefined classes using a Portuguese marketing campaign dataset. It analyzes bank customer data containing over 45,000 instances and 16 features to classify customers as likely or not likely to subscribe to bank deposits. It uses multilayer perceptron and logistic regression algorithms for modeling. The results show that the multilayer perceptron model with a 70% training split provides the best average performance, accurately classifying customers 70% of the time.
![Tuga Mauritsius et al., International Journal of Advanced Trends in Computer Science and Engineering, 8(5),September - October 2019, 2322- 2329
2326
2)Data Understanding
Bank Marketing data is obtained from the site kaggle.com.
The type of data in this paper is supervised. Because, there
are variables that are intended as the purpose of grouping
data into existing data. Data samples that are entitled to
receive 45211 instances. The algorithm used is logistical and
multilayer-perceptron. And there are 16 features and 1 class
(Y) . Data can be seen from the following table:
Table 2: Metadata
3)Data Preparation
In the data preparation phase, the data is prepared for the
training process. The data itself consists of 45211 instances
and consists of nominal and numerical. First, using Weka, it
makes the ’s provided filter. First we randomize the instances
to shuffle the order of instances passed through it. Next, we
normalize all the numeric values in the given dataset so the
resulting values are in [0,1].
4)Modeling
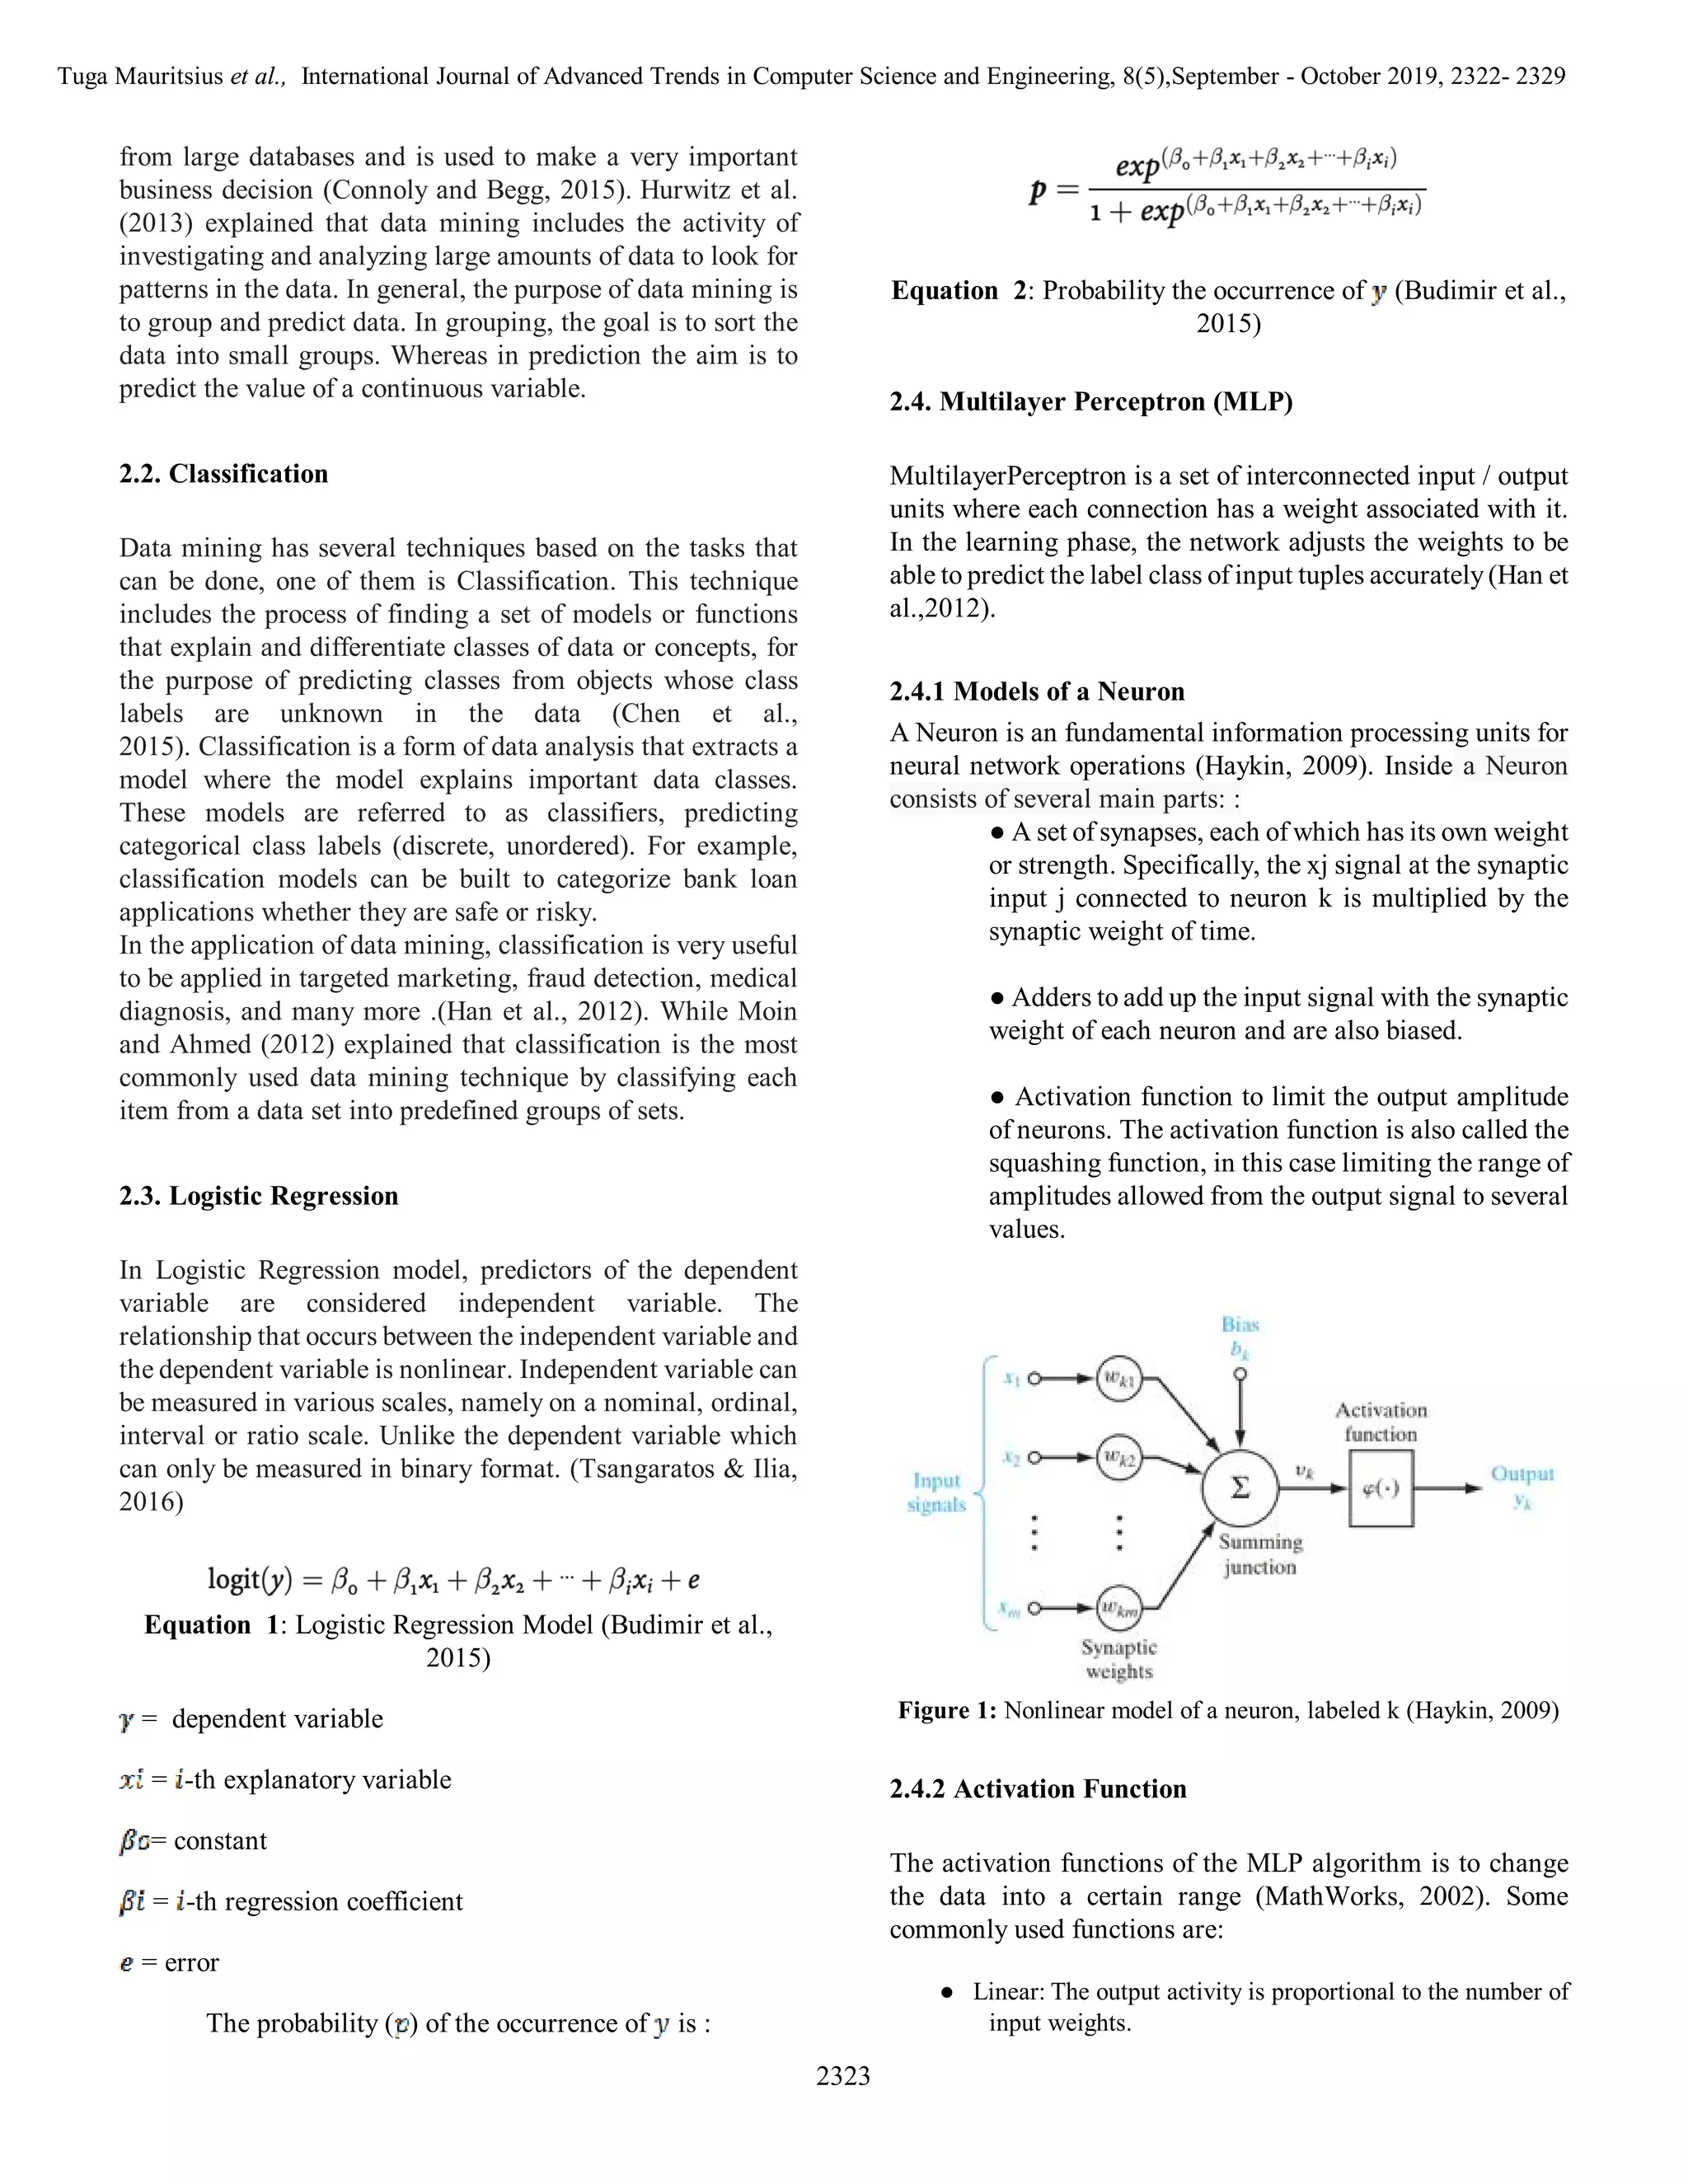
The algorithm used in this training data is Logistics and
Multilayer Perceptron. By using the Logistics algorithm, the
results of the training data can produce the following values:
● Can calculate opportunities.
Based on the objectives of the training data in this
study, the Bank Marketing wants to calculate the
opportunities of customers who want to subscribe to
deposits, if it is known how big the opportunities are,
the customers will be contacted by the Bank
Marketing and will be asked questions about the
variable characteristics of prospective customers
who want to subscribe to deposits.
● Able to see data characteristics
In this training data the Bank Marketing wants to see
the type of customer. First, customer who wants to
subscribe to deposits and customers who do not want
to subscribe to deposits.
● Can find out the influencing factors of both groups
By using Logistics, Bank Marketing can find out
what are the factors of the two customer’s
characteristics.
Whereas the purpose of using the Multilayer Perceptron
algorithm is to search according to the level of accuracy.
MultiLayer Perceptron is able to detect or analyze problems
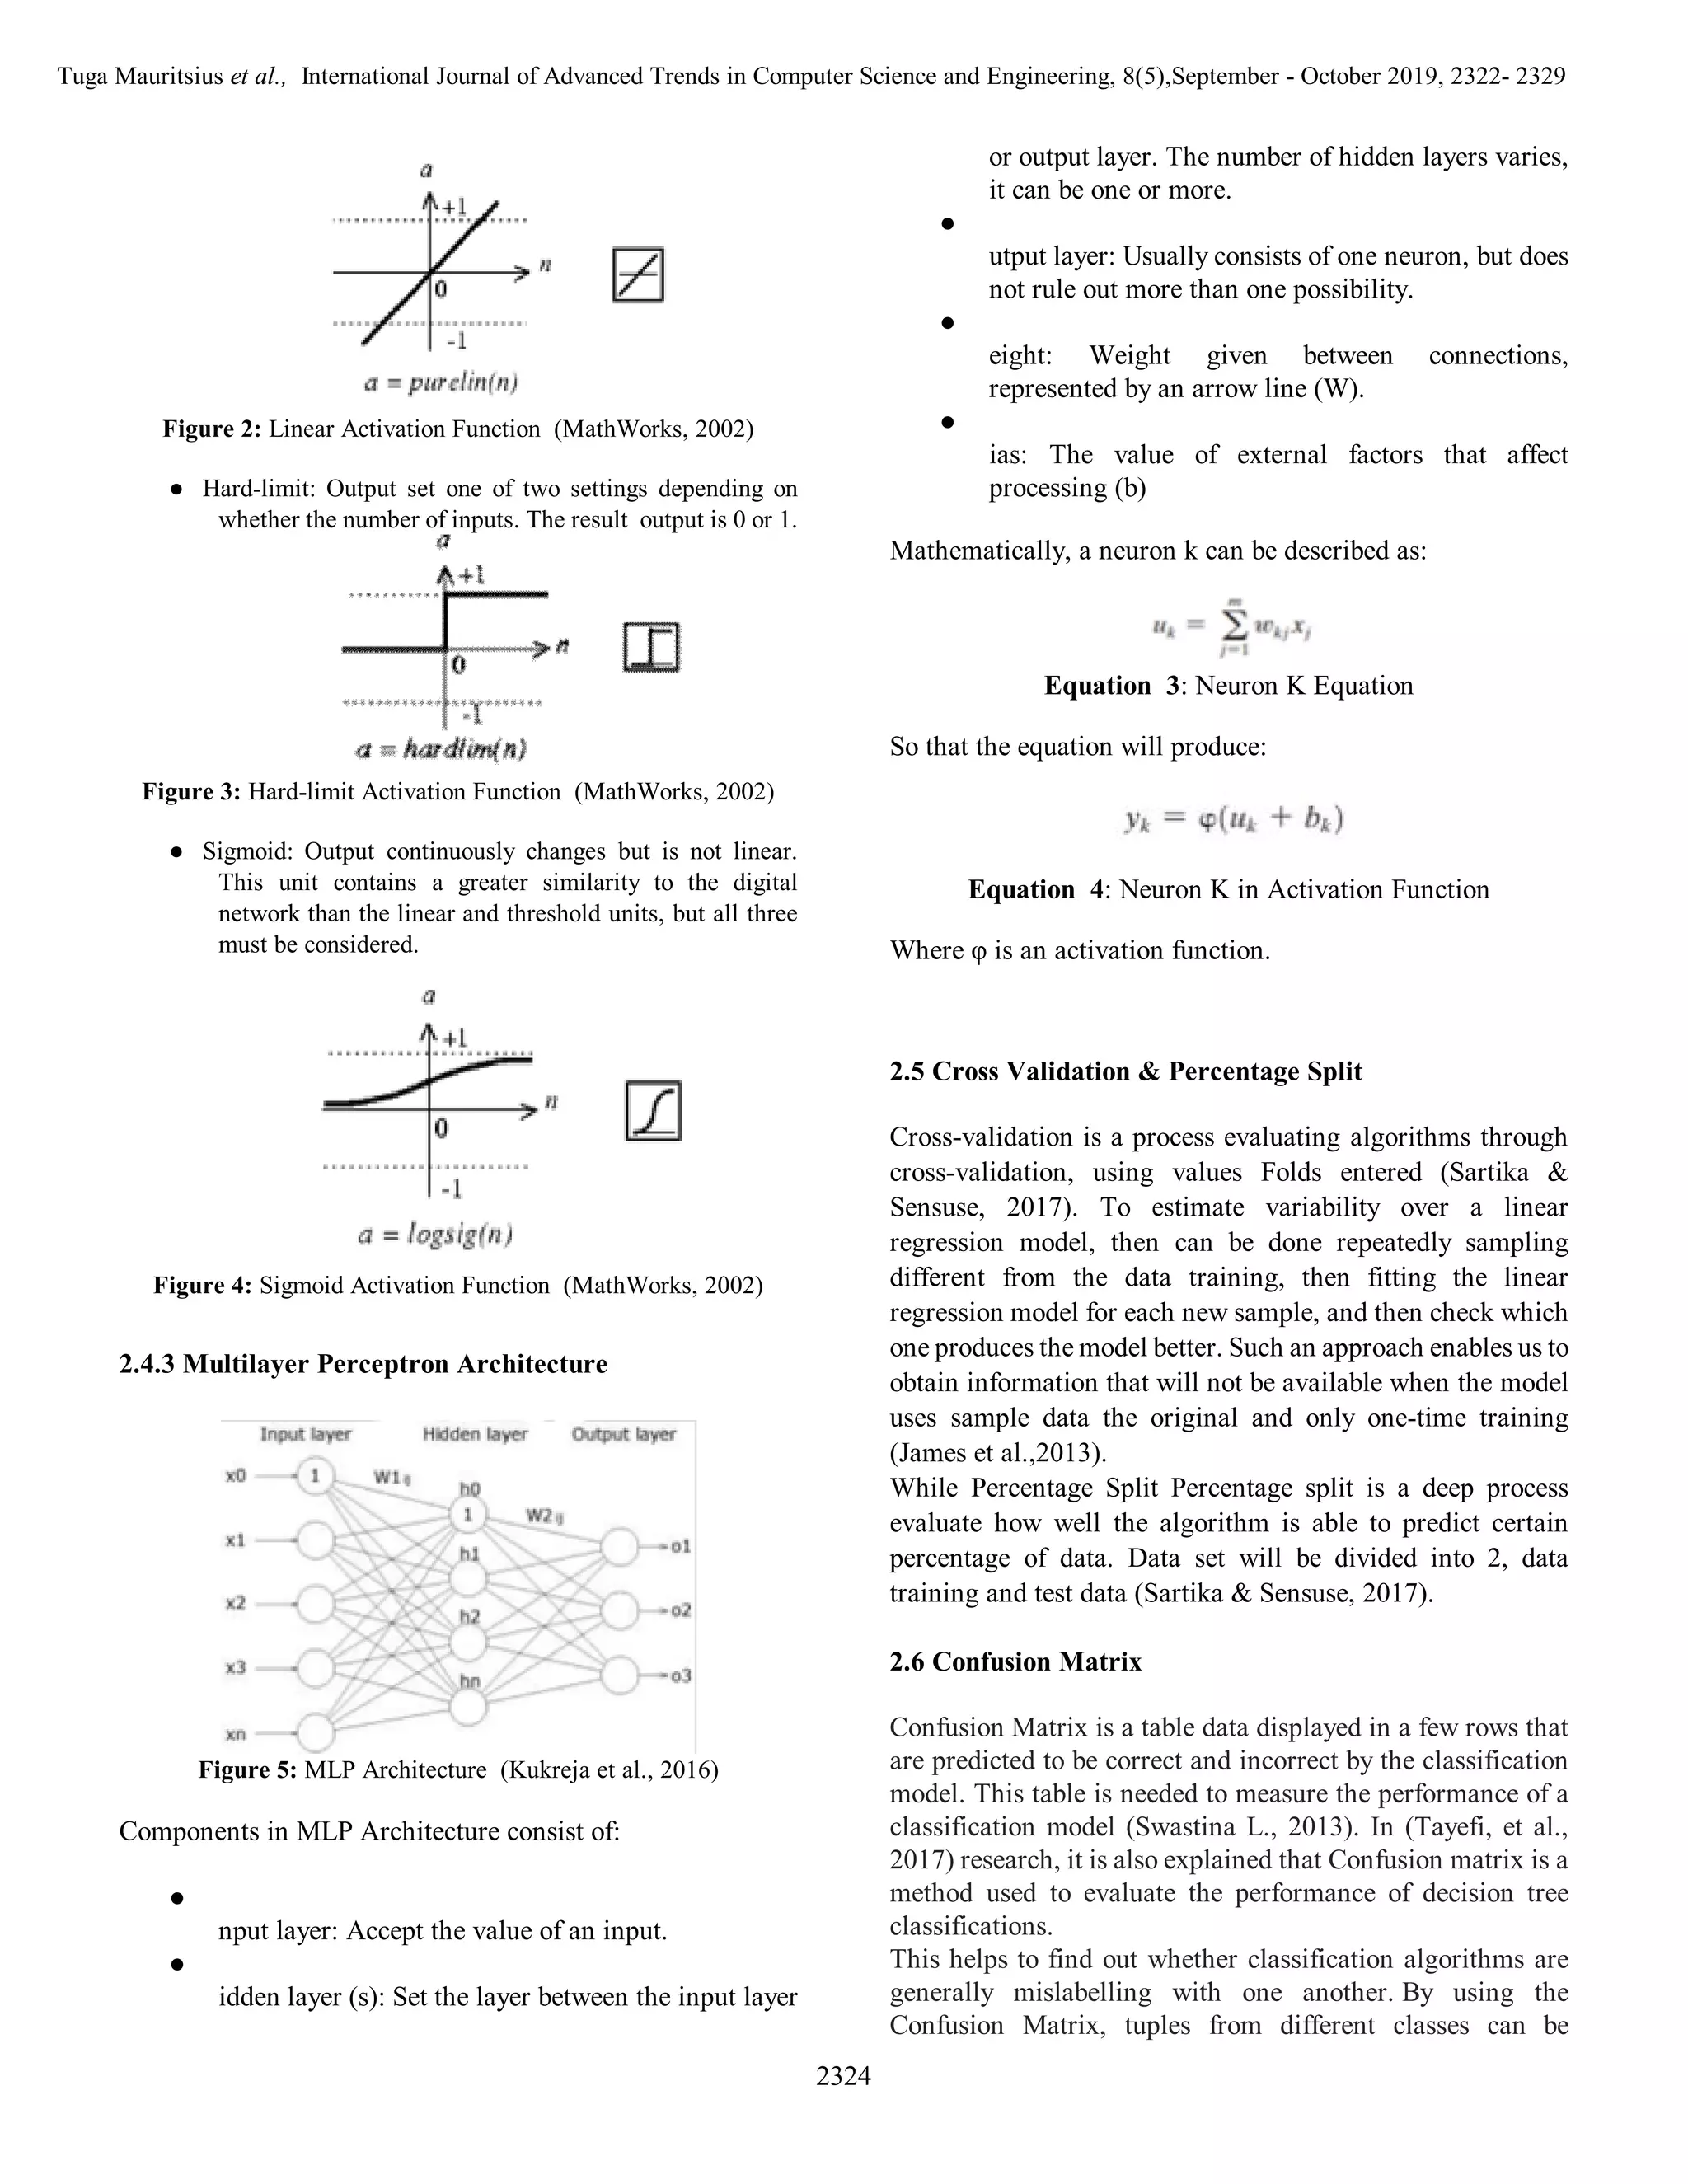
that are very complex In the multilayer perceptron, the
number of hidden layers is used according to the formula:
Equation 5: Hidden Layer Fornula
So there are 8 hidden layers and there are also 26 units in it.
To determine, carried out trial and error. Here is the
simplified
architecture:
Figure 7: Multilayer Perceptron Architecture
5)Evaluation
At the evaluation phase, based on the algorithm (Logistic and
MultilayerPerceptron) and the selected test options (Cross
Validation and Percentage Split), a comparison is made in
order to choose which is most appropriate. This is assessed
from the results of correctly classified, confusion matrix,
AUC, and expected profit.
6)Deployment
After conducting training data from the phases above, in this
deployment phase the results of the training data can be](https://image.slidesharecdn.com/ijatcse71852019-220222095455/75/Ijatcse71852019-5-2048.jpg)


![[DSC Europe 25] Aleksandra Dragicevic - AI-Boosted Research in Healthcare: Fr...](https://cdn.slidesharecdn.com/ss_thumbnails/iqwngszurf2r7pi1lnnj-4-aleksandra-dragicevic-ad-dsc-europe-conference-20-251208151905-37c3238a-thumbnail.jpg?width=640&height=640&fit=bounds)
![[DSC Europe 25] Milan Sekuloski - Data, Defence, and Development: Cybersecuri...](https://cdn.slidesharecdn.com/ss_thumbnails/dfrkwwx4qly6atqpbl4z-4-251209104645-c3d4b0ca-thumbnail.jpg?width=640&height=640&fit=bounds)

![[DSC Europe 25] Debmalya Biswas - Agentification: the art of transforming man...](https://cdn.slidesharecdn.com/ss_thumbnails/r5azlggvtqiaiiusrqdr-4-251212103249-5a12c89b-thumbnail.jpg?width=640&height=640&fit=bounds)
![[DSC Europe 25] Kaja Kandare - LLM as a judge.pptx](https://cdn.slidesharecdn.com/ss_thumbnails/arxyccaxsdsd1ba99wjw-7-251212104007-2b4e3f64-thumbnail.jpg?width=640&height=640&fit=bounds)
![[DSC Europe 25] Jovan Bogicevic - Legacy to AI-Driven Defense: Transforming D...](https://cdn.slidesharecdn.com/ss_thumbnails/rsarluadt563hntyfc8q-3-251211083849-3e7bc4c0-thumbnail.jpg?width=640&height=640&fit=bounds)
![[DSC Europe 25] Dusan Nesic - Securing Tomorrow’s Infrastructure: Why Cyber-P...](https://cdn.slidesharecdn.com/ss_thumbnails/qikbszfftyowjm2q6duw-1-251211083848-8f2ead6b-thumbnail.jpg?width=640&height=640&fit=bounds)
![[DSC Europe 25] Milan Zdravkovic - The road less traveled in District Heating...](https://cdn.slidesharecdn.com/ss_thumbnails/nfaboniqwsz4ucyctnmy-2-milan-zdravkovic-dsc2025-the-road-less-traveled-in-district-heating-operation-251208151905-f56388a5-thumbnail.jpg?width=640&height=640&fit=bounds)

![[DSC Europe 25] Bogdan Daniel Maruneac - AI - It starts with you.pptx](https://cdn.slidesharecdn.com/ss_thumbnails/odov3snhrcqs9hx5ny2n-4-251205085715-f1daacfe-thumbnail.jpg?width=640&height=640&fit=bounds)
![[DSC Europe 25] Goran Obradovic - The Rise of Sovereign AI: Building the Regi...](https://cdn.slidesharecdn.com/ss_thumbnails/7nw2xxixrxqdxvrb5wca-6-251205085714-ab09a2ac-thumbnail.jpg?width=640&height=640&fit=bounds)


![[DSC Europe 25] Sara Polak - The Ancient Operating System: What Archaeology T...](https://cdn.slidesharecdn.com/ss_thumbnails/3vch2p6tttdnwhsgazoz-3-sara-polak-smart-cities-251208152532-64404202-thumbnail.jpg?width=640&height=640&fit=bounds)
