
Uploaded byGabriela Grosseck
Identifying students’ profiles for MOOCs – a social media analysis
This document analyzes survey responses from 632 students in Romania about their participation in Massive Open Online Courses (MOOCs). The author uses complex network analysis to model the students as a graph based on their shared traits and reasons for engaging with MOOCs. Six distinct profiles of students who participate in MOOCs are identified from the graph's community structure. The profiles differ based on gender and traits like certification goals, recognition priorities, and motivation types. The analysis provides insight into how students relate to online education and how MOOC design could be optimized for different profiles.
More Related Content


Similar to Identifying students’ profiles for MOOCs – a social media analysis


More from Gabriela Grosseck


Identifying students’ profiles for MOOCs – a social media analysis
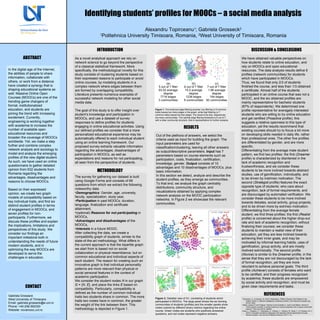
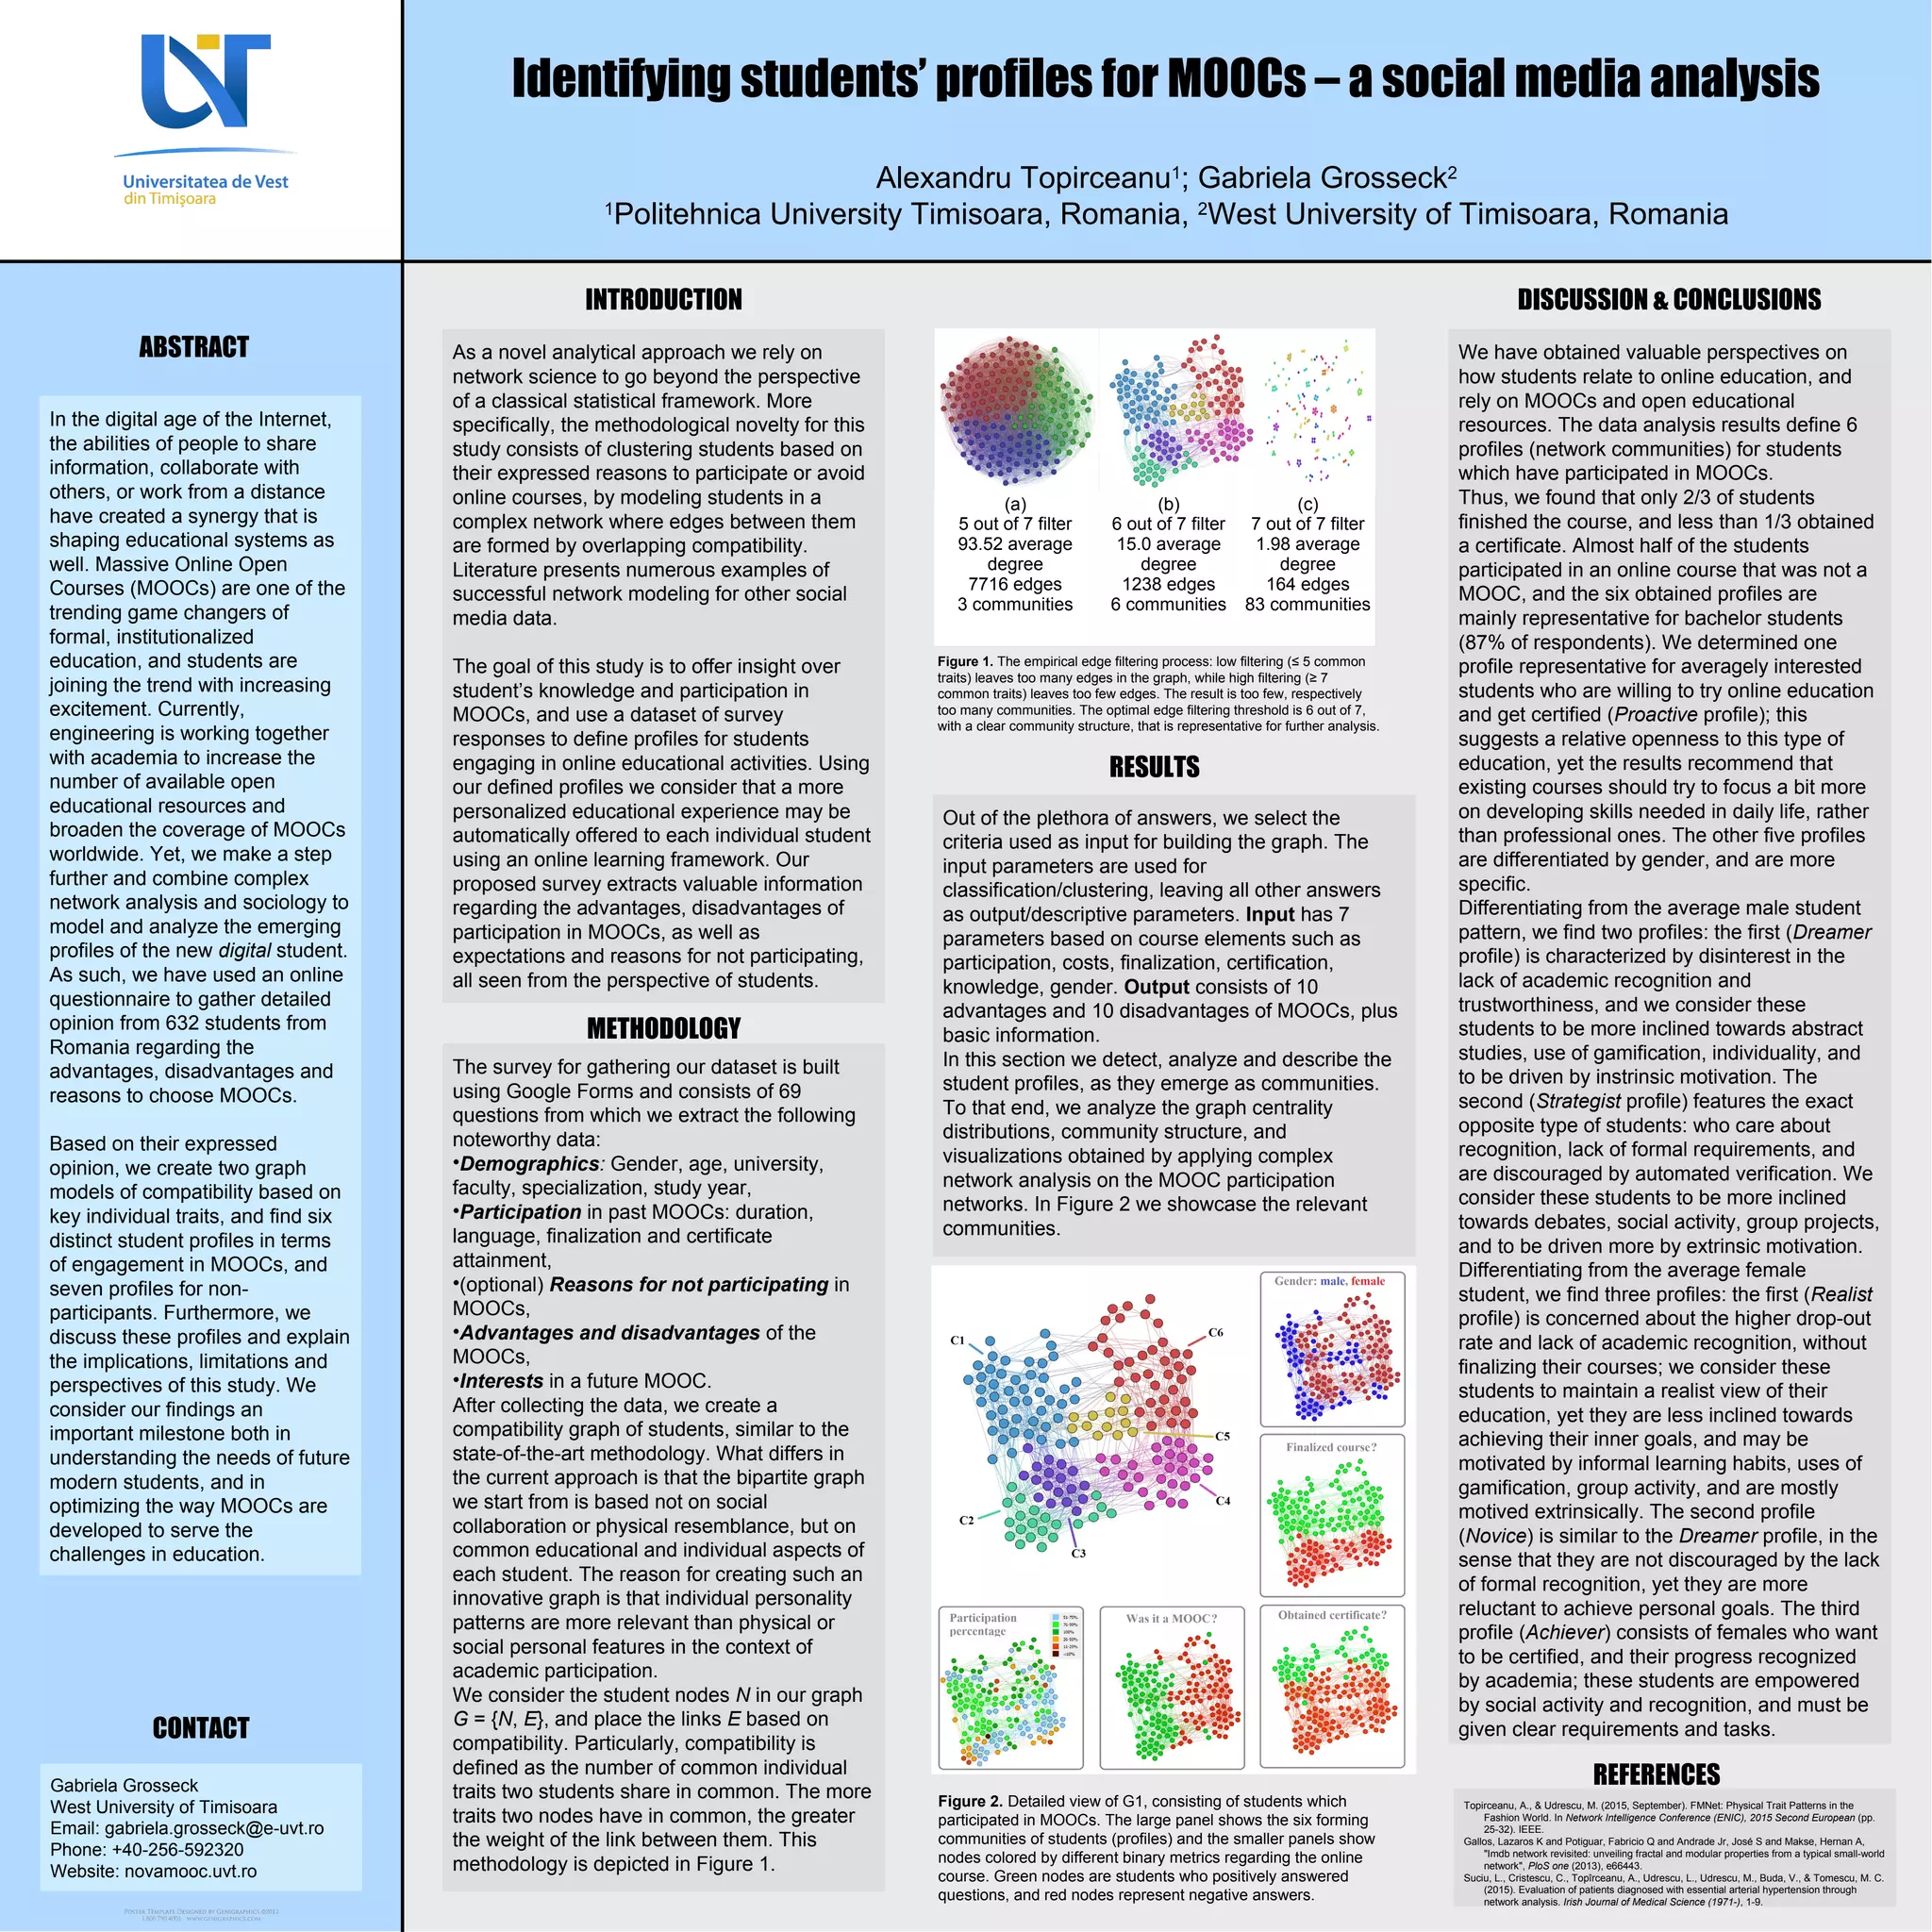
- 1. In the digitalage of the Internet, the abilities of people to share information, collaborate with others, or work from a distance have created a synergy that is shaping educational systems as well. Massive Online Open Courses (MOOCs) are one of the trending game changers of formal, institutionalized education, and students are joining the trend with increasing excitement. Currently, engineering is working together with academia to increase the number of available open educational resources and broaden the coverage of MOOCs worldwide. Yet, we make a step further and combine complex network analysis and sociology to model and analyze the emerging profiles of the new digital student. As such, we have used an online questionnaire to gather detailed opinion from 632 students from Romania regarding the advantages, disadvantages and reasons to choose MOOCs. Based on their expressed opinion, we create two graph models of compatibility based on key individual traits, and find six distinct student profiles in terms of engagement in MOOCs, and seven profiles for non- participants. Furthermore, we discuss these profiles and explain the implications, limitations and perspectives of this study. We consider our findings an important milestone both in understanding the needs of future modern students, and in optimizing the way MOOCs are developed to serve the challenges in education. Identifying students’ profiles for MOOCs – a social media analysis Alexandru Topirceanu1 ; Gabriela Grosseck2 1 Politehnica University Timisoara, Romania, 2 West University of Timisoara, Romania Out of the plethora of answers, we select the criteria used as input for building the graph. The input parameters are used for classification/clustering, leaving all other answers as output/descriptive parameters. Input has 7 parameters based on course elements such as participation, costs, finalization, certification, knowledge, gender. Output consists of 10 advantages and 10 disadvantages of MOOCs, plus basic information. In this section we detect, analyze and describe the student profiles, as they emerge as communities. To that end, we analyze the graph centrality distributions, community structure, and visualizations obtained by applying complex network analysis on the MOOC participation networks. In Figure 2 we showcase the relevant communities. We have obtained valuable perspectives on how students relate to online education, and rely on MOOCs and open educational resources. The data analysis results define 6 profiles (network communities) for students which have participated in MOOCs. Thus, we found that only 2/3 of students finished the course, and less than 1/3 obtained a certificate. Almost half of the students participated in an online course that was not a MOOC, and the six obtained profiles are mainly representative for bachelor students (87% of respondents). We determined one profile representative for averagely interested students who are willing to try online education and get certified (Proactive profile); this suggests a relative openness to this type of education, yet the results recommend that existing courses should try to focus a bit more on developing skills needed in daily life, rather than professional ones. The other five profiles are differentiated by gender, and are more specific. Differentiating from the average male student pattern, we find two profiles: the first (Dreamer profile) is characterized by disinterest in the lack of academic recognition and trustworthiness, and we consider these students to be more inclined towards abstract studies, use of gamification, individuality, and to be driven by instrinsic motivation. The second (Strategist profile) features the exact opposite type of students: who care about recognition, lack of formal requirements, and are discouraged by automated verification. We consider these students to be more inclined towards debates, social activity, group projects, and to be driven more by extrinsic motivation. Differentiating from the average female student, we find three profiles: the first (Realist profile) is concerned about the higher drop-out rate and lack of academic recognition, without finalizing their courses; we consider these students to maintain a realist view of their education, yet they are less inclined towards achieving their inner goals, and may be motivated by informal learning habits, uses of gamification, group activity, and are mostly motived extrinsically. The second profile (Novice) is similar to the Dreamer profile, in the sense that they are not discouraged by the lack of formal recognition, yet they are more reluctant to achieve personal goals. The third profile (Achiever) consists of females who want to be certified, and their progress recognized by academia; these students are empowered by social activity and recognition, and must be given clear requirements and tasks. The survey for gathering our dataset is built using Google Forms and consists of 69 questions from which we extract the following noteworthy data: •Demographics: Gender, age, university, faculty, specialization, study year, •Participation in past MOOCs: duration, language, finalization and certificate attainment, •(optional) Reasons for not participating in MOOCs, •Advantages and disadvantages of the MOOCs, •Interests in a future MOOC. After collecting the data, we create a compatibility graph of students, similar to the state-of-the-art methodology. What differs in the current approach is that the bipartite graph we start from is based not on social collaboration or physical resemblance, but on common educational and individual aspects of each student. The reason for creating such an innovative graph is that individual personality patterns are more relevant than physical or social personal features in the context of academic participation. We consider the student nodes N in our graph G = {N, E}, and place the links E based on compatibility. Particularly, compatibility is defined as the number of common individual traits two students share in common. The more traits two nodes have in common, the greater the weight of the link between them. This methodology is depicted in Figure 1. As a novel analytical approach we rely on network science to go beyond the perspective of a classical statistical framework. More specifically, the methodological novelty for this study consists of clustering students based on their expressed reasons to participate or avoid online courses, by modeling students in a complex network where edges between them are formed by overlapping compatibility. Literature presents numerous examples of successful network modeling for other social media data. The goal of this study is to offer insight over student’s knowledge and participation in MOOCs, and use a dataset of survey responses to define profiles for students engaging in online educational activities. Using our defined profiles we consider that a more personalized educational experience may be automatically offered to each individual student using an online learning framework. Our proposed survey extracts valuable information regarding the advantages, disadvantages of participation in MOOCs, as well as expectations and reasons for not participating, all seen from the perspective of students. INTRODUCTION METHODOLOGY Topirceanu, A., & Udrescu, M. (2015, September). FMNet: Physical Trait Patterns in the Fashion World. In Network Intelligence Conference (ENIC), 2015 Second European (pp. 25-32). IEEE. Gallos, Lazaros K and Potiguar, Fabricio Q and Andrade Jr, José S and Makse, Hernan A, "Imdb network revisited: unveiling fractal and modular properties from a typical small-world network", PloS one (2013), e66443. Suciu, L., Cristescu, C., Topîrceanu, A., Udrescu, L., Udrescu, M., Buda, V., & Tomescu, M. C. (2015). Evaluation of patients diagnosed with essential arterial hypertension through network analysis. Irish Journal of Medical Science (1971-), 1-9. DISCUSSION & CONCLUSIONS RESULTS REFERENCES ABSTRACT Gabriela Grosseck West University of Timisoara Email: gabriela.grosseck@e-uvt.ro Phone: +40-256-592320 Website: novamooc.uvt.ro CONTACT (a) 5 out of 7 filter 93.52 average degree 7716 edges 3 communities (b) 6 out of 7 filter 15.0 average degree 1238 edges 6 communities (c) 7 out of 7 filter 1.98 average degree 164 edges 83 communities Figure 1. The empirical edge filtering process: low filtering (≤ 5 common traits) leaves too many edges in the graph, while high filtering (≥ 7 common traits) leaves too few edges. The result is too few, respectively too many communities. The optimal edge filtering threshold is 6 out of 7, with a clear community structure, that is representative for further analysis. Figure 2. Detailed view of G1, consisting of students which participated in MOOCs. The large panel shows the six forming communities of students (profiles) and the smaller panels show nodes colored by different binary metrics regarding the online course. Green nodes are students who positively answered questions, and red nodes represent negative answers.