Identification and verification of QTL associated with frost tolerance using linkage mapping and genome wide association study in winter faba bean

This lecture was a part of Plant Genetics Seminars - PGS 2017/2018 at Assiut University. These seminars organized by Dr. Ahmed Sallam, Department of Genetics, Faculty of Agriculture, Assiut University Abstract Frost stress is one of the abiotic stresses that causes a significant reduction in winter faba bean yield in Europe. The main objective of this work is to genetically improve frost tolerance in winter faba bean by identifying and validating QTL associated with frost tolerance to be used in marker-assisted selection (MAS). Two different genetic backgrounds were used: a biparental population (BPP) consisting of 101 inbred lines, and 189 genotypes from single seed descent (SSD) from the Gottingen Winter bean Population (GWBP). All experiments were conducted in a frost growth chamber under controlled conditions. The symptoms of frost stress were scored. In addition, leaf fatty acid composition (FAC) was analyzed as a physiological trait in both populations. Five common QTLs for frost tolerance and FAC were found in both populations. Moreover, synteny analysis between Medicago truncatula (a model legume) and faba bean genomes was performed to identify candidate genes for the validated QTLs.

Recommended
Recommended
More Related Content
What's hot
What's hot (20)
Similar to Identification and verification of QTL associated with frost tolerance using linkage mapping and genome wide association study in winter faba bean
Similar to Identification and verification of QTL associated with frost tolerance using linkage mapping and genome wide association study in winter faba bean (20)
More from PGS
More from PGS (8)
Recently uploaded
Recently uploaded (20)
Identification and verification of QTL associated with frost tolerance using linkage mapping and genome wide association study in winter faba bean
- 1. Identification and Verification of QTL Associated with Frost Tolerance Using Linkage Mapping and Genome Wide Association Study in Winter Faba Bean Assistant Professor Department of Genetics Faculty of Agriculture Assiut University Date 25.10.2017 Published in Frontiers in Plant Science Ahmed Sallam 2017/2018 Email: amsallam@aun.edu.eg
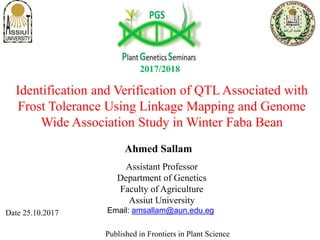
- 2. Dr. Ahmed Sallam Department of Genetics Faculty of Agriculture Assiut University Email: amsallam@aun.edu.eg O18_9900.0 K03_42810.7 A10_137623.6 K18_84643.0 J11_87454.8 K03_152965.0 K01_77678.5 B20_110591.5 U09_677102.7 U09_890114.1 J14_1319128.1 I06_1549191.6 I06_1451210.7 D932_122226.2 D15_1021235.1 C06_1070253.3 B20_580263.2 K03_1441269.5 E01_1055278.9 J15_506296.0 LG01 B20_10000.0 D850_97513.7 J16_36918.7 B13_59031.2 E09_98640.5 E12_125852.7 A10_88560.7 H08_53777.0 J14_51693.2 J14_576120.0 E12_1456134.5 AC06_100150.1 M18_1220165.9 M18_1163176.0 E09_808196.0 E09_894209.7 LG02 J15_4680.0 J16_72924.8 L19_79532.6 L05_50746.6 O18_83967.7 D850_45985.5 E20_32995.1 L03_133098.8 G18_1374112.4 E20_1556127.5 K16_1111165.4 L05_755179.0 LG03 A10_16210.0 E09_94019.5 J16_42637.1 K03_132359.7 E12_89079.6 M18_161891.0 D850_36897.2 AC06_471101.7 G18_1257106.7 D15_848115.6 M18_878120.6 H09_689135.3 LG04 B13_14240.0 U09_55113.1 K01_86728.6 E12_69039.2 B20_76250.6 D15_137159.5 B20_80370.6 U09_149987.6 E20_141295.0 U09_74698.8 I06_803116.0 J15_1226142.2 LG05 Identification and Verification of QTL Associated with Frost Tolerance Using Linkage Mapping and Genome Wide Association Study in Winter Faba Bean Wednesday, 25.10.2017
- 3. Introduction Plant materials Results & discussion Summary Part I Part II part III Part IV
- 4. Why are we interested in frost tolerance in winter beans? Due to insufficient winter-hardiness of the bean genotypes which are sown in the autumn. (Bond et al., 1994) Higher yield Better use of the moisture soil Higher tolerance against drought, pests Europe Winter beansSpring beans Drawback: the risk of winter-kill cool-temperate regions Introduction Plant materials Results & discussion Summary Part I Part II part III Part IV
- 5. • The progress in the genetic improvement of winter faba bean germplasm using classical plant breeding programs has been slow. • The effectiveness of selection was not fruitful due to genotype and environment interaction (Rama et al., 2014) • In light of the above difficulties, marker assisted-selection (MAS) accelerates the breeding programs to improve target traits • Very few studies reported QTL associated with frost tolerance in faba bean Introduction Plant materials Results & discussion Summary Part I Part II part III Part IV
- 6. • The main purpose of QTL mapping is to identify genomic regions associate with target trails • Genome wide association study (GWAS) is typically based on associations between single-nucleotide polymorphisms (SNPs) and the target trait • SNP markers https://www.google.com.eg/url?sa=i&rct=j&q=&esrc=s&sou rce=images&cd=&ved=0ahUKEwjFl5emmYnXAhXCmBoKHf PZANoQjxwIAw&url=http%3A%2F%2Fwww.bx.psu.edu%2F ~aml2%2FSNPs.pptx&psig=AOvVaw04FONMqv2yoDCSmh hvsG92&ust=1508932285216884 Introduction Plant materials Results & discussion Summary Part I Part II part III Part IV Genotype 1 Genotype 2 Genotype 3 Genotype 4
- 7. Attribute QTL mapping GWAS Detection goal Quantitative trait locus, i.e., wide region within specific pedigrees Quantitative trait nucleotide, i.e., physically as close as possible to causative sequence(s) Experimental populations for detection Defined pedigrees, e.g., backcross, F2, RI, three and two generation pedigrees/families, half-sib families,etc. unrelated individuals • GWAS and QTL mapping Introduction Plant materials Results & discussion Summary Part I Part II part III Part IV
- 8. • Webb et al, 2016 is one of the most important study on faba bean genetics. The develop a Faba Bean Consensus Map (FBCM) with 675 SNP markers • They derived the SNPs marker for Medicago truncatula (model legume) which was completely sequenced due to its small genome size 13,000 Mb 500 Mb Introduction Plant materials Results & discussion Summary Part I Part II part III Part IV
- 9. • On of the main steps in MAS is to validate the QTLs associated with traits. • Very few studies has been carried out before on QTL validation for frost tolerance in faba bean. Introduction Plant materials Results & discussion Summary Part I Part II part III Part IV
- 10. • The objectives of this study 1. to construct a genetic map for faba bean using recombinant inbred lines (RILs) population and identify QTL for traits associated with frost stress tolerance 2. to validate some QTL associated with frost tolerance that were previously reported by Sallam and Martsch (2015) 3. to identify candidate genes underlying common QTL controlling frost tolerance in both genetic backgrounds using synteny between the M. truncatula and faba bean genomes. Introduction Plant materials Results & discussion Summary Part I Part II part III Part IV
- 11. Introduction Plant materials Results & discussion Summary Part I Part II part III Part IV
- 12. I. Plant Material • Two different genetic backgrounds 1- Biparental population (BPP): 101 lines (F7)+ two parents Côte d’Or 1 (French landrace) and BeanPureLine 4628 (PBL4628) 2- Gottingen Winter Bean Population (GWBP): 189 highly diverse homozougous lines (F9). Webo, Wibo, Hiverna/1, L79/79, L977/88, and L979/S1, Côte d’Or/1 and Arissot, and Banner, Bourdon, and Bulldog (Germany, UK, and France). Introduction Plant materials Results & discussion Summary Part I Part II part III Part IV
- 13. Production scheme of GWBP • 8 founder lines (Germany, France, and UK) • Natural crossing • Ten generation via SSD Production scheme of BPP • Two parental lines • Ten generation via SSD Côte d’Or 1 4628 (PBL4628) Ref. Ali et al. 2014 Ref:file:///C:/Users/ahmed/Down loads/seminari17-12-12- 130205215734-phpapp02.pdf Introduction Plant materials Results & discussion Summary Part I Part II part III Part IV
- 14. II. Trait scoring 1. Physiological traits • Leaf fatty acid composition - PBB : hardening (r=6) and unhardening (r =6) - GWBP : hardening only (r = 4) GWBP BPP Hardening Unhardening 5 ⁰C day/night – 10 days 2.5 ⁰C day/night – 7 days Seedling stage FAC FAC Introduction Plant materials Results & discussion Summary Part I Part II part III Part IV Optimum conditions
- 15. • Leaf fatty acid composition: 1- Palmitic acid C16:0 2- Stearic acid C18:0 3- Oleic acid C18:1 4- Linoleic acid C18:2 5- Linolenic acid C18:3 • Leaf proline content - Under hardening only in BPP - Troll and Lindsley (1955) as modified by Bates et al. (1973) Saturated fatty acid C16:0 + C18:0 Unsaturated fatty acid C18:1 + C18:2 + C18:3 Introduction Plant materials Results & discussion Summary Part I Part II part III Part IV
- 16. Seedling stage GWBP BPP Hardening Unhardening 5 ⁰C 2.5 ⁰C Frost stress -16, -18, and -19 ⁰C -8, -10, -13, -16, -19 and -21 ⁰C 2- Frost test
- 17. 2. Frost stress symptoms: after each frost step 1 5 9 7 - Loss of leaf turgidity: (1 = no turgidity, 9 = full turgidity - Loss of leaf color: 1 = green, 9 = black) 3 Introduction Plant materials Results & discussion Summary Part I Part II part III Part IV
- 18. • An area under symptom progress curve (AUSPC; corresponding to the “Area Under Disease Progress Curve,” AUDPC, Shaner and Finney, 1977). The AUSPC was calculated for each genotype in both populations (BPP and GWBP) • After each step: frost symptoms = Loss of leaf turgidity + loss of leaf color Frostsymptoms Freezing temp. Introduction Plant materials Results & discussion Summary Part I Part II part III Part IV
- 19. • Example. The performance of one genotype under three freezing nights Frost symptoms Freezing temperature 4 -16 7 -18 9 -20 • AUSPC_genotype1 = (4+0)/2 * (16-0) + (7+4)/2 * (18-16) + (9+7)/2 * (20-18) = 68 freezing unit. • AUSPC was calculated for GWBP (hardening) and BPP (hardening and unhardening) • AUSPC (GWBP): r = 20 • AUSPC (BPP): r = 6 Introduction Plant materials Results & discussion Summary Part I Part II part III Part IV
- 20. 3- loss of leaf turgidity after frost (LTAF) and loss of leaf color after frost (LCAF) • Only for GWBP • LTAF and LCAF were scored after four days from frost test • 1 = no turgidity or green leaf, 9 = full turgidly , black leaf Introduction Plant materials Results & discussion Summary Part I Part II part III Part IV
- 21. III. SNP Genotyping and genetic analysis 1- GWBP • The 189 lines were SNP-genotyped using KASPar TM (Kompetitive Allele Specific PCR) assay platform (KBioscience,UK) • Number of SNPs 189 SNP markers • GWAS was perfomed between the 189 SNPmarker and the phenotypic data of the 189 genotypes • Tassel 3.0 – significant level: false discover rate 0.05 and 0.20 • General linear model and mixed linear model Introduction Plant materials Results & discussion Summary Part I Part II part III Part IV
- 22. Dr. Mustapha Arbaoui • Arbaoui et al., 2008 – Euphyica • 216 RAPD marker – Mapmarker 3.0 • 12 QTL detected 2- BPP The 101 lines were genotyped before using RAPD marker (Arbaoui et al., 2008) Introduction Plant materials Results & discussion Summary Part I Part II part III Part IV
- 23. 2- Biparental population • The 101 lines were genotyped before using RAPD marker (Arbaoui et al., 2008) • All the 101 lines were genotyped using the same set of 189 SNPs which used to genotype GWBP • The new genetic linkage was performed using MapDisto • LOD score = 3, recombination fraction = 0.3 • The genetic map distance: Kosambi • The QTL mapping was perfomed using Network QTL 2.1 (composite interval analysis) • Of the 189 SNP, 117 showed normal diploid segregation (p ≥ 0.05) Introduction Plant materials Results & discussion Summary Part I Part II part III Part IV
- 24. • Synteny analysis • The annotation and gene ontology of the candidate genes of the validated markers were identified using data base LegumeI P(http:// plantgrn.noble.org/LegumeIP/) (M.truncatula, gene model, Mt3.5v3) Introduction Plant materials Results & discussion Summary Part I Part II part III Part IV
- 25. IV. Statistical analysis • The design of experiment was alpha lattice • Correlation analysis • Anova • Broad-sense heritability Introduction Plant materials Results & discussion Summary Part I Part II part III Part IV
- 26. Introduction Plant materials Results & discussion Summary Part I Part II part III Part IV
- 27. Part I Genetic variation in frost tolerance and FAC Introduction Plant materials Results & discussion Summary Part I Part II part III Part IV
- 28. 1- FAC • Biparental population (BPP) Mean fatty acid composition (%) of hardened and unhardened leaves Analysis of variance for main fatty acid composition (%) Introduction Plant materials Results & discussion Summary Part I Part II part III Part IV
- 29. Polyunsaturated fatty acids Polyunsaturated fatty acids Monounsaturated fatty acids Saturated fatty acids greater membrane fluidity Desaturase enzyme activity Faba bean leaf Introduction Plant materials Results & discussion Summary Part I Part II part III Part IV
- 30. • AUSPC (Area under symptoms progress curve) Arbaoui et al. 2008 Introduction Plant materials Results & discussion Summary Part I Part II part III Part IV
- 31. • GWBP 1- frost tolerance Trait Minimum Maximum mean F-value H2 H_AUSPC 46.16 144.46 72.75 10.15** 0.90 LTAF 2.07 8.89 5.43 15.49** 0.94 LCAF 2.25 8.86 5.535 16.24** 0.94 Introduction Plant materials Results & discussion Summary Part I Part II part III Part IV
- 32. • Phenotypic correlations among frost tolerant traits Introduction Plant materials Results & discussion Summary Part I Part II part III Part IV
- 33. • Phenotypic correlations between frost tolerance and FAC Introduction Plant materials Results & discussion Summary Part I Part II part III Part IV
- 34. Part II QTL mapping and Genome wide association study (GWAS) Introduction Plant materials Results & discussion Summary Part I Part II part III Part IV
- 35. 1- QTL mapping in BPP for H_AUSPC, U_AUPS, and FAC • Of the 189 SNPs, 122 (64.6%) showed an agreement with the expected 1:1 segregation ratio using 2 test(P ≥ 0.05) • Only 117 SNPs were mapped in 14 linkage group and only five markers were not mapped • 17 QTLs were detected for 11 frost tolerance and FAC traits Introduction Plant materials Results & discussion Summary Part I Part II part III Part IV
- 36. • QTL mapping for H_AUSPC , U_AUSPC, and FAC (under hardening and unhardening) Introduction Plant materials Results & discussion Summary Part I Part II part III Part IV
- 37. QTL effects were calculated as mean of Coted’Or genotypic class—mean of BPL genotypic class • QTL mapping for H_AUSPC , U_AUSPC, and FAC (under hardening and unhardening) Trait New name Interval LG position Effects P-value F-value PVE H_AUSPC H_AUSPC_1 19A15_3-VF_MT5G026780_001 LG02 38.5 -20.01 0.00321 16.7 18.79 H_AUSPC_2 VF_MT5G033880_001-VF_MT5G005120_001 LG02 47.8 -22.77 0.00202 20.2 13.15 H_AUSPC_3 VF_MT7G084010_001-VF_MT7G090890_001 LG10 0.0 -30.38 0.00005 19.3 17.00 H_C16:0 H_C16:0 VF_MT8G022290_001-VF_MT8G039690_001 LG08 8.1 -0.22 0.00050 15.5 10.89 H_C18:0 H_C18:0_1 GLIP081SNP-VF_MT4G085880_001 LG04 23 -0.05 0.00000 28.4 22.27 H_C18:0_2 VF_MT4G113270_001-VF_MT4G104240_001 LG03 24.5 -0.04 0.00027 15.0 15.04 H_C18:1 H_C18:1_1 19A15_3-VF_MT5G026780_001 LG02 37.5 -0.24 0.00541 13.5 2.74 H_C18:1_2 VF_MT4G113270_001-VF_MT4G104240_001 LG03 21.5 -0.34 0.00008 17.7 14.06 H_C18:1_3 VF_MT7G090890_001-VF_MT7G090930_001 LG10 4.1 0.64 0.00000 23.0 29.41 H_C18:2 H_C18:2 VF_MT5G033880_001-VF_MT5G005120_001 LG02 47.8 0.62 0.00004 18.6 14.24 H_C18:3 H_C18:3 VF_MT4G113270_001-VF_MT4G104240_001 LG03 22.5 0.62 0.00021 13.6 12.07 H_C18:4 H_C18:4 VF_MT2G027240_001-VF_MT2G029180_001 LG02 0.0 -0.18 0.00003 17.0 14.83 U_C16:0 U_C16:0_1 VF_MT3G077670_001-VF_MT3G086600_001 LG01 15 0.18 0.00116 11.8 11.38 U_C16:0_2 VF_MT4G127690_001-VF_MT4G125100_001 LG03 8.3 -0.18 0.00123 12.6 11.28 U_C16:1 U_C16:1 VF_MT4G114900_001-VF_MT4G113270_001 LG03 19.9 0.07 0.00004 17.0 14.55 Introduction Plant materials Results & discussion Summary Part I Part II part III Part IV
- 38. • Genome wide association study in GWBP 1- Population structure: principal coordinates analysis based on genetic distance Introduction Plant materials Results & discussion Summary Part I Part II part III Part IV
- 39. 2- genome wide association analysis for frost tolerance in GWBP Trait FBCM(1) Marker locus Allele(2) p PVE(4) Allele effects H_AUSPC CM01 Vf_Mt5g046030_001 T:C 0.00045 7.93 -6.82 CM01 Vf_Mt5g015280_001 T:C 0.00164 4.53 -5.09 CM01 Vf_Mt2g027240_001 C:T 0.00230 4.05 -5.13 CM02 Vf_Mt3g086600_001 G:T 0.00032 7.19 -10.96 CM02 Vf_Mt4g007030_001 C:A 0.00164 4.54 -5.43 CM02 Vf_Mt5g075540_001 G:C 0.00296 3.55 -4.53 CM03 Vf_Mt1g105040_001 G:T 0.00256 5.22 -7.68 CM03 Vf_Mt1g056180_001 A:G 0.00953 4.23 -5.44 CM04 Vf_Mt4g101130_001 T:C 0.00296 3.42 -.6.92 CM04 Vf_Mt8g040550_001 A:G 0.00329 3.03 -4.26 LG03 GLIP081SNP G:C 0.00632 2.66 -3.99 LTAF CM01 Vf_Mt5g046030_001 T:C 0.00001 11.89 -0.63 CM01 Vf_Mt2g027240_001 C:T 0.00193 5.15 -0.41 CM01 Vf_Mt5g015280_001 T:C 0.00499 4.18 -0.39 CM02 Vf_Mt3g086600_001(7) G:T 0.00001 8.84 -0.87 CM02 Vf_Mt4g007030_001 C:A 0.30018 5.14 -0.43 CM03 Vf_Mt1g105040_001 G:T 0.00733 4.23 -0.52 CM03 Vf_Mt1g056180_001 A:G 0.00885 3.74 -0.38 CM04 Vf_Mt2g086880_001 T:A 0.00289 4.98 -0.41 LCAF CM01 Vf_Mt5g046030_001 C:T 0.00043 8.20 -0.54 CM01 Vf_Mt2g027240_001 C:T 0.00143 5.44 -0.44 CM02 Vf_Mt3g086600_001 G:T 0.00009 7.93 -0.85 CM02 Vf_Mt5g075540_001 G:C 0.00304 5.20 -0.43 CM03 Vf_Mt1g105040_001 G:T 0.00733 4.95 -0.54 CM04 Vf_Mt2g086880_001 T:A 0.00364 4.93 -0.42 Introduction Plant materials Results & discussion Summary Part I Part II part III Part IV
- 40. Part III : QTL validation, candidate genes and gene experssion Introduction Plant materials Results & discussion Summary Part I Part II Part III Part IV
- 41. Markers showing significant marker-trait association (FT=frost tolerance, WH= winter hardiness, YA= yield attributes) in two different genetic backgrounds (BPP and GWBP) and their corresponding gene annotation. Faba bean loci M. truncatula loci Chr. QTL in PBB Type QTL in GWBP* Type Functional annotation of the gene VF_Mt5g026780 Medtr5g026780 5 H_AUSPC H_C18:1_1 FT FAC DS (2), I1 (DS) (2) FPH(3), seed yield(3) FT YA neutral amino acid transporter VF_Mt3g086600 Medtr3g086600 3 H_C16:0_1 FAC DS(2), FTI(2), I1 (DS) (2), I2 (REG) (2), LT+LC(2), RWCAF(2), RDF(2), AUSPC, LTAF,LCAF WRS(3) Seed yield(3) FT FT FT FT WH YA hypothetical protein VF_Mt4g127690 Medtr4g127690 4 U_C16:0_2 FAC DS(2), I1 (DS) (2) C16:0(1), SFA(1) DTF(3) FT FAC YA transmembrane protein VF_Mt4g125100 Medtr4g125100 4 U_C16:0_2 FAC C16:0(2) FAC cupin family protein VF_Mt2g027240 Medtr2g027240 2 H_C18:4 FAC DS(2), I1 (DS) (2),LT+LC(2), LCAF LTAF, AUSPC SFA(2) FT FT FAC Serine/Threonine kinase family protein (2) Sallam and matrsch 2015a, Genetica – (3) Sallam et al 2015b, Crop and Pasture Science Introduction Plant materials Results & discussion Summary Part I Part II Part III Part IV
- 42. Highest expression of candidate genes in different tissue. The gene expression was considered in the tissue which were not exposed to any treatment (under control conditions) Introduction Plant materials Results & discussion Summary Part I Part II Part III Part IV
- 43. Part IV : Combine RAPD and SNP markers and NEW linkage genetic map Introduction Plant materials Results & discussion Summary Part I Part II Part III Part IV
- 44. Figure 5: (a) Linkage groups associated with putative QTL for frost tolerance and FAC (Arbaoui et al., 2008), (b) The collinearity between SNP&RAPD-LG18 constructed by Sallam et al., (2013, unpublished but available online at http://www.aun.edu.eg/membercv.php?M_ID=1385 ), SNP-LG10 of the genetic map constructed in the present study, and both RAPD-LG18 and RAPD-LG10 constructed by (Arbaoui et al., 2008). Chro.7 In Medicago truncatula Introduction Plant materials Results & discussion Summary Part I Part II Part III Part IV
- 46. Introduction Plant materials Results & discussion Summary Part I Part II part III Part IV
- 47. • the two different genetic backgrounds presented remarkable phenotypic variations in frost tolerance, which can be exploited in the dissection of the genetic architecture of frost tolerance. • Based on the synteny between faba bean and M. truncatula, we found genomic regions on chromosome 4 and 7 of the M. truncatula which showed association with frost tolerance and FAC which could be an interest for further studies. Introduction Plant materials Results & discussion Summary Part I Part II part III Part IV
- 48. • The candidate genes identified in this study may play important roles in improving frost tolerance in winter faba bean, however, further investigations are required on their biological function especially VF_MT3G086600_001 which associated with frost tolerance, winter hardiness, and yield in winter faba bean Introduction Plant materials Results & discussion Summary Part I Part II part III Part IV
- 49. Prof. Dr. Wolfgang Link Georg-August- University of Göttingen Technical staff Uwe Ammermann Prof. Dr. Donal O′Sullivan University of Reading, UK
- 50. Thank Your For Your Attention
- 51. Next presentation: 15.11.2017 AB-QTL analysis reveals new alleles associated to proline accumulation and leaf wilting under drought stress conditions in barley (Hordeum vulgare L.) Dr Mohammed A. Sayed, Associate Professor Department of Agronomy, Faculty of Agriculture, Assiut University
- 52. Sallam et al 2015, Euphytica
- 53. Sallam et al 2015, Euphytica
- 55. GLM
- 56. mlm