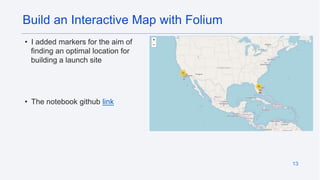
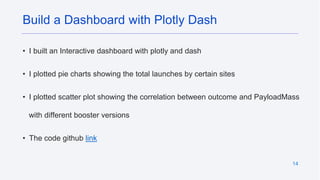
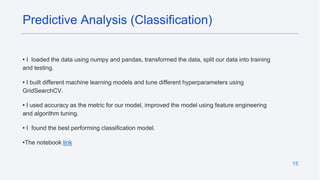
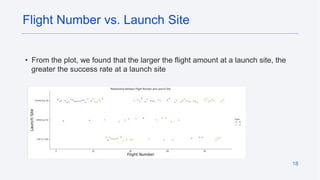
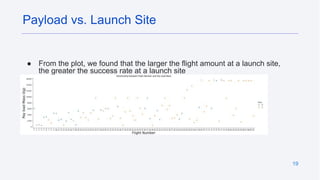
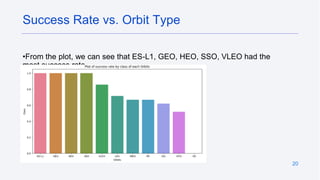
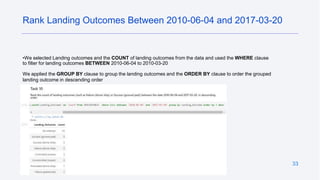
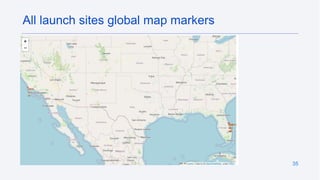
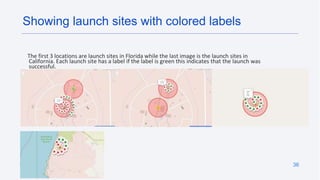
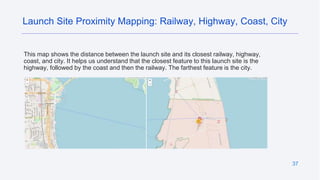
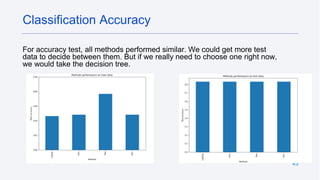
Marwan Ashraf
30/09/2023
2
• Executive Summary
• Introduction
• Methodology
• Results
• Conclusion
• Appendix
Outline
3
● Summary of methodologies
○ Data Collection with API
○ Data Collection with Web Scraping
○ Data Wrangling
○ Exploratory Data Analysis with SQL
○ Exploratory Data Analysis with Visualization
○ Interactive map with Folium
○ Interactive Dashboards with Dash
○ Model prediction with Machine Learning
● Summary of all results
○ Exploratory Data Analysis result
○ Interactive Analytics visuals
○ Predictive modeling results
Executive Summary
4
Introduction
● Project background and context
SpaceX advertises Falcon 9 rocket launches on its website, with a cost of
62 million dollars; other providers cost upward of 165 million dollars each,
much of the savings is because SpaceX can reuse the first stage.
Therefore if we can determine if the first stage will land, we can determine
the cost of a launch. This information can be used if an alternate company
wants to bid against SpaceX for a rocket launch
● Problems you want to find answers
○ What factors determine if launch was successful?
○ The interaction amongst various features that determine the
success rate of a successful landing.
○ What operating conditions needs to be in place to ensure a
successful landing program.
5
Section
1
6
Executive Summary
Data collection methodology:
Data was collected using SpaceX API and web scraping from Wikipedia.
Perform data wrangling
One-hot encoding was applied to categorical features
Perform exploratory data analysis (EDA) using visualization and SQL
Perform interactive visual analytics using Folium and Plotly Dash
Perform predictive analysis using classification models
How to build, tune, evaluate classification models
Methodology
7
● The Data was collected by various methods
○ Data Collection by SpaceX API
○ Next, I decoded the response content as a Json using .json() function
call and turn it into a pandas dataframe using .json_normalize().
○ Then I cleaned the data by checking for missing values and fill in
missing values where it’s necessary
○ Also, we performed web scraping from Wikipedia for Falcon 9 launch
records with Beautifulsoup
Data Collection
8
• I used the get request to the
SpaceX API to collect and clean
the request data
• The notebook github link
Data Collection – SpaceX API
9
• I used web scraping
techniques to obtain
Falcon 9 launches data
from wikipedia
• The notebook github link
Data Collection - Scraping
10
• I performed exploratory data analysis and
determined the training labels.
• I calculated the number of launches at
each site, and the number and occurrence of
each orbits
• I created landing outcome label from
outcome column and exported the results to
csv
• The notebook github link
Data Wrangling
11
•We explored the data by visualizing the
relationship between flight number and
launch Site, payload and launch site,
success rate of each orbit type, flight
number and orbit type, the launch
success yearly trend.
EDA with Data Visualization
• The notebook github link
12
● SQL queries performed include:
○ Displaying the names of the unique launch sites in the space mission
○ Displaying 5 records where launch sites begin with the string ‘KSC’
○ Displaying the total payload mass carried by boosters launched by NASA (CRS)
○ Displaying average payload mass carried by booster version F9 v1.1
○ Listing the data where the successful landing outcome in drone ship was achieved
○ Listing the data where the successful landing outcomes in drone ship was achieved
○ Listing the names of the boosters which have success in ground pad and have payload mass
greater than 4000 but less than 6000
○ Listing the total number of successful and failure mission outcomes
○ Listing the names of the booster version which have carried maximum payload mass.
○ Listing the records which will display the month names, successful landing. Outcomes in
ground pad booster
○ Various launch site for the months in year 2017
○ Ranking the count of successful landing outcomes between dates 2010 to 2017
● The SQL Code
EDA with SQL
13
• I added markers for the aim of
finding an optimal location for
building a launch site
• The notebook github link
Build an Interactive Map with Folium
14
• I built an Interactive dashboard with plotly and dash
• I plotted pie charts showing the total launches by certain sites
• I plotted scatter plot showing the correlation between outcome and PayloadMass
with different booster versions
• The code github link
Build a Dashboard with Plotly Dash
15
• I loaded the data using numpy and pandas, transformed the data, split our data into training
and testing.
• I built different machine learning models and tune different hyperparameters using
GridSearchCV.
• I used accuracy as the metric for our model, improved the model using feature engineering
and algorithm tuning.
• I found the best performing classification model.
•The notebook link
Predictive Analysis (Classification)
• Exploratory data analysis results
• Interactive analytics demo in screenshots
• Predictive analysis results
16
Results
Section
2
18
• From the plot, we found that the larger the flight amount at a launch site, the
greater the success rate at a launch site
Flight Number vs. Launch Site
19
● From the plot, we found that the larger the flight amount at a launch site,
the greater the success rate at a launch site
Payload vs. Launch Site
20
•From the plot, we can see that ES-L1, GEO, HEO, SSO, VLEO had the
most success rate.
Success Rate vs. Orbit Type
21
• The plot below shows the Flight Number vs. Orbit type. We observe that in the LEO orbit,
success is related to the number of flights whereas in the GTO orbit, there is no relationship
between flight number and the orbit
Flight Number vs. Orbit Type
22
•We can observe that with heavy payloads, the successful landing are more for
PO, LEO and ISS orbits.
Payload vs. Orbit Type
23
•From the plot, we can
observe that success rate
since 2013 kept on
increasing till 2020.
Launch Success Yearly Trend
24
•I used the keyword distinct to
show only unique launch sites
from the SpaceX data.
All Launch Site Names
25
• This query display 5
records where the
launch site begin with
‘CCA’
Launch Site Names Begin with 'CCA'
26
•This query calculate the
total payload carried by
boosters from NASA as
45596
Total Payload Mass
27
• This query calculate
the average payload
mass carried by
booster version F9
v1.1 as 2928.4
Average Payload Mass by F9 v1.1
28
• This query shows that
the date of the first
successful landing
outcome on ground pad
was 22nd December 2015
First Successful Ground Landing Date
29
•The WHERE clause to filter for boosters which have successfully landed
on drone ship and applied the AND condition to determine successful
landing with payload mass greater than 4000 but less than 6000
Successful Drone Ship Landing with Payload between 4000 and 6000
30
• This query counts the the number of mission outcome and group by the
mission outcome. This means that there were 100 successful missions
and 1 failed mission.
Total Number of Successful and Failure Mission Outcomes
31
•We determined the booster that have carried the maximum payload using
a subquery in the WHERE clause and the MAX() function.
Boosters Carried Maximum Payload
32
• The used combinations of the WHERE clause, LIKE, AND, and BETWEEN conditions to
filter for failed landing outcomes in drone ship, their booster versions, and launch site
names for year 2015
2015 Launch Records
33
•We selected Landing outcomes and the COUNT of landing outcomes from the data and used the WHERE clause
to filter for landing outcomes BETWEEN 2010-06-04 to 2010-03-20
We applied the GROUP BY clause to group the landing outcomes and the ORDER BY clause to order the grouped
landing outcome in descending order
Rank Landing Outcomes Between 2010-06-04 and 2017-03-20
Section
3
35
All launch sites global map markers
36
The first 3 locations are launch sites in Florida while the last image is the launch sites in
California. Each launch site has a label if the label is green this indicates that the launch was
successful.
Showing launch sites with colored labels
37
This map shows the distance between the launch site and its closest railway, highway,
coast, and city. It helps us understand that the closest feature to this launch site is the
highway, followed by the coast and then the railway. The farthest feature is the city.
Launch Site Proximity Mapping: Railway, Highway, Coast, City
Section
4
39
Here we can see that KSC LC-39A has the most successful launches
from all launch sites
Pie Chart Depicting the Success Rate of Each Launch
Site
40
KSC LC-39A has 76.9% success rate while getting only 23.1% failure rate.
Pie Chart Showing the Launch site with the highest success ratio
41
We can see that the success of light weighted payload is higher than the
success of ht
Correlation Between Payload Mass and The success of all
Section
5
43
For accuracy test, all methods performed similar. We could get more test
data to decide between them. But if we really need to choose one right now,
we would take the decision tree.
Classification Accuracy
44
• The 4 models has the same
confusion matrix as they has
the same accuracy test
percentage the main problem
of this models is false
positivity
Confusion Matrix
45
• The success of a mission can be explained by several factors such as the launch site,
the orbit and especially the number of previous launches. Indeed, we can assume that
there has been a gain in knowledge between launches that allowed to go from a
launch failure to a success.
• The orbits with the best success rates are GEO, HEO, SSO, ES-L1.
• Depending on the orbits, the payload mass can be a criterion to take into account for
the success of a mission. Some orbits require a light or heavy payload mass. But
generally low weighted payloads perform better than the heavy weighted payloads.
• With the current data, we cannot explain why some launch sites are better than others
(KSC LC-39A is the best launch site). To get an answer to this problem, we could obtain
atmospheric or other relevant data.
• For this dataset, we choose the Decision Tree Algorithm as the best model even if the
test accuracy between all the models used is identical. We choose Decision Tree
Algorithm because it has a better train accuracy.
Conclusions
IBM_Data_Science_Capstone_Pressenation.pptx

IBM_Data_Science_Capstone_Pressenation.pptx

  • 1.
  • 2.
    2 • Executive Summary •Introduction • Methodology • Results • Conclusion • Appendix Outline
  • 3.
    3 ● Summary ofmethodologies ○ Data Collection with API ○ Data Collection with Web Scraping ○ Data Wrangling ○ Exploratory Data Analysis with SQL ○ Exploratory Data Analysis with Visualization ○ Interactive map with Folium ○ Interactive Dashboards with Dash ○ Model prediction with Machine Learning ● Summary of all results ○ Exploratory Data Analysis result ○ Interactive Analytics visuals ○ Predictive modeling results Executive Summary
  • 4.
    4 Introduction ● Project backgroundand context SpaceX advertises Falcon 9 rocket launches on its website, with a cost of 62 million dollars; other providers cost upward of 165 million dollars each, much of the savings is because SpaceX can reuse the first stage. Therefore if we can determine if the first stage will land, we can determine the cost of a launch. This information can be used if an alternate company wants to bid against SpaceX for a rocket launch ● Problems you want to find answers ○ What factors determine if launch was successful? ○ The interaction amongst various features that determine the success rate of a successful landing. ○ What operating conditions needs to be in place to ensure a successful landing program.
  • 5.
  • 6.
    6 Executive Summary Data collectionmethodology: Data was collected using SpaceX API and web scraping from Wikipedia. Perform data wrangling One-hot encoding was applied to categorical features Perform exploratory data analysis (EDA) using visualization and SQL Perform interactive visual analytics using Folium and Plotly Dash Perform predictive analysis using classification models How to build, tune, evaluate classification models Methodology
  • 7.
    7 ● The Datawas collected by various methods ○ Data Collection by SpaceX API ○ Next, I decoded the response content as a Json using .json() function call and turn it into a pandas dataframe using .json_normalize(). ○ Then I cleaned the data by checking for missing values and fill in missing values where it’s necessary ○ Also, we performed web scraping from Wikipedia for Falcon 9 launch records with Beautifulsoup Data Collection
  • 8.
    8 • I usedthe get request to the SpaceX API to collect and clean the request data • The notebook github link Data Collection – SpaceX API
  • 9.
    9 • I usedweb scraping techniques to obtain Falcon 9 launches data from wikipedia • The notebook github link Data Collection - Scraping
  • 10.
    10 • I performedexploratory data analysis and determined the training labels. • I calculated the number of launches at each site, and the number and occurrence of each orbits • I created landing outcome label from outcome column and exported the results to csv • The notebook github link Data Wrangling
  • 11.
    11 •We explored thedata by visualizing the relationship between flight number and launch Site, payload and launch site, success rate of each orbit type, flight number and orbit type, the launch success yearly trend. EDA with Data Visualization • The notebook github link
  • 12.
    12 ● SQL queriesperformed include: ○ Displaying the names of the unique launch sites in the space mission ○ Displaying 5 records where launch sites begin with the string ‘KSC’ ○ Displaying the total payload mass carried by boosters launched by NASA (CRS) ○ Displaying average payload mass carried by booster version F9 v1.1 ○ Listing the data where the successful landing outcome in drone ship was achieved ○ Listing the data where the successful landing outcomes in drone ship was achieved ○ Listing the names of the boosters which have success in ground pad and have payload mass greater than 4000 but less than 6000 ○ Listing the total number of successful and failure mission outcomes ○ Listing the names of the booster version which have carried maximum payload mass. ○ Listing the records which will display the month names, successful landing. Outcomes in ground pad booster ○ Various launch site for the months in year 2017 ○ Ranking the count of successful landing outcomes between dates 2010 to 2017 ● The SQL Code EDA with SQL
  • 13.
    13 • I addedmarkers for the aim of finding an optimal location for building a launch site • The notebook github link Build an Interactive Map with Folium
  • 14.
    14 • I builtan Interactive dashboard with plotly and dash • I plotted pie charts showing the total launches by certain sites • I plotted scatter plot showing the correlation between outcome and PayloadMass with different booster versions • The code github link Build a Dashboard with Plotly Dash
  • 15.
    15 • I loadedthe data using numpy and pandas, transformed the data, split our data into training and testing. • I built different machine learning models and tune different hyperparameters using GridSearchCV. • I used accuracy as the metric for our model, improved the model using feature engineering and algorithm tuning. • I found the best performing classification model. •The notebook link Predictive Analysis (Classification)
  • 16.
    • Exploratory dataanalysis results • Interactive analytics demo in screenshots • Predictive analysis results 16 Results
  • 17.
  • 18.
    18 • From theplot, we found that the larger the flight amount at a launch site, the greater the success rate at a launch site Flight Number vs. Launch Site
  • 19.
    19 ● From theplot, we found that the larger the flight amount at a launch site, the greater the success rate at a launch site Payload vs. Launch Site
  • 20.
    20 •From the plot,we can see that ES-L1, GEO, HEO, SSO, VLEO had the most success rate. Success Rate vs. Orbit Type
  • 21.
    21 • The plotbelow shows the Flight Number vs. Orbit type. We observe that in the LEO orbit, success is related to the number of flights whereas in the GTO orbit, there is no relationship between flight number and the orbit Flight Number vs. Orbit Type
  • 22.
    22 •We can observethat with heavy payloads, the successful landing are more for PO, LEO and ISS orbits. Payload vs. Orbit Type
  • 23.
    23 •From the plot,we can observe that success rate since 2013 kept on increasing till 2020. Launch Success Yearly Trend
  • 24.
    24 •I used thekeyword distinct to show only unique launch sites from the SpaceX data. All Launch Site Names
  • 25.
    25 • This querydisplay 5 records where the launch site begin with ‘CCA’ Launch Site Names Begin with 'CCA'
  • 26.
    26 •This query calculatethe total payload carried by boosters from NASA as 45596 Total Payload Mass
  • 27.
    27 • This querycalculate the average payload mass carried by booster version F9 v1.1 as 2928.4 Average Payload Mass by F9 v1.1
  • 28.
    28 • This queryshows that the date of the first successful landing outcome on ground pad was 22nd December 2015 First Successful Ground Landing Date
  • 29.
    29 •The WHERE clauseto filter for boosters which have successfully landed on drone ship and applied the AND condition to determine successful landing with payload mass greater than 4000 but less than 6000 Successful Drone Ship Landing with Payload between 4000 and 6000
  • 30.
    30 • This querycounts the the number of mission outcome and group by the mission outcome. This means that there were 100 successful missions and 1 failed mission. Total Number of Successful and Failure Mission Outcomes
  • 31.
    31 •We determined thebooster that have carried the maximum payload using a subquery in the WHERE clause and the MAX() function. Boosters Carried Maximum Payload
  • 32.
    32 • The usedcombinations of the WHERE clause, LIKE, AND, and BETWEEN conditions to filter for failed landing outcomes in drone ship, their booster versions, and launch site names for year 2015 2015 Launch Records
  • 33.
    33 •We selected Landingoutcomes and the COUNT of landing outcomes from the data and used the WHERE clause to filter for landing outcomes BETWEEN 2010-06-04 to 2010-03-20 We applied the GROUP BY clause to group the landing outcomes and the ORDER BY clause to order the grouped landing outcome in descending order Rank Landing Outcomes Between 2010-06-04 and 2017-03-20
  • 34.
  • 35.
    35 All launch sitesglobal map markers
  • 36.
    36 The first 3locations are launch sites in Florida while the last image is the launch sites in California. Each launch site has a label if the label is green this indicates that the launch was successful. Showing launch sites with colored labels
  • 37.
    37 This map showsthe distance between the launch site and its closest railway, highway, coast, and city. It helps us understand that the closest feature to this launch site is the highway, followed by the coast and then the railway. The farthest feature is the city. Launch Site Proximity Mapping: Railway, Highway, Coast, City
  • 38.
  • 39.
    39 Here we cansee that KSC LC-39A has the most successful launches from all launch sites Pie Chart Depicting the Success Rate of Each Launch Site
  • 40.
    40 KSC LC-39A has76.9% success rate while getting only 23.1% failure rate. Pie Chart Showing the Launch site with the highest success ratio
  • 41.
    41 We can seethat the success of light weighted payload is higher than the success of ht Correlation Between Payload Mass and The success of all
  • 42.
  • 43.
    43 For accuracy test,all methods performed similar. We could get more test data to decide between them. But if we really need to choose one right now, we would take the decision tree. Classification Accuracy
  • 44.
    44 • The 4models has the same confusion matrix as they has the same accuracy test percentage the main problem of this models is false positivity Confusion Matrix
  • 45.
    45 • The successof a mission can be explained by several factors such as the launch site, the orbit and especially the number of previous launches. Indeed, we can assume that there has been a gain in knowledge between launches that allowed to go from a launch failure to a success. • The orbits with the best success rates are GEO, HEO, SSO, ES-L1. • Depending on the orbits, the payload mass can be a criterion to take into account for the success of a mission. Some orbits require a light or heavy payload mass. But generally low weighted payloads perform better than the heavy weighted payloads. • With the current data, we cannot explain why some launch sites are better than others (KSC LC-39A is the best launch site). To get an answer to this problem, we could obtain atmospheric or other relevant data. • For this dataset, we choose the Decision Tree Algorithm as the best model even if the test accuracy between all the models used is identical. We choose Decision Tree Algorithm because it has a better train accuracy. Conclusions