Download to read offline


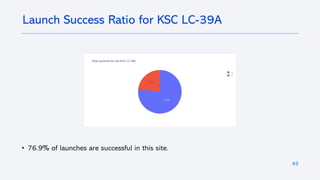
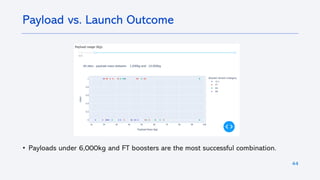

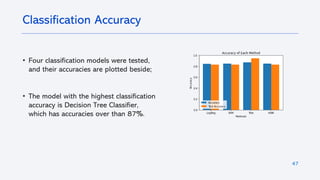
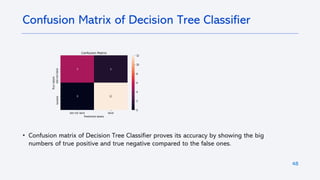


- Data was collected from SpaceX API and web scraping, then analyzed using EDA, visualization, SQL and machine learning. - EDA identified KSC LC-39A as the best launch site with 76.9% success. Payloads under 6,000kg on FT boosters were most successful. - A decision tree classifier model predicted landings with over 87% accuracy, showing key factors for success were launch site and payload weight.