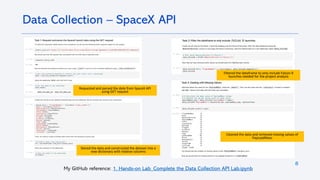
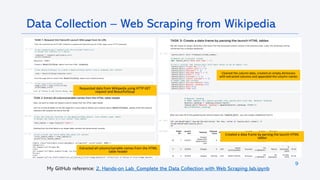
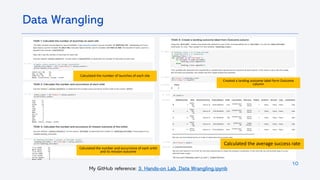
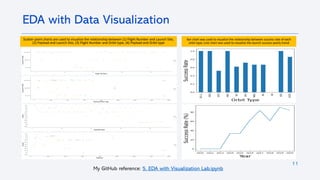
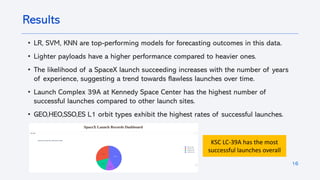
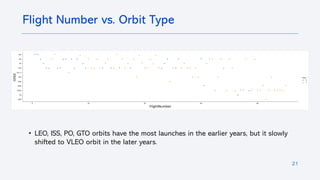
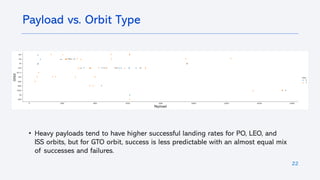
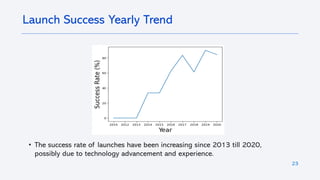
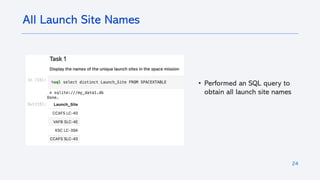
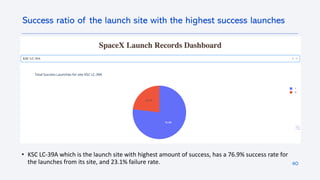
Coursera IBM Applied Data Science Capstone SpaceX project final presentation
Github link for reference: https://github.com/florenceyyw/Applied-Data-Science-Capstone
3. 3
• Summary of methodologies
• Data collection
• Data wrangling
• EDA with data visualization
• EDA with SQL
• Building an interactive map with Folium
• Building a Dashboard with Plotly Dash
• Predictive analysis (Classification)
• Summary of all results
• EDA results
• Interactive analytics
• Predictive analysis
Executive Summary
4. 4
Introduction
Background
Our project is part of a big learning journey – the final course of the IBM Data
Science series. Think of us as the brainy folks at SpaceY, a new company aiming
to launch rockets just like SpaceX.
In this project, we will use the cool methodologies from data science to help
SpaceY make smart choices when it comes to sending rockets into space, and
maybe even outbid the big guys at SpaceX.
Business Problem
Here's the scoop: SpaceX is the big name in space because they figured out how
to send rockets up without breaking the bank. They say it costs about 62 million
dollars to launch their Falcon 9, which is way cheaper than what other
companies charge. They save a bunch by reusing the first part of the rocket.
Normally, that part alone could set you back over 15 million dollars, not even
counting the money spent developing it.
But sometimes, SpaceX has to let that first part go – maybe the satellite they're
carrying is super heavy, or they need to send it to a special place in space.
When that happens, it's bye-bye savings. So, we're on a mission to guess if that
rocket part is going to make it back safely or not. Getting this right could mean
big savings, and that's a number any shareholder would like to see.
6. 6
• Data collection methodology:
• SpaceX Open Source Rest API
• Web Scraping from Wikipedia page ‘List of Falcon 9 and Falcon Heavy Launches’
• Perform data wrangling
• Transforming categorical data using One Hot Encoding for machine learning algorithms and
removing any empty or unnecessary information from the dataset.
• Perform exploratory data analysis (EDA) using visualization and SQL
• Perform interactive visual analytics using Folium and Plotly Dash
• Perform predictive analysis using classification models
• Logistic Regression, K-Nearest Neighbors, Support Vector Machines, and Decision Tree
models have been developed to determine the most effective classification method.
Methodology – Executive Summary
7. 7
The data sets are collected using 2 methods:
1) Request to the SpaceX API
• Gathered SpaceX's past launch data via their open-source API.
• Retrieved and processed this data with GET request.
• Ensured the data included only Falcon 9 launches.
• Filled in missing payload weights from secret missions with average values.
2) Web Scraping
• Requested past Falcon 9 and Falcon Heavy launch data from Wikipedia's relevant page.
• Accessed the Falcon 9 Launch page via its direct Wikipedia link.
• Extracted all the column names from the HTML table.
• Parsed and transformed the table into a Pandas data frame suitable for analysis.
Data Collection
8. 8
My GitHub reference: 1. Hands-on Lab_Complete the Data Collection API Lab.ipynb
Data Collection – SpaceX API
Requested and parsed the data from SpaceX API
using GET request
Stored the data and constructed the dataset into a
new dictionary with relative columns
Filtered the dataframe to only include Falcon 9
launches needed for the project analysis
Cleaned the data and removed missing values of
PayLoadMass
9. 9
Data Collection – Web Scraping from Wikipedia
My GitHub reference: 2. Hands-on Lab_Complete the Data Collection with Web Scraping lab.ipynb
Requested data from Wikipedia using HTTP GET
request and BeautifulSoup
Extracted all column/variable names from the HTML
table header
Cleaned the column data, created an empty dictionary
with extracted columns and appended the column names
Created a data frame by parsing the launch HTML
tables
10. 10
Data Wrangling
My GitHub reference: 3. Hands-on Lab_Data Wrangling.ipynb
Calculated the number of launches of each site
Calculated the number and occurrence of each orbit
and its mission outcome
Created a landing outcome label form Outcome
column
Calculated the average success rate
11. 11
EDA with Data Visualization
My GitHub reference: 5. EDA with Visualization Lab.ipynb
Scatter point charts are used to visualize the relationship between (1) Flight Number and Launch Site,
(2) Payload and Launch Site, (3) Flight Number and Orbit type, (4) Payload and Orbit type
Bar chart was used to visualize the relationship between success rate of each
orbit type; Line chart was used to visualize the launch success yearly trend
12. 12
SQL queries are performed to:
1. Display the names of the unique launch sites in the space mission
2. Display 5 records where launch sites begin with the string 'CCA’
3. Display the total payload mass carried by boosters launched by NASA (CRS)
4. Display average payload mass carried by booster version F9 v1.1
5. List the date when the first successful landing outcome in ground pad was achieved.
6. List the names of the boosters which have success in drone ship and have payload mass greater than 4000 but less than 6000
7. List the total number of successful and failure mission outcomes
8. List the names of the booster versions which have carried the maximum payload mass using a subquery
9. List the records which will display the month names, failure landing outcomes in drone ship ,booster versions, launch site for the
months in year 2015.
10. Rank the count of landing outcomes (such as Failure (drone ship) or Success (ground pad)) between the date 2010-06-04 and
2017-03-20, in descending order.
EDA with SQL
My GitHub reference: 4. Hands-on Lab_Complete the EDA with SQL.ipynb
13. 13
Build an Interactive Map with Folium
My GitHub reference: 6. Hands-on Lab_Interactive Visual Analytics with Folium lab.ipynb
A circle marker was created to show NASA Johnson Space Center's coordinate Distance marker was created to show distances between a launch site to its proximities
14. 14
Build a Dashboard with Plotly Dash
My GitHub reference: 7. Hands-on Lab_Build an Interactive Dashboard with Ploty Dash_spacex_dash_app.py
Dropdown option of pie chart
created to show the success
launches of all / each site
Scatter plot with payload range
slider to show the success launches
of all / each site by payload mass
15. 15
Predictive Analysis (Classification)
My GitHub reference: 8. Hands-on Lab_Complete the Machine Learning Prediction lab.ipynb
• LR, SVM, Decision Tree and KNN objects are created and fit with
GridSearchCV object to find the best parameters, then the models are trained
on the training set.
• The accuracy of test data are calculated for each machine learning model. It is
found that the methods performed best are LR, SVM, KNN where all 3
achieved the highest accuracy of 83.33%.
16. • LR, SVM, KNN are top-performing models for forecasting outcomes in this data.
• Lighter payloads have a higher performance compared to heavier ones.
• The likelihood of a SpaceX launch succeeding increases with the number of years
of experience, suggesting a trend towards flawless launches over time.
• Launch Complex 39A at Kennedy Space Center has the highest number of
successful launches compared to other launch sites.
• GEO,HEO,SSO,ES L1 orbit types exhibit the highest rates of successful launches.
16
Results
KSC LC-39A has the most
successful launches overall
18. 18
• Total number of launches from launch site CCAFS SLC 40 are significantly higher
than the other launch sites.
Flight Number vs. Launch Site
19. 19
Payload vs. Launch Site
• Payloads with lower mass are have more launches compared to those with
higher mass across all three launch sites.
20. 20
Success Rate vs. Orbit Type
• Orbit types ES-L1, GEO, HEO, SSO have the highest success rate among all.
21. 21
Flight Number vs. Orbit Type
• LEO, ISS, PO, GTO orbits have the most launches in the earlier years, but it slowly
shifted to VLEO orbit in the later years.
22. 22
Payload vs. Orbit Type
• Heavy payloads tend to have higher successful landing rates for PO, LEO, and
ISS orbits, but for GTO orbit, success is less predictable with an almost equal mix
of successes and failures.
23. 23
Launch Success Yearly Trend
• The success rate of launches have been increasing since 2013 till 2020,
possibly due to technology advancement and experience.
24. 24
• Performed an SQL query to
obtain all launch site names
All Launch Site Names
25. 25
Launch Site Names Begin with 'CCA'
• Performed an SQL query to
obtain 5 launch site names
that begin with ‘CCA’
26. 26
Total Payload Mass
• Performed an SQL query to
obtain the total payload
mass carried by boosters
launched by NASA (CRS)
27. 27
Average Payload Mass by F9 v1.1
• Performed an SQL query to
calculate the average
payload mass carried by
booster version F9 v1.1
28. 28
First Successful Ground Landing Date
• Performed an SQL query to
find the dates of the first
successful landing outcome
on ground pad
29. 29
Successful Drone Ship Landing with Payload between 4000 and 6000
• Performed an SQL query to
list the names of boosters
which have successfully
landed on drone ship and
had payload mass greater
than 4000 but less than
6000
%sql select distinct Booster_Version from SPACEXTABLE where Landing_Outcome = 'Success
(drone ship)' and PAYLOAD_MASS__KG_ > 4000 and PAYLOAD_MASS__KG_ < 6000
30. 30
Total Number of Successful and Failure Mission Outcomes
• Performed an SQL query to
calculate the total number
of successful and failure
mission outcomes
31. 31
Boosters Carried Maximum Payload
• Performed an SQL query to
list the names of the
booster which have carried
the maximum payload mass
%sql select Booster_Version from SPACEXTABLE where PAYLOAD_MASS__KG_ = (select
max(PAYLOAD_MASS__KG_)from SPACEXTABLE)
32. 32
2015 Launch Records
• Performed an SQL query to
list the failed landing
outcomes in drone ship,
their booster versions,
and launch site names for in
year 2015
%sql select substr(Date, 6,2) as Month, Landing_Outcome, Booster_Version, Launch_Site from
SPACEXTABLE where Landing_Outcome = 'Failure (drone ship)' and substr(Date,0,5) = '2015’
33. 33
Rank Landing Outcomes Between 2010-06-04 and 2017-03-20
• Performed an SQL query to
rank the count of landing
outcomes (such as Failure
(drone ship) or Success
(ground pad)) between the
date 2010-06-04 and
2017-03-20, in descending
order
%sql select Landing_Outcome, count(*) as 'Count' from SPACEXTABLE where Date between '2010-
06-04' and '2017-03-20' group by Landing_Outcome order by Count desc
35. 35
All launch sites on a map
• The launch sites
are labelled by
a marker with
their names on
the map.
36. 36
All success/failed launches for each site on the map
• The launch
records are
grouped in
clusters on the
map, then
labelled by
green markers
for successful
launches, and
red markers for
unsuccessful
ones.
37. 37
Distances between a launch site to its proximities
• The closest
coastline from
NASA JSC is
marked as a
point using
MousePosition
and the distance
between the
coastline point
and the launch
site, which is
approximately
0.86 km.
39. 39
Total success launches for all sites
• KSC LC-39A has the highest amount of success launches with 41.7% from the entire record,
whereas CCAFS SLC-40 has the lowest amount of success launches with only 12.5%.
40. 40
Success ratio of the launch site with the highest success launches
• KSC LC-39A which is the launch site with highest amount of success, has a 76.9% success rate for
the launches from its site, and 23.1% failure rate.
41. 41
Payload vs. launch outcome
• The payload range that has the highest success launches is between 2,000 to 4,000 kg, which can be seen
by the most number of plots in that range, followed by the payload range of 4,000 to 6,000 kg, with the
second most number of plots.
• Booster version FT (green spots) has the highest success launches, followed by B4 (purple spots) with the
second highest success launches, among all booster versions.
43. 43
Classification Accuracy
• The model that performed
best are LR, SVM, KNN
where all 3 achieved the
highest accuracy of 83.33%.
44. 44
Confusion Matrix
Confusion Matrix of LR Confusion Matrix of SVM
Confusion Matrix of Decision Tree Confusion Matrix of KNN
• LR, SVM, KNN models are good as
their confusion matrix show that
they predicted all 12 successful
landing correctly, with 0 error.
• However, the Decision Tree model
only predicted 11 successful landing
correctly, with one of them wrongly
predicted as a failed / did not land.
• LR, SVM, KNN models have the
same accuracy of 83.33% as
displayed earlier, hence the same
confusion matrix.
45. 45
Conclusions
• LR, SVM, KNN are top-performing models for forecasting outcomes in this data.
• Lighter payloads have a higher performance compared to heavier ones.
• The likelihood of a SpaceX launch succeeding increases with the number of years
of experience, suggesting a trend towards flawless launches over time.
• Launch Complex 39A at Kennedy Space Center has the highest number of
successful launches compared to other launch sites.
• GEO,HEO,SSO,ES L1 orbit types exhibit the highest rates of successful launches.
KSC LC-39A has the most
successful launches overall