Download as PDF, PPTX

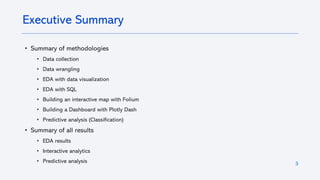
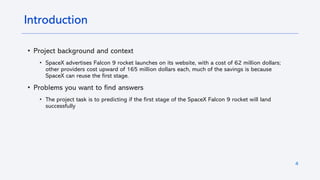
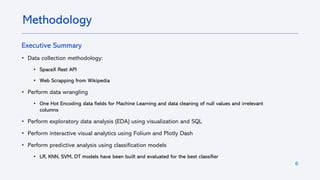
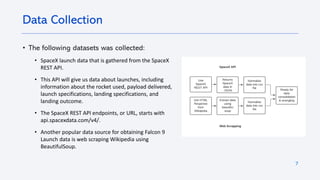
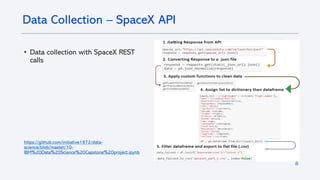
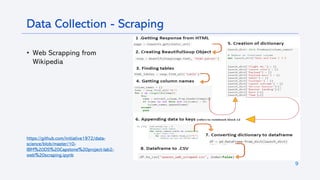
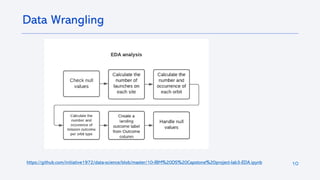
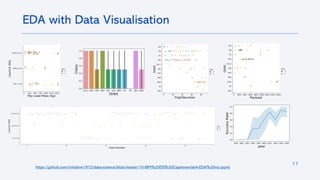
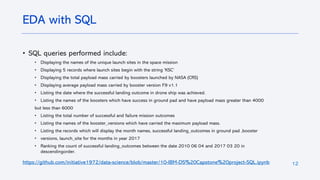
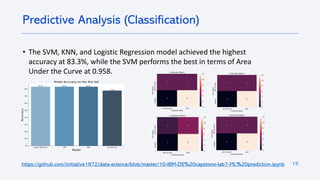

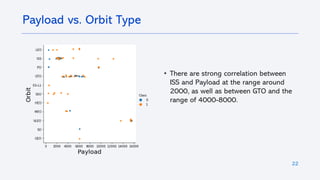
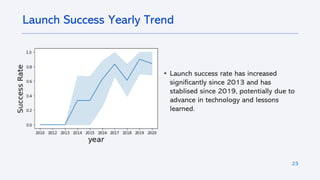
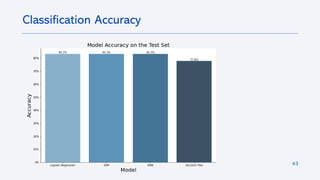
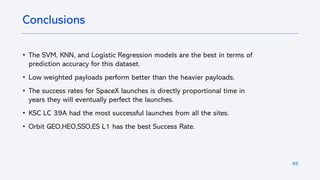


The document outlines a project focused on predicting the success of SpaceX's Falcon 9 rocket landings by utilizing data collected from the SpaceX REST API and web scraping from Wikipedia. A variety of methodologies, including exploratory data analysis, interactive visualizations, and predictive analysis using classification models, were employed, ultimately revealing that the SVM, KNN, and logistic regression models achieved the highest prediction accuracy. Results indicated a significant success trend in SpaceX launches, particularly with lower payloads and specific launch sites.


![제 23회 보아즈(BOAZ) 빅데이터 컨퍼런스 - [MBOAX] : ABSA를 활용한 소비자 반응 분석 기반 운영 효율화 대시보드 설계](https://cdn.slidesharecdn.com/ss_thumbnails/3-1boaz23rdconferencemboax-260203102709-9d519923-thumbnail.jpg?width=640&height=640&fit=bounds)


