This document discusses several population theories and models:
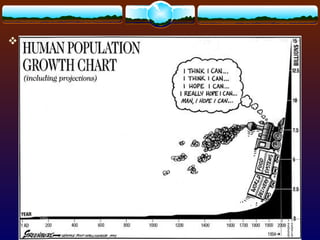
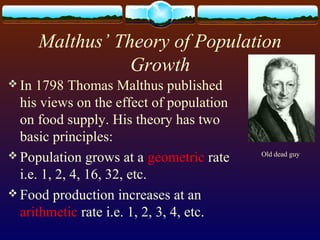
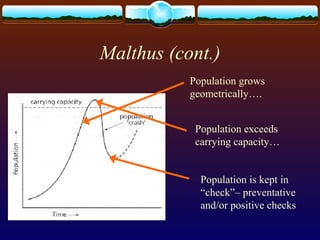
1. Malthus' theory proposed that population grows geometrically while food production increases arithmetically, eventually leading to famine and population decline through preventative or positive checks.
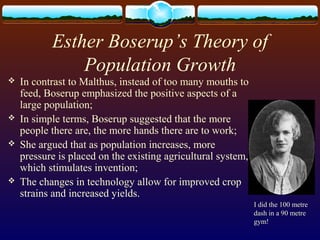
2. Boserup emphasized that larger populations stimulate technological innovation in agriculture, allowing for increased food production.
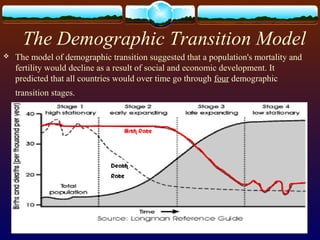
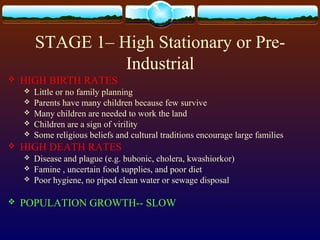
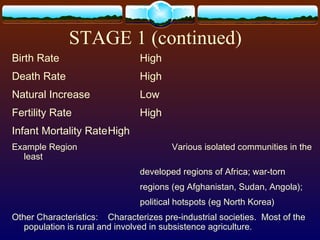
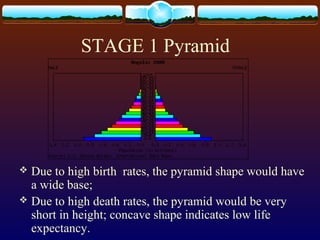
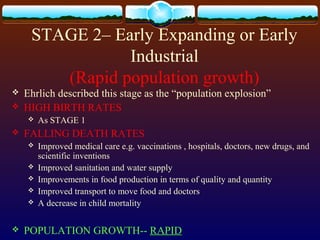
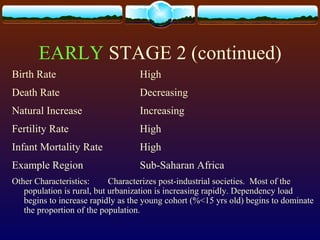
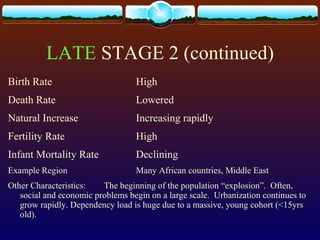
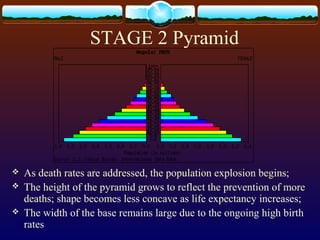
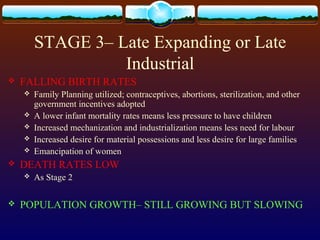
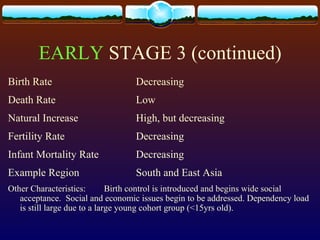
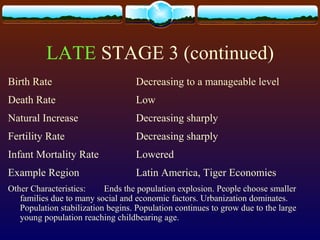
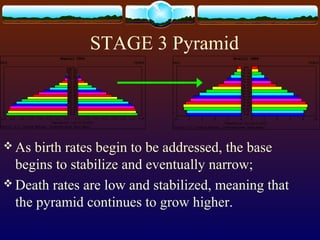
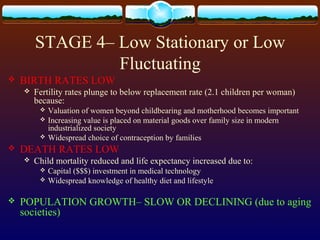
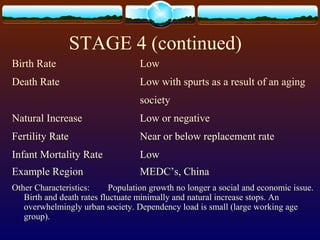
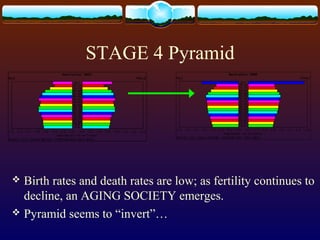
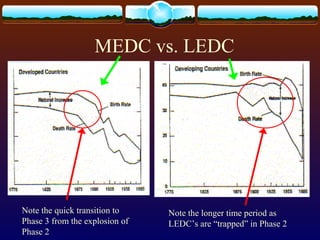
3. The Demographic Transition Model predicts that populations will progress through four stages as mortality and fertility decline due to development, eventually reaching low, stable population growth.
4. Criticisms note the model overgeneralizes and ignores variables like war, status of women, and challenges for LEDCs to industrialize.