Downloaded 118 times
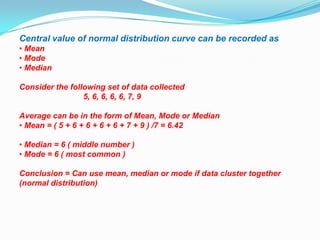
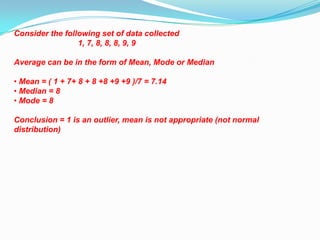
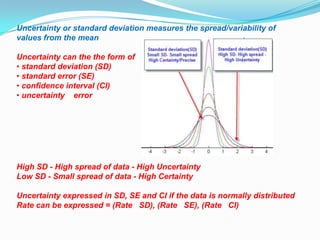
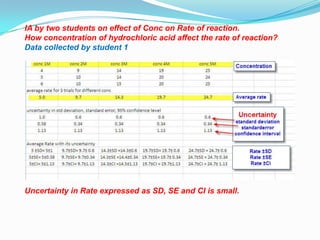
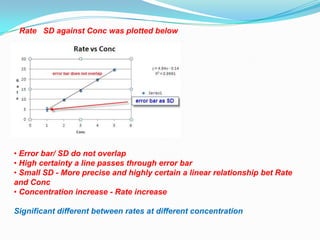
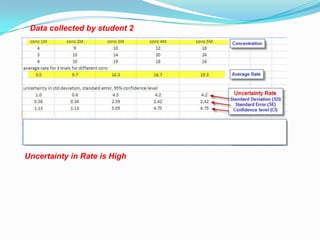
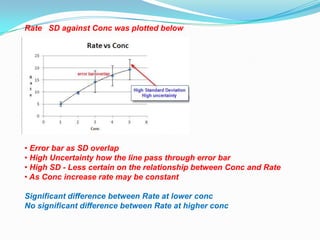
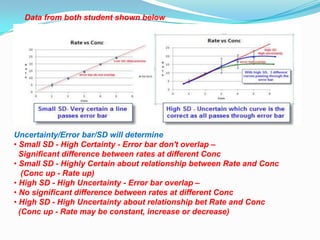


The document discusses error analysis, standard deviation, and t-tests in the context of evaluating data sets with different distributions. It explains how to calculate mean, median, and mode, highlighting the appropriate use of measures of central tendency based on data clustering and outliers. Additionally, it emphasizes the implications of standard deviation on the certainty of the relationship between concentration and reaction rate, illustrated through examples from two students' experiments.


