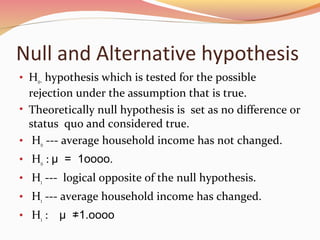
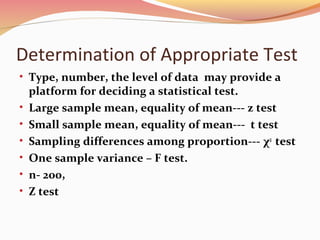
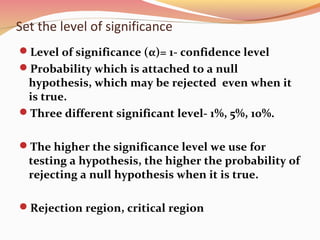
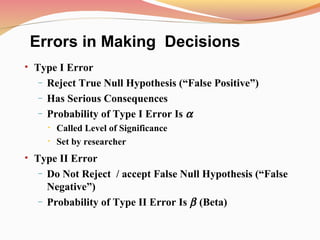
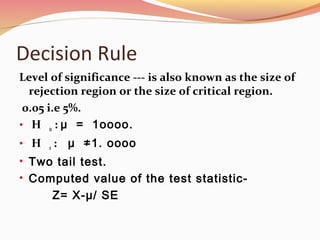
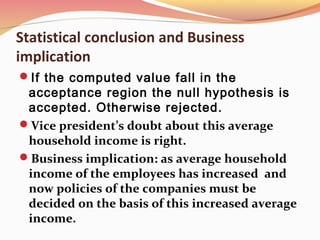
Presented by
S O U R A V D A S
9836793076
INTRO
The ice cream market in India has witnessed a steady
growth over the years. The players in the organized
sector have slowly eaten into the market share of the
players of the unorganized sector. The total volume
of sales in the icecream market is projected to touch
330 million litres by 2014.
Unlike the market for other products , the Indian
icecream market is completely dominated by
national players such as AMUL, KWALITY, VADILAL
and some other regional players like, Metro diary in
Eastern Part of India, Arun in South India, Dinshaws
in West India. Multinationals are also trying to make
their presence felt in the market. Movenpick, Baskin
Robbins, Candia are few of them. The ice cream
market provides plenty of challenges and
opportunities to national as well as multinational
players. Both are ready to battle it out to gain control
of the market.
• It has been estimated in 2008 that branded ice
creams have captured 40% of the total ice-cream
market. There is a possibility that heavy
advertisement and market penetration might
have changed this figure.
A researcher takes a random sample of size 2500
from Delhi. Out of the 2500 consumers surveyed,
1200 said that they purchase branded ice-
creams.
• The researcher wanted to test the figure 40% by
taking 95% as the confidence level.
• A Marketing Manager might be interested in assessing
the customers loyalty for a particular product .
• A personnel manager might be interested in knowing
the job satisfaction level of the employees .
• A financial manager might be interested in
understanding the financial aspect of the companie’s
retirement scheme.
• We cannot accept or reject a hypothesis about a
population parameter simply by intuition. Instead we
need to learn how to decide objectively, on the basis of
sample information, whether to accept or reject.
• A decision maker needs to collect sample data,
• compute the sample statistic,
• Use this information to ascertain the correctness
of the hypothesized population parameter.
• Researcher/ manager develop a hypotheses
which can be studied and explored.
Statistical Hypothesis
Assumption about a unknown population parameter.
Well defined procedure which helps us to decide
objectively whether to accept or reject the hypothesis
based on the information available from the sample.
Inferential Decision Algorithm
• A marketing research firm conducted a survey 10
years ago and found that average household
income of a particular geographical region is Rs
10000. Mr Gupta , new vice president of the firm,
has expressed doubt about the accuracy of the
data. He took random sampling of 200
households that yield a sample mean of Rs 11000.
Assume that population standard deviation of
the household income is Rs 1200. the vice
president wants to verify his doubt average
household income.
Null and Alternative hypothesis
• Ho– hypothesis which is tested for the possible
rejection under the assumption that is true.
• Theoretically null hypothesis is set as no difference or
status quo and considered true.
• Ho --- average household income has not changed.
• Ho : μ = 1oooo.
• H1 --- logical opposite of the null hypothesis.
• H1 --- average household income has changed.
• H1 : μ ≠1.oooo
Determination of Appropriate Test
• Type, number, the level of data may provide a
platform for deciding a statistical test.
• Large sample mean, equality of mean--- z test
• Small sample mean, equality of mean--- t test
• Sampling differences among proportion--- χ2
test
• One sample variance – F test.
• n- 200,
• Z test
Set the level of significance
Level of significance (α)= 1- confidence level
Probability which is attached to a null
hypothesis, which may be rejected even when it
is true.
Three different significant level- 1%, 5%, 10%.
The higher the significance level we use for
testing a hypothesis, the higher the probability of
rejecting a null hypothesis when it is true.
Rejection region, critical region
• Type I Error
– Reject True Null Hypothesis (“False Positive”)
– Has Serious Consequences
– Probability of Type I Error Is α
• Called Level of Significance
• Set by researcher
• Type II Error
– Do Not Reject / accept False Null Hypothesis (“False
Negative”)
– Probability of Type II Error Is β (Beta)
Errors in Making Decisions
Types of Errors…
A Type I error occurs when we reject a true null
hypothesis (i.e. Reject H0 when it is TRUE)
A Type II error occurs when we don’t reject a false null
hypothesis (i.e. Do NOT reject H0 when it is FALSE)
11.13
H0 T F
Reject I
Reject II
Hiring Policy Hypotheses
FAILURE TO HIRE A GOOD EMPLOYEE ( reject a
true null=type I error)
FAILURE TO REJECT A POOR EMPLOYEE
(accepting a false null type II error)
Set the decision Rule
Set the critical region-- acceptance region
( when the null is accepted)
Two tailed test--- contains the rejection
region of both the tails of the sampling
distribution of the test statistic.
One tailed test--- contains the rejection
region region on one tail of the sampling
distribution of a test statistic.
Left tailed test, right tail test.
 Marketing research firm conducted a survey
10 years ago and found that average
household income of a particular
geographical region is Rs 10000. Mr gupta ,
new vice president of the firm, has expressed
doubt about the accuracy of the data. He took
random sampling of 200 households that
yield a sample mean of Rs 11000. Assume that
population standard deviation of the
household income is Rs 1200. the vice
president wants to verify his doubt average
household income.
Decision Rule
Level of significance --- is also known as the size of
rejection region or the size of critical region.
0.05 i.e 5%.
• H o : μ = 1oooo.
• H 1 : μ ≠1. oooo
• Two tail test.
• Computed value of the test statistic-
Z= X-μ/ SE
Statistical conclusion and Business
implication
If the computed value fall in the
acceptance region the null hypothesis is
accepted. Otherwise rejected.
Vice president’s doubt about this average
household income is right.
Business implication: as average household
income of the employees has increased and
now policies of the companies must be
decided on the basis of this increased average
income.
Acceptance of Null Hypothesis
Does not prove that our null hypothesis is true.
Sample does not provide enough statistical
evidence to reject it.
The only way to accept the null hypothesis is to
know the population parameter.

Hypothesis testing STATISTICS NOTES ON HONOURS , MAJOR , ACTUARIAL SCIENCE by sourav sirs classes

  • 1.
    Presented by S OU R A V D A S 9836793076
  • 2.
    INTRO The ice creammarket in India has witnessed a steady growth over the years. The players in the organized sector have slowly eaten into the market share of the players of the unorganized sector. The total volume of sales in the icecream market is projected to touch 330 million litres by 2014. Unlike the market for other products , the Indian icecream market is completely dominated by national players such as AMUL, KWALITY, VADILAL and some other regional players like, Metro diary in Eastern Part of India, Arun in South India, Dinshaws in West India. Multinationals are also trying to make their presence felt in the market. Movenpick, Baskin Robbins, Candia are few of them. The ice cream market provides plenty of challenges and opportunities to national as well as multinational players. Both are ready to battle it out to gain control of the market.
  • 3.
    • It hasbeen estimated in 2008 that branded ice creams have captured 40% of the total ice-cream market. There is a possibility that heavy advertisement and market penetration might have changed this figure. A researcher takes a random sample of size 2500 from Delhi. Out of the 2500 consumers surveyed, 1200 said that they purchase branded ice- creams. • The researcher wanted to test the figure 40% by taking 95% as the confidence level.
  • 4.
    • A MarketingManager might be interested in assessing the customers loyalty for a particular product . • A personnel manager might be interested in knowing the job satisfaction level of the employees . • A financial manager might be interested in understanding the financial aspect of the companie’s retirement scheme. • We cannot accept or reject a hypothesis about a population parameter simply by intuition. Instead we need to learn how to decide objectively, on the basis of sample information, whether to accept or reject.
  • 5.
    • A decisionmaker needs to collect sample data, • compute the sample statistic, • Use this information to ascertain the correctness of the hypothesized population parameter. • Researcher/ manager develop a hypotheses which can be studied and explored.
  • 6.
    Statistical Hypothesis Assumption abouta unknown population parameter. Well defined procedure which helps us to decide objectively whether to accept or reject the hypothesis based on the information available from the sample.
  • 7.
  • 8.
    • A marketingresearch firm conducted a survey 10 years ago and found that average household income of a particular geographical region is Rs 10000. Mr Gupta , new vice president of the firm, has expressed doubt about the accuracy of the data. He took random sampling of 200 households that yield a sample mean of Rs 11000. Assume that population standard deviation of the household income is Rs 1200. the vice president wants to verify his doubt average household income.
  • 9.
    Null and Alternativehypothesis • Ho– hypothesis which is tested for the possible rejection under the assumption that is true. • Theoretically null hypothesis is set as no difference or status quo and considered true. • Ho --- average household income has not changed. • Ho : μ = 1oooo. • H1 --- logical opposite of the null hypothesis. • H1 --- average household income has changed. • H1 : μ ≠1.oooo
  • 10.
    Determination of AppropriateTest • Type, number, the level of data may provide a platform for deciding a statistical test. • Large sample mean, equality of mean--- z test • Small sample mean, equality of mean--- t test • Sampling differences among proportion--- χ2 test • One sample variance – F test. • n- 200, • Z test
  • 11.
    Set the levelof significance Level of significance (α)= 1- confidence level Probability which is attached to a null hypothesis, which may be rejected even when it is true. Three different significant level- 1%, 5%, 10%. The higher the significance level we use for testing a hypothesis, the higher the probability of rejecting a null hypothesis when it is true. Rejection region, critical region
  • 12.
    • Type IError – Reject True Null Hypothesis (“False Positive”) – Has Serious Consequences – Probability of Type I Error Is α • Called Level of Significance • Set by researcher • Type II Error – Do Not Reject / accept False Null Hypothesis (“False Negative”) – Probability of Type II Error Is β (Beta) Errors in Making Decisions
  • 13.
    Types of Errors… AType I error occurs when we reject a true null hypothesis (i.e. Reject H0 when it is TRUE) A Type II error occurs when we don’t reject a false null hypothesis (i.e. Do NOT reject H0 when it is FALSE) 11.13 H0 T F Reject I Reject II
  • 14.
    Hiring Policy Hypotheses FAILURETO HIRE A GOOD EMPLOYEE ( reject a true null=type I error) FAILURE TO REJECT A POOR EMPLOYEE (accepting a false null type II error)
  • 15.
    Set the decisionRule Set the critical region-- acceptance region ( when the null is accepted) Two tailed test--- contains the rejection region of both the tails of the sampling distribution of the test statistic. One tailed test--- contains the rejection region region on one tail of the sampling distribution of a test statistic. Left tailed test, right tail test.
  • 16.
     Marketing researchfirm conducted a survey 10 years ago and found that average household income of a particular geographical region is Rs 10000. Mr gupta , new vice president of the firm, has expressed doubt about the accuracy of the data. He took random sampling of 200 households that yield a sample mean of Rs 11000. Assume that population standard deviation of the household income is Rs 1200. the vice president wants to verify his doubt average household income.
  • 17.
    Decision Rule Level ofsignificance --- is also known as the size of rejection region or the size of critical region. 0.05 i.e 5%. • H o : μ = 1oooo. • H 1 : μ ≠1. oooo • Two tail test. • Computed value of the test statistic- Z= X-μ/ SE
  • 18.
    Statistical conclusion andBusiness implication If the computed value fall in the acceptance region the null hypothesis is accepted. Otherwise rejected. Vice president’s doubt about this average household income is right. Business implication: as average household income of the employees has increased and now policies of the companies must be decided on the basis of this increased average income.
  • 19.
    Acceptance of NullHypothesis Does not prove that our null hypothesis is true. Sample does not provide enough statistical evidence to reject it. The only way to accept the null hypothesis is to know the population parameter.