Downloaded 262 times
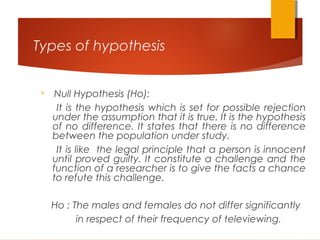
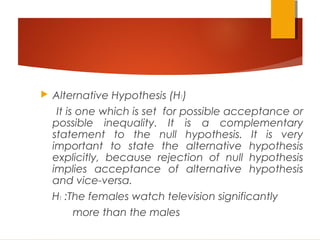
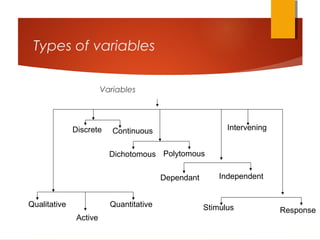
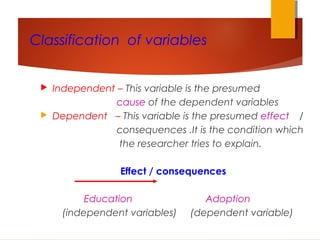
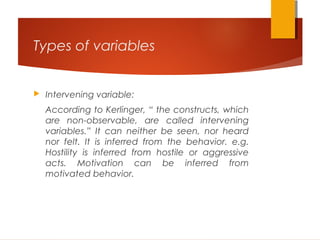
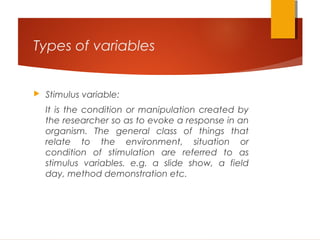
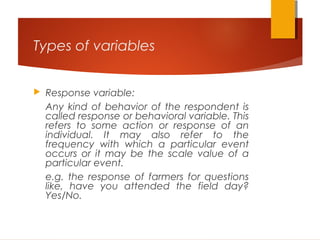

This document discusses hypotheses and types of variables in research. It defines a hypothesis as a conjectural statement about the relationship between two or more variables. A hypothesis guides research and can be tested. The document outlines null and alternative hypotheses and discusses types of variables such as independent, dependent, intervening, stimulus, response, quantitative, qualitative, discrete, continuous, dichotomous, and polytomous variables. It provides examples to illustrate each variable type.