The document presents a non-isothermal multi-cell model for pressure swing adsorption (PSA) processes. The model accounts for non-isothermal effects and heat transfer between the adsorbed and bulk phases. It is validated using reported simulation and experimental data for hydrogen purification from a five-component mixture using a six-bed PSA process. The model dynamically simulates the PSA process steps while incorporating non-isothermal effects and can be adapted to different adsorption/desorption kinetics and thermodynamics.
![Non-isothermal Multi-cell Model for pressure
swing adsorption process
Anshu Shukla, Satyanjay Sahoo, Arun S. Moharir*
Department of Chemical Engineering, Indian Institute of Technology Bombay, Mumbai, 400076, India
a r t i c l e i n f o
Article history:
Received 2 September 2016
Received in revised form
29 November 2016
Accepted 30 November 2016
Available online xxx
Keywords:
PSA process
Multi-cell Model
Multi-component system
Non-isothermal effects
Hydrogen purification
a b s t r a c t
In the present study, a comprehensive generic model is developed for pressure swing
adsorption process. The model overcomes the inadequacy related to frozen solid concept,
isothermality assumption etc. and treats them as per physics of adsorption as well as
hydrodynamics. Results are presented to show that there is significant adsorption/
desorption during pressure changing steps (pressurization, blowdown), which in turn has
significant effect on process performance. Hydrogen pressure swing adsorption process
demands high purity and recovery, which can be achieved by complex cycle configuration.
It has been used as a case study. The model is validated using the reported simulation/
experimental data to the extent possible. The present study reports separation of Hydrogen
from five-component mixture using a six-bed process. The dynamics of the process were
studied and are presented incorporating non-isothermal effects. The model is easily
adaptable to different adsorption/desorption kinetics and thermodynamics due to its
effective decoupling of bed hydrodynamics from adsorption/desorption.
© 2016 Hydrogen Energy Publications LLC. Published by Elsevier Ltd. All rights reserved.
Introduction
Adsorptive separation technologies have found a very wide
application base. Considering the separation objectives, wide
ranges of process variations have been established for use on
commercial scale. The various adsorption processes for gas
phase separation are Temperature Swing Adsorption (TSA),
Thermal Pressure Swing Adsorption (TPSA), and Pressure
Swing Adsorption (PSA) [1]. PSA is widely used because of its
advantages like low energy requirement and capital invest-
ment cost up to a certain scale of operation. Like all adsorptive
separations, the PSA process is also discrete-continuous in
nature and several cycles are required to attain Cyclic Steady
State (CSS) performance. Literature reports experimental and
theoretical studies for several industrially important gaseous
separations using PSA process. Hydrogen purification is
possibly the most major and widely used PSA process in terms
of its scale [2]. A one dimensional model on Comsol platform
for multi-component system for Hydrogen purification is re-
ported by Xiao et al. [3]. Few researchers report modeling
approach for PSA process for high purity hydrogen for fuel cell
application [4,5]. Air drying, Air separation to get enriched
oxygen or nitrogen are other two widely used techniques [6].
Most PSA processes give one desired product richer in one of
the feed components. PSA processes where more than one
components of the feed are sought to be enriched are rare.
Cen and Yang reported bulk separation of equimolar
mixture of Methane (CH4) and Hydrogen (H2) using a 5-step
PSA process [2]. The five cyclic steps include pressurization,
adsorption, co-current depressurization, counter current
depressurization and purge. They report 90% purity for both
* Corresponding author. Fax: þ91 22 2572 6895.
E-mail address: amoharir@iitb.ac.in (A.S. Moharir).
Available online at www.sciencedirect.com
ScienceDirect
journal homepage: www.elsevier.com/locate/he
i n t e r n a t i o n a l j o u r n a l o f h y d r o g e n e n e r g y x x x ( 2 0 1 6 ) 1 e1 8
http://dx.doi.org/10.1016/j.ijhydene.2016.11.200
0360-3199/© 2016 Hydrogen Energy Publications LLC. Published by Elsevier Ltd. All rights reserved.
Please cite this article in press as: Shukla A, et al., Non-isothermal Multi-cell Model for pressure swing adsorption process, International
Journal of Hydrogen Energy (2016), http://dx.doi.org/10.1016/j.ijhydene.2016.11.200](https://image.slidesharecdn.com/f808ee56-db9f-4d88-a676-9cc720695a6c-170117084410/85/HydrogenPSA-1-320.jpg)
![Non-isothermal Multi-cell Model for pressure
swing adsorption process
Anshu Shukla, Satyanjay Sahoo, Arun S. Moharir*
Department of Chemical Engineering, Indian Institute of Technology Bombay, Mumbai, 400076, India
a r t i c l e i n f o
Article history:
Received 2 September 2016
Received in revised form
29 November 2016
Accepted 30 November 2016
Available online xxx
Keywords:
PSA process
Multi-cell Model
Multi-component system
Non-isothermal effects
Hydrogen purification
a b s t r a c t
In the present study, a comprehensive generic model is developed for pressure swing
adsorption process. The model overcomes the inadequacy related to frozen solid concept,
isothermality assumption etc. and treats them as per physics of adsorption as well as
hydrodynamics. Results are presented to show that there is significant adsorption/
desorption during pressure changing steps (pressurization, blowdown), which in turn has
significant effect on process performance. Hydrogen pressure swing adsorption process
demands high purity and recovery, which can be achieved by complex cycle configuration.
It has been used as a case study. The model is validated using the reported simulation/
experimental data to the extent possible. The present study reports separation of Hydrogen
from five-component mixture using a six-bed process. The dynamics of the process were
studied and are presented incorporating non-isothermal effects. The model is easily
adaptable to different adsorption/desorption kinetics and thermodynamics due to its
effective decoupling of bed hydrodynamics from adsorption/desorption.
© 2016 Hydrogen Energy Publications LLC. Published by Elsevier Ltd. All rights reserved.
Introduction
Adsorptive separation technologies have found a very wide
application base. Considering the separation objectives, wide
ranges of process variations have been established for use on
commercial scale. The various adsorption processes for gas
phase separation are Temperature Swing Adsorption (TSA),
Thermal Pressure Swing Adsorption (TPSA), and Pressure
Swing Adsorption (PSA) [1]. PSA is widely used because of its
advantages like low energy requirement and capital invest-
ment cost up to a certain scale of operation. Like all adsorptive
separations, the PSA process is also discrete-continuous in
nature and several cycles are required to attain Cyclic Steady
State (CSS) performance. Literature reports experimental and
theoretical studies for several industrially important gaseous
separations using PSA process. Hydrogen purification is
possibly the most major and widely used PSA process in terms
of its scale [2]. A one dimensional model on Comsol platform
for multi-component system for Hydrogen purification is re-
ported by Xiao et al. [3]. Few researchers report modeling
approach for PSA process for high purity hydrogen for fuel cell
application [4,5]. Air drying, Air separation to get enriched
oxygen or nitrogen are other two widely used techniques [6].
Most PSA processes give one desired product richer in one of
the feed components. PSA processes where more than one
components of the feed are sought to be enriched are rare.
Cen and Yang reported bulk separation of equimolar
mixture of Methane (CH4) and Hydrogen (H2) using a 5-step
PSA process [2]. The five cyclic steps include pressurization,
adsorption, co-current depressurization, counter current
depressurization and purge. They report 90% purity for both
* Corresponding author. Fax: þ91 22 2572 6895.
E-mail address: amoharir@iitb.ac.in (A.S. Moharir).
Available online at www.sciencedirect.com
ScienceDirect
journal homepage: www.elsevier.com/locate/he
i n t e r n a t i o n a l j o u r n a l o f h y d r o g e n e n e r g y x x x ( 2 0 1 6 ) 1 e1 8
http://dx.doi.org/10.1016/j.ijhydene.2016.11.200
0360-3199/© 2016 Hydrogen Energy Publications LLC. Published by Elsevier Ltd. All rights reserved.
Please cite this article in press as: Shukla A, et al., Non-isothermal Multi-cell Model for pressure swing adsorption process, International
Journal of Hydrogen Energy (2016), http://dx.doi.org/10.1016/j.ijhydene.2016.11.200](https://image.slidesharecdn.com/f808ee56-db9f-4d88-a676-9cc720695a6c-170117084410/75/HydrogenPSA-1-2048.jpg)
![the products. They concluded purge step to be an essential
step for achieving hydrogen purity and that pressurization
with H2 is more effective than pressurization with feed. The
purity of CH4 depends mainly on co-current depressurization.
With the increase in the commercial applications of PSA
process, it was realized that the process is not limited to
separation of binary components and can be extended to
separation of multi-component gas mixtures.
Doong and Yang reported separation of ternary mixture
(H2/CH4/CO2) over activated carbon as adsorbent [7]. They
restricted the studies to five cyclic steps. Effect of various
parameters such as pressure, temperature, size of adsorbent
particle and flow-rate were studied. They concluded that
Knudsen as well as surface diffusion governs the mass
transfer rates and reported that the simulation results are
comparable with experimental results. The surface diffusion
flux plays an important role and is able to predict correct dy-
namics in the bed.
Yang and Lee reported requirement of multi-layered
adsorbent bed PSA process for H2 recovery since single
adsorbent in the bed is unable to offer high purity for this
multi-component system [8]. The advantages include selec-
tivity for certain components of the feed to be removed and
prevention of any feed component getting adsorbed in an
adsorbent which displays very non-linear adsorption
isotherm and makes desorption of the same very difficult.
Difficulty in removing the adsorbed component during
regeneration steps can affect process performance drastically.
PSA technology for purification of Hydrogen often uses an
adsorbent bed with three different adsorbents stacked in
three layers in each adsorbent bed due to this consideration.
Selectivity, high adsorption capacity and ease of desorption
are all important aspects for commercial success of any PSA
process. Adsorbent development and process design have to
keep all these aspects in mind.
The recent research on PSA process is mostly on adsor-
bents. Literature reports use of adsorbents like polymeric
hollow fiber for CO2 capture. Use of MOF's for H2 purification is
also reported by Banu and co-workers [9]. PSA is often
modeled as an isothermal process. Heat effects in the bed due
to exothermic adsorption are generally ignored. This is a
reasonable simplification if the component being removed
adsorb sparingly or is present in the feed in smaller pro-
portions or the heat of adsorption is not very significant. The
heat effect studies are important especially for systems,
which do not satisfy these criteria. H2 purification is one such
system where temperature rise can affect the adsorption pa-
rameters significantly. Several authors have reported break-
through studies for hydrogen separation with heat effects in
the adsorbent bed [1,8,10,11].
Although the PSA process is discrete-continuous in nature,
two or more beds are employed to ensure that the product is
produced continuously from one of the beds at any time.
Literature reports use of 2, 3 or even more beds, depending on
the relative ease of adsorption/desorption. This often is gov-
erned by the nature of adsorption thermodynamics. Non-
linear the adsorption isotherm is, more difficult is desorp-
tion as compared to adsorption and more is the required time
for bed regeneration after the productive adsorption step. This
in turn will entail use of more than 2 adsorbent beds, with one
undergoing adsorption and others undergoing various stages
of desorption. The sequence of the steps in the adsorbent bed
has to be synchronized for continuous production of the
desired product stream.
For PSA process, valves, which let the gas in or out of the
bed, play an important role. Although the valves are mostly of
on-off type, authors have studied and reported importance of
using flow control valves with the percentage opening of the
valves changing with time to implement optimum flow pro-
files [12]. PSA process involves several steps to achieve desired
process performance. The various steps are pressurization,
feed adsorption, co-current depressurization, counter current
depressurization, purge, pressure equalization, counter cur-
rent pressurization, and incubation/idle.
Non-isothermal Multi-cell Model is reported in the present
study for PSA process to understand the heat effects involved
during the various PSA process steps and their overall impact
on process performance. A Multi-cell Model for isothermal
PSA process has been discussed earlier [13]. The model is
extended here to incorporate heat effects of adsorption/
desorption as well as heat loss-gain from bed walls. The model
was also extended to support additional PSA steps such as
pressure equalization, provided purge (used in many H2 PSA
processes). With this, the model could compare its predictions
with reported experimental results in the literature as well as
alternative modeling approaches. The present model is vali-
dated for isothermal and non-isothermal systems [7,12,13].
The values of Langmuir adsorption parameter (b) and mono-
layer saturation capacities (qs
) are calculated from the
adsorption isotherm reported in the literature [8]. The values
of “b” and “qs
” were used in Extended Langmuir (EL) Isotherm
to describe adsorption thermodynamics. Linear Driving Force
Model (LDFM) was used to describe mass transfer rate.
Multi-cell PSA model
Industrial PSA processes consist of complex cyclic steps such
as pressurization, adsorption, co-current depressurization,
countercurrent depressurization, purge, pressure equaliza-
tion, and counter current pressurization. The significance and
purpose of the steps is widely discussed in the literature
[7,12,13]. These and more steps are supported by our modeling
approach. The steps are discussed here in brief.
In the pressurization step, the bed is pressurized either
with feed or with desired product component. In the adsorp-
tion step, feed enters the bed and effluent obtained is richer in
the desired component than in the feed. This is also called as
raffinate product. To recover more such raffinate product, co-
current depressurization step follows feed adsorption step. In
this step, the feed valve is closed and bed is allowed to
depressurize into the raffinate tank. At the end of this step, the
bed does not have capacity to adsorb the undesired compo-
nents from the feed and must be regenerated. For this, the bed
is depressurized in counter current direction to recover
strongly adsorbed component as another product stream.
This stream is richer in the undesired components than the
feed stream and is called as extract stream. This step is often
called as blowdown or counter current depressurization step.
The bed is partly regenerated in this step as the undesired
i n t e r n a t i o n a l j o u r n a l o f h y d r o g e n e n e r g y x x x ( 2 0 1 6 ) 1 e1 8 3
Please cite this article in press as: Shukla A, et al., Non-isothermal Multi-cell Model for pressure swing adsorption process, International
Journal of Hydrogen Energy (2016), http://dx.doi.org/10.1016/j.ijhydene.2016.11.200](https://image.slidesharecdn.com/f808ee56-db9f-4d88-a676-9cc720695a6c-170117084410/85/HydrogenPSA-3-320.jpg)
![component in the bulk phase of the bed and is mostly recov-
ered as the extract stream. Part of the undesired components
that were adsorbed in the adsorbent during earlier steps also
desorbs because low-pressure favors desorption. As a finish-
ing or cleaning step to further regenerate the bed, purge step is
used after the blowdown step. In this step, part of the raffinate
is allowed to flow through the bed in counter current direction
to the feed to collect more extract stream. The bed is then
pressurized with raffinate stream in counter current direction.
This fills the raffinate end of the bed with previously collected
raffinate and simultaneously pressurizes it. The bed is now
ready to undergo next PSA cycle starting with feed pressuri-
zation. Additional steps in more recent PSA processes have
also been reported [14]. These steps are conceived to improve
both purity and recovery. Some of these steps also reduce
energy footprint of separation by PSA. In addition to these
steps, incubation or idle step is used, where all the valves of a
bed are closed. This step is mainly provides finite time in-
tervals between the production and regeneration parts of the
bed to take into account finite time taken by any valve to close
or open. Without these short duration incubation steps, there
is a possibility of feed short-circuiting into product lines,
thereby degrading product purity. The pressure equalization
steps mainly are energy saving steps. In pressure equalization
step, the high and low-pressure adsorbent beds are connected
through a valve. One of the possibilities can be where the
connection is topetop, which means raffinate end of the two
adsorbent beds are connected through a valve. The second
possibility can be top-bottom; meaning the raffinate end of
high-pressure adsorbent bed is connected with the feed (also
extract) end of the low-pressure adsorbent bed through a
valve. The third possibility can be the bottomebottom,
meaning feed ends of both the beds are connected through a
valve. The fourth possibility can be bottom-top where feed
end of high-pressure bed is connected with the raffinate end
of the low-pressure bed. Topetop connection during pressure
equalization step is more common than the other alterna-
tives. Apart from acting as an energy saving step, the pressure
equalization step also reduces the losses that occur during
blowdown step and consequently increases the recovery of
the desired product. Several simulation models assume that
the adsorbent in the beds involved in these steps are ‘frozen’
during the steps and that there is no mass transfer between
the adsorbed and bulk phase. This is however not true and the
beds are fully ‘active’ during these steps and significant
adsorption/desorption occurs having direct impact on product
purity. The present model, therefore, supports phenomeno-
logical capture of the events during these steps.
Another step, the provided purge step is incorporated in
some PSA processes, especially some designs of Hydrogen
PSA, to improve raffinate product (enriched hydrogen) purity.
In this step, the bed with high pressure is connected to the bed
with lower pressure as in the pressure equalization step, but
with the extract valve of the low-pressure bed open. The
discharge from the lower pressure bed contributes to the
extract stream, or even collects as second extract streams that
depend on the requirement. This step helps in effectively
purging the bed without having to use raffinate for the pur-
pose. The step simultaneously improves raffinate purity as
well as recovery. This is one of the few parameters in a PSA
process that favorably affects purity and recovery both. Most
other measures give higher purity at the cost of recovery and
vice versa. Our model supports this step also.
For brevity, the acronyms used in the present study are PF,
FA, DE, DR, RP, PR, PE, PP, CP and ID for Pressurization with
Feed, Feed Adsorption, Desorption to Extract, Desorption to
Raffinate, Raffinate Purge, Pressurization with Raffinate,
Pressure Equalization, Provided Purge, Counter current
Pressurization and Idle (Incubation) respectively.
Description of Multi-cell Model
Rajasree et al. have discussed one of the possibilities for PSA
process model to overcome the disadvantages associated with
frozen solid concept in pressure changing steps [15]. In gen-
eral, there are two distinct phenomena happening in the bed
at any time. There is convective flow due to pressure differ-
ential between the two ends of the bed connected to tanks at
different pressures and simultaneous adsorption/desorption
between the bulk phase at any location in the bed and the
adsorbent at that location. These two phenomena occur at
quite different speeds with the convective flow happening
much faster than the adsorptionedesorption. Rajasree et al.
assumed instantaneous response to pressure differential
causing convective flow at the beginning of every step fol-
lowed by continuous adsorption/desorption over the time step
[15]. The difference between the two time scales is stretched
to the extreme by shrinking the convective flow due to pres-
sure differential happening instantaneously. The Multi-cell
Model carries this concept forward systematically as follows.
A PSA process could employ several beds, two and three
bed processes being quite common. However, each bed goes
through an identical sequence of steps as discussed above
with a phase lag with the other beds. Therefore, it suffices to
consider the steps implemented over one of the beds to get the
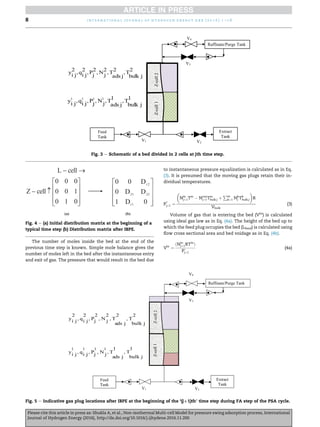
overall process performance at the cyclic steady state. Fig. 1
show a representative packed bed connected to various
tanks through valves. Valve V1 connects the feed tank and
adsorbent bed. Valve V2 connects the extract tank and
adsorbent bed. Similarly, Valves V3 and V4 connect the
adsorbent bed with purge tank and raffinate tank respectively.
Valves used for bed-to-bed connections as required in pres-
sure equalization and provided purge steps are not shown
explicitly in the figure. These valves are presumed to provide
the necessary flow connectivity between the two beds without
causing any pressure drop due to flow across the valves.
Valves play an important role in any PSA process and the flow
exchange between the bed and a tank is governed entirely by
the pressure differential between the tank pressure and the
pressure at the bed end connected to the valve. These flow
rates are calculated using standard valve equations involving
valve coefficients.
To implement any of the PSA cycle steps discussed earlier,
except the PE and PP steps, two valves each at the bottom and
the top of the bed are sufficient. Such a simplified view of the
bed is taken while explaining the salient features of the Multi-
cell Model. Therefore, the bed in Fig. 1 has two valves (V1 and
V2) at one end connected to two different tanks (say Feed Tank
and Extract Tank) and two valves (V3 and V4) at the opposite
end connected similarly to the same or two different tanks.
i n t e r n a t i o n a l j o u r n a l o f h y d r o g e n e n e r g y x x x ( 2 0 1 6 ) 1 e1 84
Please cite this article in press as: Shukla A, et al., Non-isothermal Multi-cell Model for pressure swing adsorption process, International
Journal of Hydrogen Energy (2016), http://dx.doi.org/10.1016/j.ijhydene.2016.11.200](https://image.slidesharecdn.com/f808ee56-db9f-4d88-a676-9cc720695a6c-170117084410/85/HydrogenPSA-4-320.jpg)
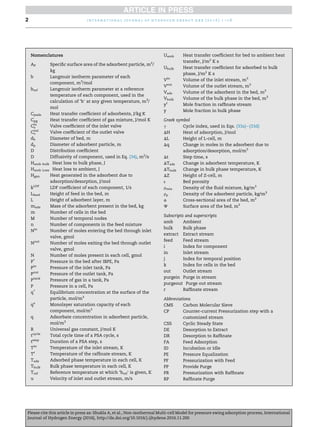
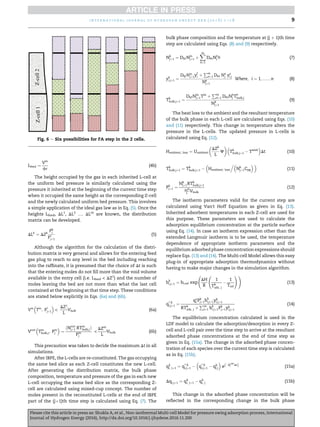
![Distribution matrix for 2 cells in the bed
For the purpose of conceptual clarity, the structure of distri-
bution matrix is explained considering that the bed is divided
into two cells (m ¼ 2) as shown in Fig. 3 at “jth” time step. The
distribution matrix will then be a 3 Â 3 matrix in this case. The
composition, pressure and temperature in the Z-cells and the
corresponding L-cells which govern adsorption/desorption
can be calculated using the distribution matrix. Fig. 4(a) shows
the distribution matrix for a bed divided into two cells at the
beginning of the jth time step as well as at the end of IBPE
during this step. After the completion of the jth time step, the
Z-cells and the L-cells have the same size. Their specifications
are inherited for the simulation of the next, i.e. (j þ 1)th time
step. The feed is yet to enter and the raffinate yet to leave. At
this stage, all the elements in the first column and the last row
of the distribution matrix are zero as shown in Fig. 4(a). The
height of each Z-cell is same as the height of the corre-
sponding L-cell and only the elements corresponding to each
combination are 1 in the inherited distribution matrix. The
IBPE step for the (j þ 1)th time step begins with this status.
Fig. 5 displays one of the possible bed conditions at the end
of the IBPE step of the (j þ 1)th time step. The operational PSA
cycle step is the FA step as indicated in the figure during which
the feed enters and the raffinate leaves from the bed. The bulk
phase composition, pressure and temperature in each
inherited L-cell as well as the solid phase composition and
temperature in each inherited Z-cell are
yk
i;j; Tk
bulk j Pk
j ; Nk
j ; qk
i; j; Tk
ads j. The index ‘k’ depicts spatial posi-
tion in the bed that varies in this simplified case from 1 to 2.
The color codes for the gas in inherited L-cells in Fig. 5 are
given below along with the color code for the feed plug that
will enter as a part of IBPE step.
Fig. 5 shows only one of the scenarios possible during IBPE
step. The feed has moved in but stays entirely within the bulk
phase against Z-cell 1, the gas in the inherited L-cell 1 has
moved up and straddles across both the Z-cells and the gas in
the inherited L-cell 2 has also moved up with a part occupying
position against Z-cell 2 and the remaining part moving out of
the bed contributing to the raffinate stream. There are other
possible scenarios depending upon the amounts of gas
entering and leaving and also the extent to which the gas in
the inherited cells expand/compress due to pressure equal-
ization. It can be shown that for the present case of the bed
being divided into 2 cells, the total possibilities are 6 in num-
ber. The six possibilities are shown qualitatively in Fig. 6. The
movement of the three gas plugs (feed plug and gas in
inherited L-cell 1 and L-cell 2) relative to the two static Z-cells
is shown. The figure is self explanatory. The first of the six
possibilities corresponds to Fig. 6. The only non-zero elements
in the distribution matrix for this case which help define the
gas quality in the reconstituted L-cells will be as shown in
Fig. 4(b). In general, the number of distinct possibilities for
positioning of gas in the inherited L-cells and the entering feed
plug in FA step are m  (m þ 1). Sahoo has discussed the
quantitative aspect of generation of the distribution matrix in
detail [13].
The calculations are valid for multi-component system.
The index ‘i’ depicts the component. The time index is ‘j’ and
it varies from 0 e M, M being the total number of temporal
divisions of any PSA step duration. After the IBPE part of the
(j þ 1)th time step is executed, L-cells will be reconstituted
which will attain the same position as the corresponding Z-
cells in the bed. Fig. 5 shows the movement of the gas plugs
that were occupying void space in each bed cell along with the
feed gas plug that has pushed itself up in the bed. The
nomenclature for various parameters is shown as valid for the
end of the time step j. At the end of the next time step (j þ 1),
similar nomenclature will be valid with j replaced by (j þ 1).
The following procedure is a step by step explanation to get
various parameter values at the end of time step (j þ 1) from
the values at the end of step j. It can be used recursively to
march in time starting with j ¼ 1 to j ¼ M.
Governing equations
Consider an adsorbent bed divided into ‘m’ cells performing
FA step as shown in Fig. 1. In FA step, the inlet valve (V1) and
outlet valve (V4) are open throughout the duration of the time
step. The following set of equations present the method to
simulate the happenings over the ‘j þ 1’ time step given the
conditions in the bed at the end of the jth time step. The
equations are applicable recursively over every time step into
which the PSA step is divided.
The velocities of the inlet/outlet streams are calculated by
using the valve equations as shown in Eqs. (1a) and (1b).
uin
jþ1 ¼ Cin
v
ffiffiffiffiffiffiffiffiffiffiffiffiffiffiffiffiffiffiffiffiffiffiffiffiffiffiffiffiffiffiffiffiffiffiffiffiffiffiffiffiffiffiffiffi
Pin
ÀP1
j
rðevaluated at Pin
Þ
v
u
u
t (1a)
uout
jþ1 ¼ Cout
v
ffiffiffiffiffiffiffiffiffiffiffiffiffiffiffiffiffiffiffiffiffiffiffiffiffiffiffiffiffiffiffiffiffiffiffiffiffiffiffiffiffiffiffiffiffiffi
Pm
j ÀPout
r
evaluated at P
m
j
v
u
u
u
t (1b)
The number of moles entering and exiting the adsorbent
bed is calculated using ideal gas law as given in Eqs. (2a) and
(2b).
Nin
jþ1 ¼
uin
jþ1f Pin
Dt
RTin
(2a)
Nout
jþ1 ¼
uout
jþ1fPm
j Dt
RTm
bulk;j
(2b)
L-cell 1
L-cell 2
feed plug
i n t e r n a t i o n a l j o u r n a l o f h y d r o g e n e n e r g y x x x ( 2 0 1 6 ) 1 e1 8 7
Please cite this article in press as: Shukla A, et al., Non-isothermal Multi-cell Model for pressure swing adsorption process, International
Journal of Hydrogen Energy (2016), http://dx.doi.org/10.1016/j.ijhydene.2016.11.200](https://image.slidesharecdn.com/f808ee56-db9f-4d88-a676-9cc720695a6c-170117084410/85/HydrogenPSA-7-320.jpg)
![Purity ð%Þ ¼ 100
PM
j¼1 Nr
j yr
n; j
#
Production step
PM
j¼1 Nr
j
#
Production step
(31)
Throughput ¼
PM
j¼1 Nin
j
#
Production step
Vadsrpðtcycle
Þ
(32)
PSA cycles are simulated by simulating sequential steps
that comprise the cycle. For the purpose of process perfor-
mance evaluation, what is important is the Cyclic Steady State
(CSS) performance. Multiple criteria have been used in the
present work to decide whether the CSS is reached or not.
These are given in Eqs (33a)e(33d). In the first condition, Eq.
(33a), we compare the time averaged raffinate tank composi-
tion of two consecutive PSA cycles. If the absolute difference is
under the stipulated tolerance, the CSS is considered to have
been reached. In the second and third conditions, Eqs. (33b)
and (33c) respectively, we compare the axial bulk phase and
adsorbed phase concentration profiles in the bed for two
consecutive cycles at the completion of one major step of the
production phase of any PSA cycle. We have chosen FA step
for this purpose in this work. In the fourth condition, Eq. (33d),
we compare the fractional recovery of two consecutive cycles.
It is the fraction of desired component present in the feed that
has reached in the raffinate stream. For example, in the case
of Nitrogen PSA which enriches Nitrogen in air, what fraction
of Nitrogen in the feed stream used over a PSA cycle has been
captured in the net raffinate withdrawal in the cycle would be
the fractional purity. Typical tolerance value used in the pre-
sent work is 0.00001.
nÀ
yr
n
Á
gthcycle
À
À
yr
n
Á
ðgÀ1Þth
cycle
o
e (33a)
n
yk
n; M
gthcycle
À
yk
n; M
ðgÀ1Þth
cycle
o
e for all k (33b)
1
1000
h
qk
i; M
gthcycle
À
qk
i; M
ðgÀ1Þth
cycle
i '
e for all k (33c)
1
100
h
Recoveryð Þgthcycle À Recoveryð ÞðgÀ1Þth
cycle
i '
e (33d)
Considering that the quantities being considered in Eqs.
(33a), (33b) and (33d) (mole fraction of raffinate, mole fraction
inside L-cells and fractional recovery respectively) are
normalized, this is a fairly stringent tolerance. To approxi-
mately get the condition on adsorbed phase concentration (Eq.
(33c)) to match with the same rigor, the adsorbed phase con-
centrations were divided by 1000 considering that their typical
maximum values are in the range of 600 (mol/m3
of adsorbent)
or so for the adsorbenteadsorbate system used in this work.
Results and discussions
The model is validated using the reported models and
experimental data. We have not done experimental validation
ourselves. The cases considered in this paper have been used
to demonstrate the versatility of our model in handling
isothermal and non-isothermal operation, multi-component
systems, multi-bed systems, and complex PSA cycles
involving a large number of distinct component steps.
The following cases have been considered:
Case 1: Binary mixture, isothermal system (comparison
with reported simulated performance)
Case 2: Ternary mixture, non-isothermal system (com-
parison with reported experimental results)
Case 3: Same as Case 2 except that comparison is with
reported simulated performance
These cases are discussed in detail in the following.
Case 1: Air separation for N2 enrichment using Carbon
Molecular Sieve (CMS) as adsorbent was studied. The adsor-
benteadsorbate properties are given in Table 1. The model
inputs and design parameters are given in Table 2. Isothermal
operation was mimicked by considering heat of adsorption as
zero in our non-isothermal PSA model. This was done to
established parity with two reported simulation models, one
being the isothermal rigorous model by Mhaskar et al. [12] and
another being an isothermal Multi-cell Model of Sahoo [13].
The adsorbateeadsorbent properties were taken as re-
ported by Mhaskar et al. [12]. The comparative results are
tabulated in Table 3. From the results, it can be seen that the
steady state performances predicted by the two models are
comparable. A minor discrepancy is found in performance
parameters, which can be attributed to the different time step
used in the present study (0.01 s), compared to that used in the
other two studies (0.02 s). Table 3 also shows the computa-
tional times required by the three models on identical
computing machine. The results show the advantages of
using Multi-cell Model over rigorous model in terms of time
taken for simulation. For rigorous model, it took 300 min as
compared to 5 min taken by the Multi-cell Model.
Case 2: The simulated results are validated for multi-
component, non-isothermal system by comparing it with
the experimental data presented by Doong and Yang [7].
Adsorptive separation of ternary mixture of H2/CH4/CO2 using
activated carbon as adsorbent is studied and results are pre-
sented. In the present study, the flow rates for input or output
streams are controlled by valves and do not remain constant
over PSA steps. However, Doong and Yang have reported
constant flow rates over FA and RP steps. Valve co-efficient for
relevant valves in our model were adjusted to give same in-
tegrated volumetric inflow over the corresponding steps. The
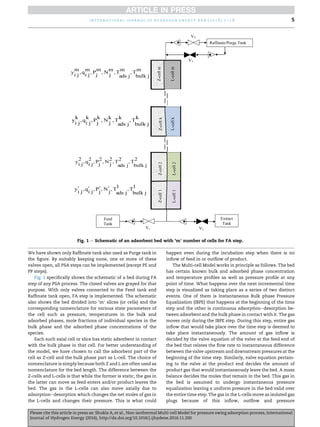
Table 1 e Adsorbenteadsorbate properties.
Feed component Case 1 Case 2 and Case 3 [7]
Parameters O2 N2 CH4 CO2 H2
Mole fraction of
components in
the feed, y
0.21 0.79 0.333 0.333 0.334
kLDF
(1/s) 0.038 0.0058 0.142 0.142 0.727
qs
(mol/m3
of particle) 2640 2640 5214 9444 1472
b (m3
/mol) 0.0035 0.00337 0.00258 0.00409 0.000951
i n t e r n a t i o n a l j o u r n a l o f h y d r o g e n e n e r g y x x x ( 2 0 1 6 ) 1 e1 8 11
Please cite this article in press as: Shukla A, et al., Non-isothermal Multi-cell Model for pressure swing adsorption process, International
Journal of Hydrogen Energy (2016), http://dx.doi.org/10.1016/j.ijhydene.2016.11.200](https://image.slidesharecdn.com/f808ee56-db9f-4d88-a676-9cc720695a6c-170117084410/85/HydrogenPSA-11-320.jpg)
![adsorbent properties like equilibrium constant and monolayer
saturation capacity in the Extended Langmuir model were
also calculated using the experimental adsorption isotherm
reported by Yang and Lee who used the same CMS [16].
Adsorbenteadsorbate properties are shown in Table 1.
Performance parameters were compared with the reported
experimental data. Equimolar feed mixture was used in the
experiment. The operating and design parameters are given in
Table 2. The process was run for five cyclic steps for the re-
covery of Hydrogen as raffinate. The experimental results for
Run 1 were considered for comparison of the results with the
present Multi-cell Model [13]. The cyclic sequence of PSA pro-
cess is as explained by Doong and Yang [7]. In step I, i.e. CP step,
pure H2 is used for pressurization of the bed. FA step follows
the CP step. In FA step, feed mixture is allowed to flow through
the bed. The raffinate collected in FA step is expected to have
maximum H2 purity. The DR step is divided into two parts
namely DR-1 and DR-2. It is as expected to recover additional
H2 in DR-1 and a stream rich in CH4 in DR-2 step. CO2 and CH4
are recovered in the DE and RP steps as extract stream.
The results are compared with the performances obtained
in the experiments as shown in Table 4. The simulated purity
of H2 is 99%, which compares reasonably well with the re-
ported experimental results. The mismatch in the results is
attributed to the LDF model used in our simulations to define
the adsorption kinetics. Doong and Yang had suggested that
the controlling mechanism could be simultaneous surface
and Knudsen diffusion. In addition, one of the reasons can be
that our flow rates are variable as they are governed by valve
coefficient and the pressure differential between the up-
stream and downstream locations of the valve. Doong and
Yang have reported averaged flow over the steps only [7]. In
our simulations, it is found that part of CO2 is collected in
raffinate tank with H2 and CH4 in DR-2 step, which is not the
case in the reported study. This also could be due to our model
not accounting for Knudsen diffusion. Effectively, we have
ignored the contribution of Knudsen diffusion. The surface
diffusion has been accounted for by equivalent LDF coefficient
as per Glueckauf relation [17]. Collectively, simultaneous
Knudsen and surface diffusion in their work possibly offers
somewhat different selectivities for the competing compo-
nents than pure surface diffusion simulated by us. We have
used Langmuir model with parameters extracted from re-
ported isotherms. Use of Loading Ratio Correlation (LRC)
model has not shown much deviation in the results.
Case 3: The model was also validated using simulated cy-
clic steady state performance and pressure-time profiles at
the feed end of the bed. The PSA cycle, adsorbent and the feed
were the same as in Case 2. As stated earlier in Case 2, the
mass transfer model used in the reported study was simul-
taneous surface and Knudsen diffusion model, whereas the
present simulation study considers linear driving force model.
The model inputs are same as for the experimental studies
except that the pressure for adsorption step is 26 bar and the
valve coefficients are accordingly adjusted to obtain inte-
grated flow rates matching with those reported for the
experimental studies. The comparison is between our CSS
results and the simulation results by Doong and Yang [7]. The
CSS was attained in 10 cycles as reported by Doong and Yang
Table 2 e Model inputs for simulation of PSA process.
Parameters Case 1 Case 2 Case 3
Inner diameter of bed, db (m) 0.035 0.051 0.051
Adsorbent layer height, L (m) 0.35 0.6 0.6
Duration of PF step, tPF
(s) 15 e e
Duration of FA step, tFA
(s) 60 180 180
Duration of DR-1 step, tDR-1
(s) e 120 215
Duration of DR-2 step, tDR-2
(s) e 270 265
Duration of DE step, tDE
(s) 15 60 120
Duration of RP step, tRP
(s) 60 60 120
Duration of CP step, tPR
(s) e 30 30
Feed valve coefficient, Cfeed
v 0.00021 0.00002 0.00016
Raffinate valve coefficient,
Cr
v [FA]
0.000018 0.0000015 0.0000046
Raffinate valve coefficient,
Cr
v [DR-1]
e 0.000008 0.0000095
Raffinate valve coefficient,
Cr
v [DR-2]
e 0.000005 0.000008
Extract valve coefficient,
Cextract
v
0.006 0.009 0.00007
Purge in valve coefficient,
Cpurgein
v
0.00011 0.000156 0.00005
Purge out valve coefficient,
Cpurgeout
v
0.00014 0.0000727 0.00008
Bed voidage, ε 0.5 0.78 0.78
Feed tank pressure, Pfeed
(bar) 3.039 9 26.2
Raffinate tank pressure,
Pr
(bar) [FA]
1.213 6 7
Raffinate tank pressure,
Pr
(bar) [DR-1]
e 3.3 6
Raffinate tank pressure,
Pr
(bar) [DR-2]
e 2.3 3.5
Extract tank pressure,
Pextract
(bar)
1 1.5 1.5
Purge tank pressure,
Ppurgein
(bar)
1.2 2.5 2.3
Purge tank pressure,
Ppurgeout
(bar)
1.0 1.5 2.3
Adsorption
Temperature, T (K)
303 300 300
Total cycle time, tcycle
(s) 150 720 720
Density of gas mixture at 1bar,
r (kg/m3
)
1.2 0.22 0.22
Density of adsorbent particle,
rp (kg/m3
)
980 850 850
Length of a time step, Dt (s) 0.01 0.01 0.01
Number of cells in the bed 40 30 30
Diameter of adsorbent particle,
dp (m)
0.0032 0.00056 0.00056
Cpads (J/kg.K) e 1050 1050
Cpg (J/mol.K) e 31.2 31.2
Table 3 e Model validation with reported performance
parameters.
Purity (%) Recovery (%) Time
(min)
Rigorous model [12] 94 18.6 300
Multi-cell Model [13] 93.8 18.3 5
Multi-cell Model
(This work)
93.7 18.8 5
i n t e r n a t i o n a l j o u r n a l o f h y d r o g e n e n e r g y x x x ( 2 0 1 6 ) 1 e1 812
Please cite this article in press as: Shukla A, et al., Non-isothermal Multi-cell Model for pressure swing adsorption process, International
Journal of Hydrogen Energy (2016), http://dx.doi.org/10.1016/j.ijhydene.2016.11.200](https://image.slidesharecdn.com/f808ee56-db9f-4d88-a676-9cc720695a6c-170117084410/85/HydrogenPSA-12-320.jpg)
![whereas in the present study CSS was attained in 28 cycles.
This could be due to very stringent CSS conditions adopted by
us. As in the earlier case, the valve coefficients for the various
valves were calculated by us using the average flow rate re-
ported by Doong and Yang for different steps. The stepwise
flow rates of various streams used by them and achieved by
our adjusted valve equations are compared in Table 5. There is
marginal difference in the flow rates as seen from the table.
The CSS performances are compared in Table 6. The slight
discrepancy in the results can be attributed to the different
mass transfer rate models used in the studies. Doong and
Yang have reported surface and Knudsen diffusion model as
accurate and concluded that results are almost comparable
with their experimental results. Simulation with diffusion
models involve solution of partial differential equations
capturing the phenomena and can consume a lot of compu-
tational time in solving the equations over each time step by
finite difference technique. It can be plugged in effortlessly in
the Multi-cell Model but at the cost of prohibitive computa-
tional efforts. We have instead used a simplified approxima-
tion of the surface diffusion model in terms of Linear Driving
Force (LDF) model and taken our LDF coefficient commensu-
rate with their surface diffusivity as per Glueckauf's approxi-
mation as follows [17]. Their being no equivalent
approximation for the Knudsen diffusion, we could not
consider the same. Our simulation results deviate from those
of Doong and Yang mainly for Methane. It could be because
the Knudsen diffusion, which we have ignored, changes
selectivity of adsorbent towards methane significantly which
our surface diffusion model approximation was not able to
capture.
k
LDF
i ¼
60Di
d
2
p
(34)
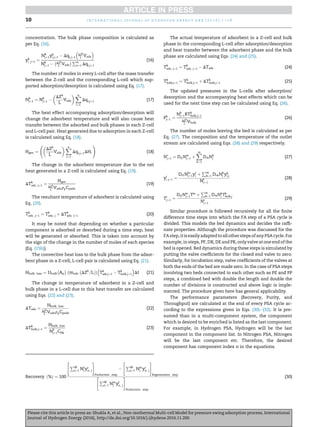
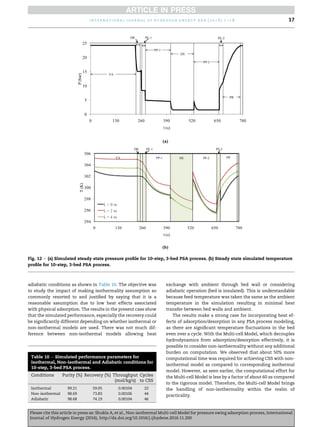
The authors also reported the experimental pressure pro-
file for this case [7]. The pressure profiles simulated by us were
compared with their experimental profiles. Fig. 7(a) shows the
pressure profile at CSS over the entire PSA cycle. The pressure
profile is plotted considering the pressure near the feed end of
the bed.
The model and experimental pressure profiles are in good
agreement that shows that the Multi-cell Model is able to
capture the bed hydrodynamics closely. Experimental tem-
peratureetime profiles were not reported. Our simulated
temperature profiles are as shown in Fig. 7(b).
The temperature profiles have been shown in the figure at
the bed bottom, middle, and top over the entire PSA cycle. The
durations of individual steps have been marked as distinct
color bands for a better feel. Considering that the feed tem-
perature is 289 K, the temperature rise of about 30 K due to
adsorption is significant and affects the performance signifi-
cantly. Doong and Yang have also reported temperature rise of
about 40 K in their experiment. They have, however not re-
ported temperature profiles for this experimental run. Simi-
larly, during regeneration steps, significant temperature drops
are evident due to desorption. As can be observed, the bed
temperatures go below even the feed temperature to about
282 K. The overall temperature swing of the bed is thus about
37 K. Doong and Yang have not reported such temperatures
below the feed temperature in their experimental work [7].
The temperature profiles at different bed heights also show
the mass transfer zones traveling in the bed with time as
evident from the crossover of temperature profiles.
Complex PSA process
After the above exercise to validate the Multi-cell Model with
reported experimental-simulated performance data, we have
tried to use the model for a more complex PSA process with 6,
8 and 10 step PSA cycle implemented on a 3 bed PSA process.
This is discussed in the following.
Industrial PSA process designs often employ several addi-
tional steps in the PSA cycle to improve process performance.
Hydrogen PSA is one important example. To demonstrate
working of our simulation model for complex PSA processes
like this as well as to quantitatively show the effect of these
so-called minor steps on process performance, we have car-
ried out simulation of a five-component mixture for H2 puri-
fication. AdsorbenteAdsorbate properties are mentioned in
Table 5 e Comparison of flow rates for Case 3.
Reported work [7] This work
Inlet Outlet Inlet Outlet
FA 33 17.1 32.3 16.9
DR-1 e 10.6 e 10.1
DR-2 e 3.6 e 4.14
DE, RP e, 1.9 19.6 e, 1.6 19.7
CP (H2) 14 e 16.9 e
Table 4 e Comparison of simulated and experimental performance parameters.
Purity % Recovery (%)
Reported
Work [7]
This Work Reported
Work [7]
This Work
Purity/Recovery (in terms of H2) of
raffinate stream collected in FA
and DR-1 steps in terms of H2
99 99.6 83 78
Purity/Recovery (in terms of CH4)
of raffinate stream collected in
DR-2 step
90 82.1 32 30
Purity/Recovery (in terms of CO2)
of extract stream collected in
DE and RP step
60 51.26 99 76.71
i n t e r n a t i o n a l j o u r n a l o f h y d r o g e n e n e r g y x x x ( 2 0 1 6 ) 1 e1 8 13
Please cite this article in press as: Shukla A, et al., Non-isothermal Multi-cell Model for pressure swing adsorption process, International
Journal of Hydrogen Energy (2016), http://dx.doi.org/10.1016/j.ijhydene.2016.11.200](https://image.slidesharecdn.com/f808ee56-db9f-4d88-a676-9cc720695a6c-170117084410/85/HydrogenPSA-13-320.jpg)
![Table 7. The design parameters are as shown in Table 8. The
simulations were performed for various steps of PSA process
considering energy saving step like pressure equalization. The
PP step is added after DR step so that initial purging can be
done with less pure component. This helps reduce raffinate
loss and thus recovery can be enhanced without adverse
impact on purity.
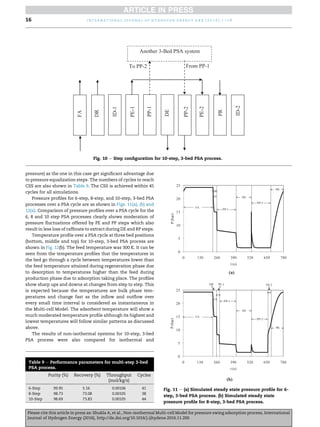
Separation performances were compared for 6-step, 8-
step, and 10-step, 3-bed PSA processes for same feed
mixture, desired product, total cycle time, bed design. This
helps in judging the relative importance of the various addi-
tional PSA steps on performance parameters, especially purity
and recovery. The 6-step PSA includes provided purge (PP)
step. The 8-step PSA includes PE as well as PP steps. In the 10-
step PSA process, we have included two short duration incu-
bation (ID) steps. Implementation of the PP step in all the three
PSA processes requires bed effluent from one bed to purge
another bed rather than using collected raffinate for the pur-
pose. For the given PSA cycle configurations, it was not
possible to use a bed in a 3-bed system to implement PP step
involving another concurrent step happening in another bed
of the same 3-bed system. A suitable bed in another identical
3-bed system is required to be used for this purpose. This
other 3-bed system follows the same PSA cycle, but with a
suitable time lag. Technically, the PSA system thus becomes a
6-bed system. This is very common in Hydrogen PSA in-
stallations. We have preferred to call it a 3-bed PSA because
the second 3-bed system essentially follows the same PSA
cycle as the first PSA system. The two 3-bed systems interact
with each other only during the PP step.
FA and DR steps in production phase collect the raffinate in
raffinate tank. PE-1 step follows the DE step. In this step, the
bed pressure is reduced and equalizes with another bed at
higher pressure operating PE-2 step. The PP step is imple-
mented on beds in one 3-bed system with a bed operating RP
step in another 3-bed PSA system. Effectively, one bed in one
system is undergoing co-current depressurization with the
effluent counter-currently purging another bed in another
system. The implementation thus called for topetop
connection of two beds in two systems.
The PE and PP steps require direct connection of two
adsorbent systems. This was achieved in simulation by con-
structing a ‘double’ bed by suitably connecting the cascade of
Z-cells in one bed to a cascade of Z-cells in another bed. This
double bed thus has double the number of Z-cells (2m). The
distribution matrix will thus be double the size and its gen-
eration is that much more involved. The conceptual approach
however remains the same as was discussed earlier.
Table 6 e Performance of PSA process at steady state for Non-isothermal system.
Steps CH4 CO2 H2
Reported work [7] This work Reported work [7] This work Reported work [7] This work
FA 0.1 0.2 0 0 99.9 99.8
DR-1 3.0 10.8 0.1 0.3 96.9 88.9
DR-2 89.9 82.3 0.6 6.1 9.5 11.6
DE 37.6 37.3 54.6 53.4 7.8 9.3
RP 37.6 37.3 54.6 53.4 7.8 9.3
(b)
(a)
280
290
300
310
320
330
0 310 620 930
T(K)
t (s)
L = 0.0 m
L = 0.3 m
L = 0.6 m
L =
L =
L =
=
=
=
0.0 m
0.3 m
0.6 m
FA DR-1 DR-2 DE RP
CP
0
5
10
15
20
25
0 310 620 930
P(bar)
t (s)
This Work
Reported Work [7]
FA
DR-1
DR-2
DE
RP
CP
Fig. 7 e (a) Comparison of experimental and simulated
pressure profiles at CSS. (b) Steady state simulated
temperature profile against time at various bed positions.
Table 7 e Adsorbenteadsorbate properties for 5-
components, 3-bed PSA process.
Parameter CH4 CO2 CO N2 H2
yfeed
(mole fraction) 0.005 0.015 0.01 0.02 0.95
b (m3
/mol) 0.0007 0.1 0.04 0.009 0.00008
kLDF
(sÀ1
) 0.001 0.00158 0.002 0.0025 0.003
qs
(mol/m3
) 2100 3510 3750 3920 4150
DH (J/mol) 35,119 14,350 8433 7817 246,400
i n t e r n a t i o n a l j o u r n a l o f h y d r o g e n e n e r g y x x x ( 2 0 1 6 ) 1 e1 814
Please cite this article in press as: Shukla A, et al., Non-isothermal Multi-cell Model for pressure swing adsorption process, International
Journal of Hydrogen Energy (2016), http://dx.doi.org/10.1016/j.ijhydene.2016.11.200](https://image.slidesharecdn.com/f808ee56-db9f-4d88-a676-9cc720695a6c-170117084410/85/HydrogenPSA-14-320.jpg)
![Conclusions
Multi-cell Model for multi-component separation, especially
H2 purification, is studied. Representative calculation steps for
one finite difference time step in one of the PSA steps over a
finite difference step along the bed are presented. The simu-
lation model is validated with reported results of isothermal
and non-isothermal experimental and simulation studies.
The comparison indicates that the model does capture es-
sentials of a complex PSA process and predicts the relevant
performance parameters such as product purity and recovery
reasonably well. The computational time was less by a factor
of 60 as compared to reported rigorous models.
A five-component system for recovery of Hydrogen using
6-step, 8-step and 10-step, 3-bed PSA processes was studied. It
was mainly to study and quantify the importance of minor
steps such as pressure equalization, provided purge and in-
cubation on process performance. The impact on purity was
observed to be marginal whereas the impact on recovery is
significant.
The temperature profile for 10-step, 3-bed PSA process for
three locations in the bed gave an understanding about the
thermal effects due to adsorption/desorption. From the re-
sults, it can be seen that even in the case of physical adsorp-
tion, temperature increase/decrease in the beds is significant
and affects recovery significantly. Incorporation of non-
isothermal effects in simulation and simulation-based
design is achievable using the Multi-cell Model as process
simulation due to its minimal computational footprint as
compared to other rigorous models.
r e f e r e n c e s
[1] Xiao J, Peng Y, Benard P, Chahine R. Thermal effects on
breakthrough curves of pressure swing adsorption for
hydrogen purification. Int J Hydrogen Energy
2016;41:8236e45. http://dx.doi.org/10.1016/
j.ijhydene.2015.11.126.
[2] Cen P, Yang RT. Bulk gas separation by pressure swing
adsorption. Ind Eng Chem Fundam 1986;25:758e67. http://
dx.doi.org/10.1021/i100024a047.
[3] Xiao J, Li R, Benard P, Chahine R. Heat and mass transfer
model of multicomponent adsorption system for hydrogen
purification. Int J Hydrogen Energy 2015;40:4794e803. http://
dx.doi.org/10.1016/j.ijhydene.2015.02.042.
[4] You YW, Lee DG, Yoon KY, Moon DK, Kim SM, Lee CH. H2 PSA
purifier for CO removal from hydrogen mixtures. Int J
Hydrogen Energy 2012;37:18175e86. http://dx.doi.org/
10.1016/j.ijhydene.2012.09.044.
[5] Papadias DD, Ahmed S, Kumar R, Joseck F. Hydrogen quality
for fuel-cell vehicles-A modeling study of the sensitivity of
impurity content in hydrogen to the process variables in the
SMR-PSA pathway. Int J Hydrogen Energy 2009;34:6021e35.
http://dx.doi.org/10.1016/j.ijhydene.2009.06.026.
[6] Ruthven DM, Farooq S. Air separation by pressure swing
adsorption. Gas Sep Purif 1990;4:141e8. http://dx.doi.org/
10.1016/0950-4214(90)80016-E.
[7] Doong SJ, Yang RT. Bulk separation of multicomponent gas
mixtures by pressure swing adsorption: Pore/surface
diffusion and equilibrium models. AIChE J 1986;32:397e410.
http://dx.doi.org/10.1002/aic.690320306.
[8] Yang J, Lee C. Adsorption dynamics of a layered bed PSA for
H2 recovery from coke oven gas. AIChE J 1998;44:1325e34.
http://dx.doi.org/10.1016/S0140-6701(99)97697-X.
[9] Banu A, Friedrich D, Brandani S, Du T. A multiscale study of
MOFs as Adsorbents in H2 PSA purification. Ind Eng Chem
Res 2013;52:9946e57. http://dx.doi.org/10.1021/ie4011035.
[10] Caldwett SJ, Duri BA, Sun N, Sun CG, Snape CE, Li K, et al.
Carbon di-oxide separation from nitrogen hydrogen
mixtures over activated carbon beads: adsorption isotherms
and breakthrough studies. Energy Fuels 2015;29:3796e807.
http://dx.doi.org/10.1021/acs.energyfuels.5b00164.
[11] Lopes FVS, Grande CA, Rodrigues AE. Activated carbon for
hydrogen purification by pressure swing adsorption:
Multicomponent breakthrough curves and {PSA}
performance. Chem Eng Sci 2011;66:303e17. http://
dx.doi.org/10.1016/j.ces.2010.10.034.
[12] Mhaskar PR, Peter SA, Moharir AS. Generic mathematical
model for PSA process. Chem Prod Process Model 2012;7.
http://dx.doi.org/10.1515/1934-2659.1574.
[13] Sahoo S. Simulation-based design of pressure swing
adsorption process. Indian Institute of Technology Bombay;
2016.
[14] Luberti M, Friedrich D, Brandani S, Ahn H. Design of a H2 PSA
for cogeneration of ultrapure hydrogen and power at an
advanced integrated gasification combined cycle with pre-
combustion capture. Adsorption 2014;20:511e24. http://
dx.doi.org/10.1007/s10450-013-9598-0.
[15] Rajsree R, Moharir AS. Simulation based synthesis, design
and optimization of pressure swing adsorption (PSA)
processes. Comput Chem Eng 2000;24:2493e505. http://
dx.doi.org/10.1016/s0098-1354(00)00606-2.
[16] Yang J, Lee C. Separation of hydrogen mixtures by a two-bed
pressure swing adsorption process using zeolite 5A. Ind. Eng.
Chem. Res 1997;36:2789e98. http://dx.doi.org/10.1021/
ie960728h.
[17] Glueckauf E. Theory of chromatography. Part 10.-Formulae
for diffusion into spheres and their application to
chromatography. Trans Faraday Soc 1955;51:1540e51. http://
dx.doi.org/10.1039/TF9555101540.
i n t e r n a t i o n a l j o u r n a l o f h y d r o g e n e n e r g y x x x ( 2 0 1 6 ) 1 e1 818
Please cite this article in press as: Shukla A, et al., Non-isothermal Multi-cell Model for pressure swing adsorption process, International
Journal of Hydrogen Energy (2016), http://dx.doi.org/10.1016/j.ijhydene.2016.11.200](https://image.slidesharecdn.com/f808ee56-db9f-4d88-a676-9cc720695a6c-170117084410/85/HydrogenPSA-18-320.jpg)