This document summarizes a pilot plant study on capturing CO2 from power plant flue gas using a vacuum swing adsorption (VSA) process with zeolite 13X. Key findings include:
1) A basic 4-step VSA cycle was able to achieve 95.9% CO2 purity and 86.4% recovery from a 15% CO2 flue gas stream.
2) A modified 4-step cycle with light product pressurization and two beds achieved improved performance of 94.8% purity and 89.7% recovery.
3) Energy consumption in the pilot plant was 339-583 kWh/tonne of CO2 captured, higher than theoretical calculations due to non


![were the same. The pressurization time in the basic four-step
VSA process was kept fixed at 20 s. However, in case of
LPP, longer duration (40 s) was needed to pressurize the bed
with the product from the high pressure adsorption step in
the other bed. Longer pressurization time did not have any
impact of the performance of the basic four-step cycle.
Hence, the difference in pressurization times of the two
cycles was not consequential. It is clear that the CO2 losses
in Run 6 were much lower compared to those in Run 1, thus
confirming the recovery benefit of the LPP cycle. However,
the CO2 concentration in the evacuation step was lower in
Run 6 compared to Run 1, as shown in Figure 10c. By low-
ering the blowdown pressure, the loss in CO2 purity was
more than compensated which is also seen from Figure 10c.
The actual purity-recovery values from the LPP cycle are
compared with those from the basic four-step cycle in Figure
11. As seen from the figure, under similar conditions of
PI 5 0.07 bar, the LPP experiment had a much higher recov-
ery (93.3 6 5.6% versus 85.4 6 5.6%) but a lower purity
(92.9 6 1% versus 94.7 6 1%). This is due to the contamina-
tion of the CO2 product by the nitrogen, which was used to
pressurize the bed. The loss in purity was recovered by
slightly lowering the blowdown pressure to 0.056 bar to
remove sufficient amount of nitrogen. The recovery of CO2
reduced slightly but was still higher than the CO2 recovery
obtained from the basic four-step. Further reduction in the
blowdown pressure to 0.043 bar improved the purity to
96.3 6 1%, while the recovery was 86.5 6 5.6%.
Figure 10. CO2 concentration profiles in (a) adsorption step (b) blowdown step, and (c) evacuation step in basic
four-step VSA Run 1 and LPP Runs 6 and 7.
Ads, Bd, and Evac represent adsorption, blowdown, and evacuation steps, respectively. The symbols have the same meanings in
all three parts of the figure.
Figure 11. Demonstration of improvement in purity and
recovery by incorporating a LPP step.
[Color figure can be viewed in the online issue, which
is available at wileyonlinelibrary.com.]
Figure 12. Comparison of experimentally achieved
purity and recovery in this study with other
pilot plant data reported in the literature.
The error bars are shown only for purity and recov-
ery values from our pilot plant runs.
[Color figure can be viewed in the online issue, which
is available at wileyonlinelibrary.com.]
AIChE Journal May 2014 Vol. 60, No. 5 Published on behalf of the AIChE DOI 10.1002/aic 1839](https://image.slidesharecdn.com/2014krishnamurthyaichejpilotplant-220315163553/85/2014-krishnamurthy-ai_ch_ej_pilotplant-11-320.jpg)
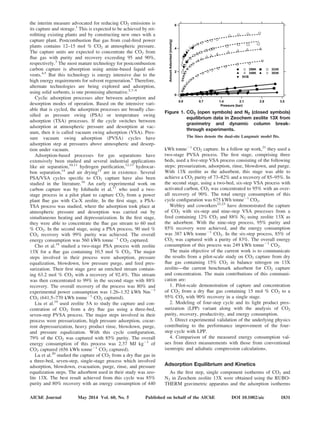
![The purity-recovery values obtained from the pilot plant
experiments are compared with the values reported in the lit-
erature17–22
in Figure 12. Clearly, our pilot plant was able to
achieve 94.8 6 1% purity and 89.7 6 5.6% recovery in a sin-
gle stage. These are very close to the 95% purity and 90%
recovery requirements specified by the US Department of
Energy.
In the present study, the productivity values for all pilot
plant runs were in the range 0.87–1.4 6 0.07 tonnes CO2
m23
adsorbent day21
. The mean and standard deviation val-
ues for the absolute percentage differences between the
model predictions and experimental results normalized with
respect to the former are also given in Table 2 for all the
performance indicators. The overall quantitative agreements
between the experimental and theoretical purity and recovery
were satisfactory, as suggested by the low values of mean
and standard deviation. These values were relatively higher
for productivity indicating modest agreements between
experimental values and model predictions. The deviations
for energy consumption were exceptionally large, which is
discussed next.
Energy consumption in a cyclic VSA process
As the high pressure steps were operated around atmos-
pheric pressure, the energy consumption in our pilot plant
VSA experiments came from the blowdown and the evacua-
tion steps. The power consumed by the vacuum pumps in
these two steps was measured directly with power meters.
The readings from the power meters are plotted along with
the flow rates in Figure 13. The initial rise in the power
meter readings corresponds to the time when the vacuum
pump was turned on (position A). There was some degree of
overshoot, which settled over the next couple of seconds till
the solenoid valves were turned on, indicated by position B.
Once the solenoid valves were turned on, the vacuum pumps
started to receive flow and this increased in the power meter
readings. The flow rate decreased with time and this effect
was also seen in the power profiles. The solenoid valves
were closed a few seconds before the vacuum pumps. Clos-
ing of solenoid valves and vacuum pumps are indicated by
positions C and D, respectively. The readings became zero
once the vacuum pump was turned off. However, in case of
the blowdown step, the flow ceased around 126 s, beyond
which the vacuum pump was operating without receiving
any gas from the column. This would not have happened if
the variable speed pumps were used. This situation will also
not arise in a continuous process, where the vacuum pumps
will receive gas for the entire duration. Therefore, the true
power consumed in the blowdown step is the area under the
curve between positions B and E shown by shaded region.
The total power consumption in a VSA process is the sum
of the power consumptions in the blowdown and evacuation
steps. The energy consumption values in the pilot plant
experiments were in the range of 339–583 6 36.7 kWh
tonne21
of CO2 captured. The power consumptions obtained
from direct measurements are compared with the results
obtained from conventional isentropic calculations in Figure
14. The commonly used efficiency in most published carbon
capture studies based only on process simulation is 72%.29,30
It can be seen that, with 72% efficiency, the theoretical
power consumptions were considerably lower than the direct
measurements from the experiments and a lower efficiency
Figure 13. Power and flow rate measurements in (a)
blowdown and (b) evacuation steps.
A: vacuum pump on, B: solenoid valve on, C: solenoid
valve off, D: vacuum pump off E: zero flow.
Figure 14. Comparison of Energy consumption values
from our pilot plant experiments with other
data in literature.
The dotted line denotes an efficiency of 72% while the
solid line denotes an efficiency of 30%. Note that all
the experiments, both from this work and from the lit-
erature, resulted in different purity-recovery values,
and care should be taken in comparing their energy
consumptions. [Color figure can be viewed in the
online issue, which is available at wileyonlinelibrary.
com.]
1840 DOI 10.1002/aic Published on behalf of the AIChE May 2014 Vol. 60, No. 5 AIChE Journal](https://image.slidesharecdn.com/2014krishnamurthyaichejpilotplant-220315163553/85/2014-krishnamurthy-ai_ch_ej_pilotplant-12-320.jpg)