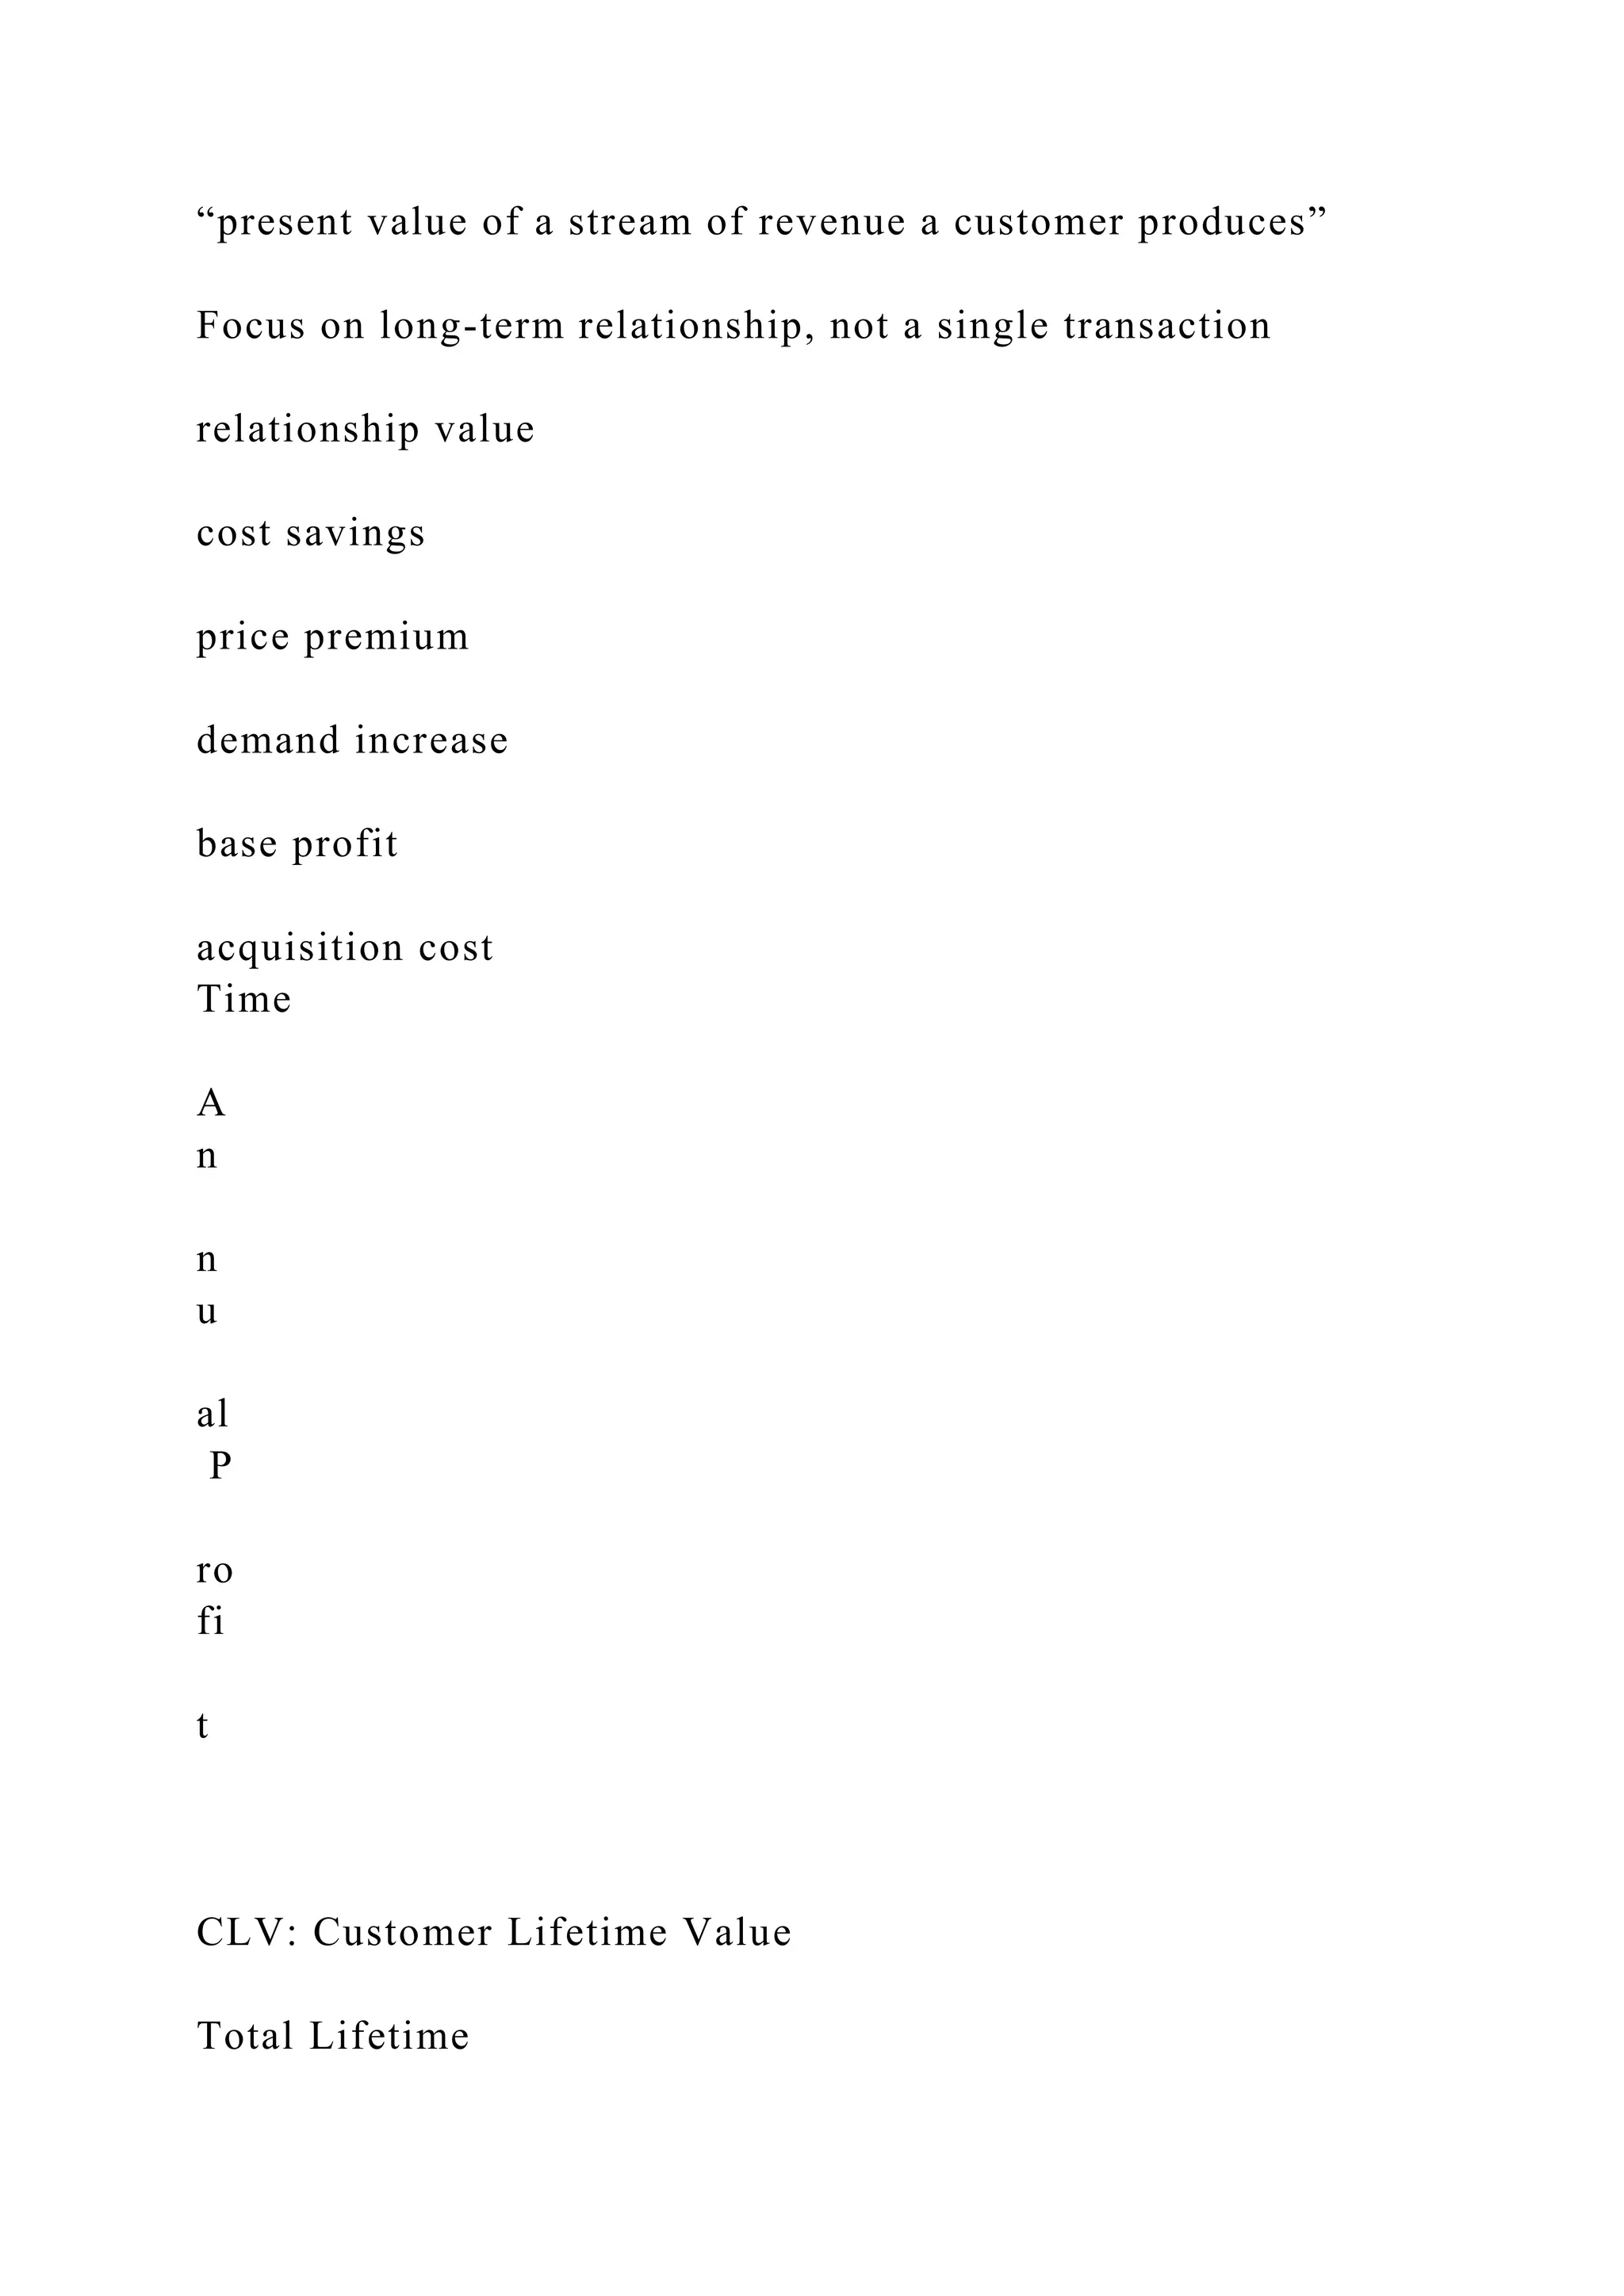
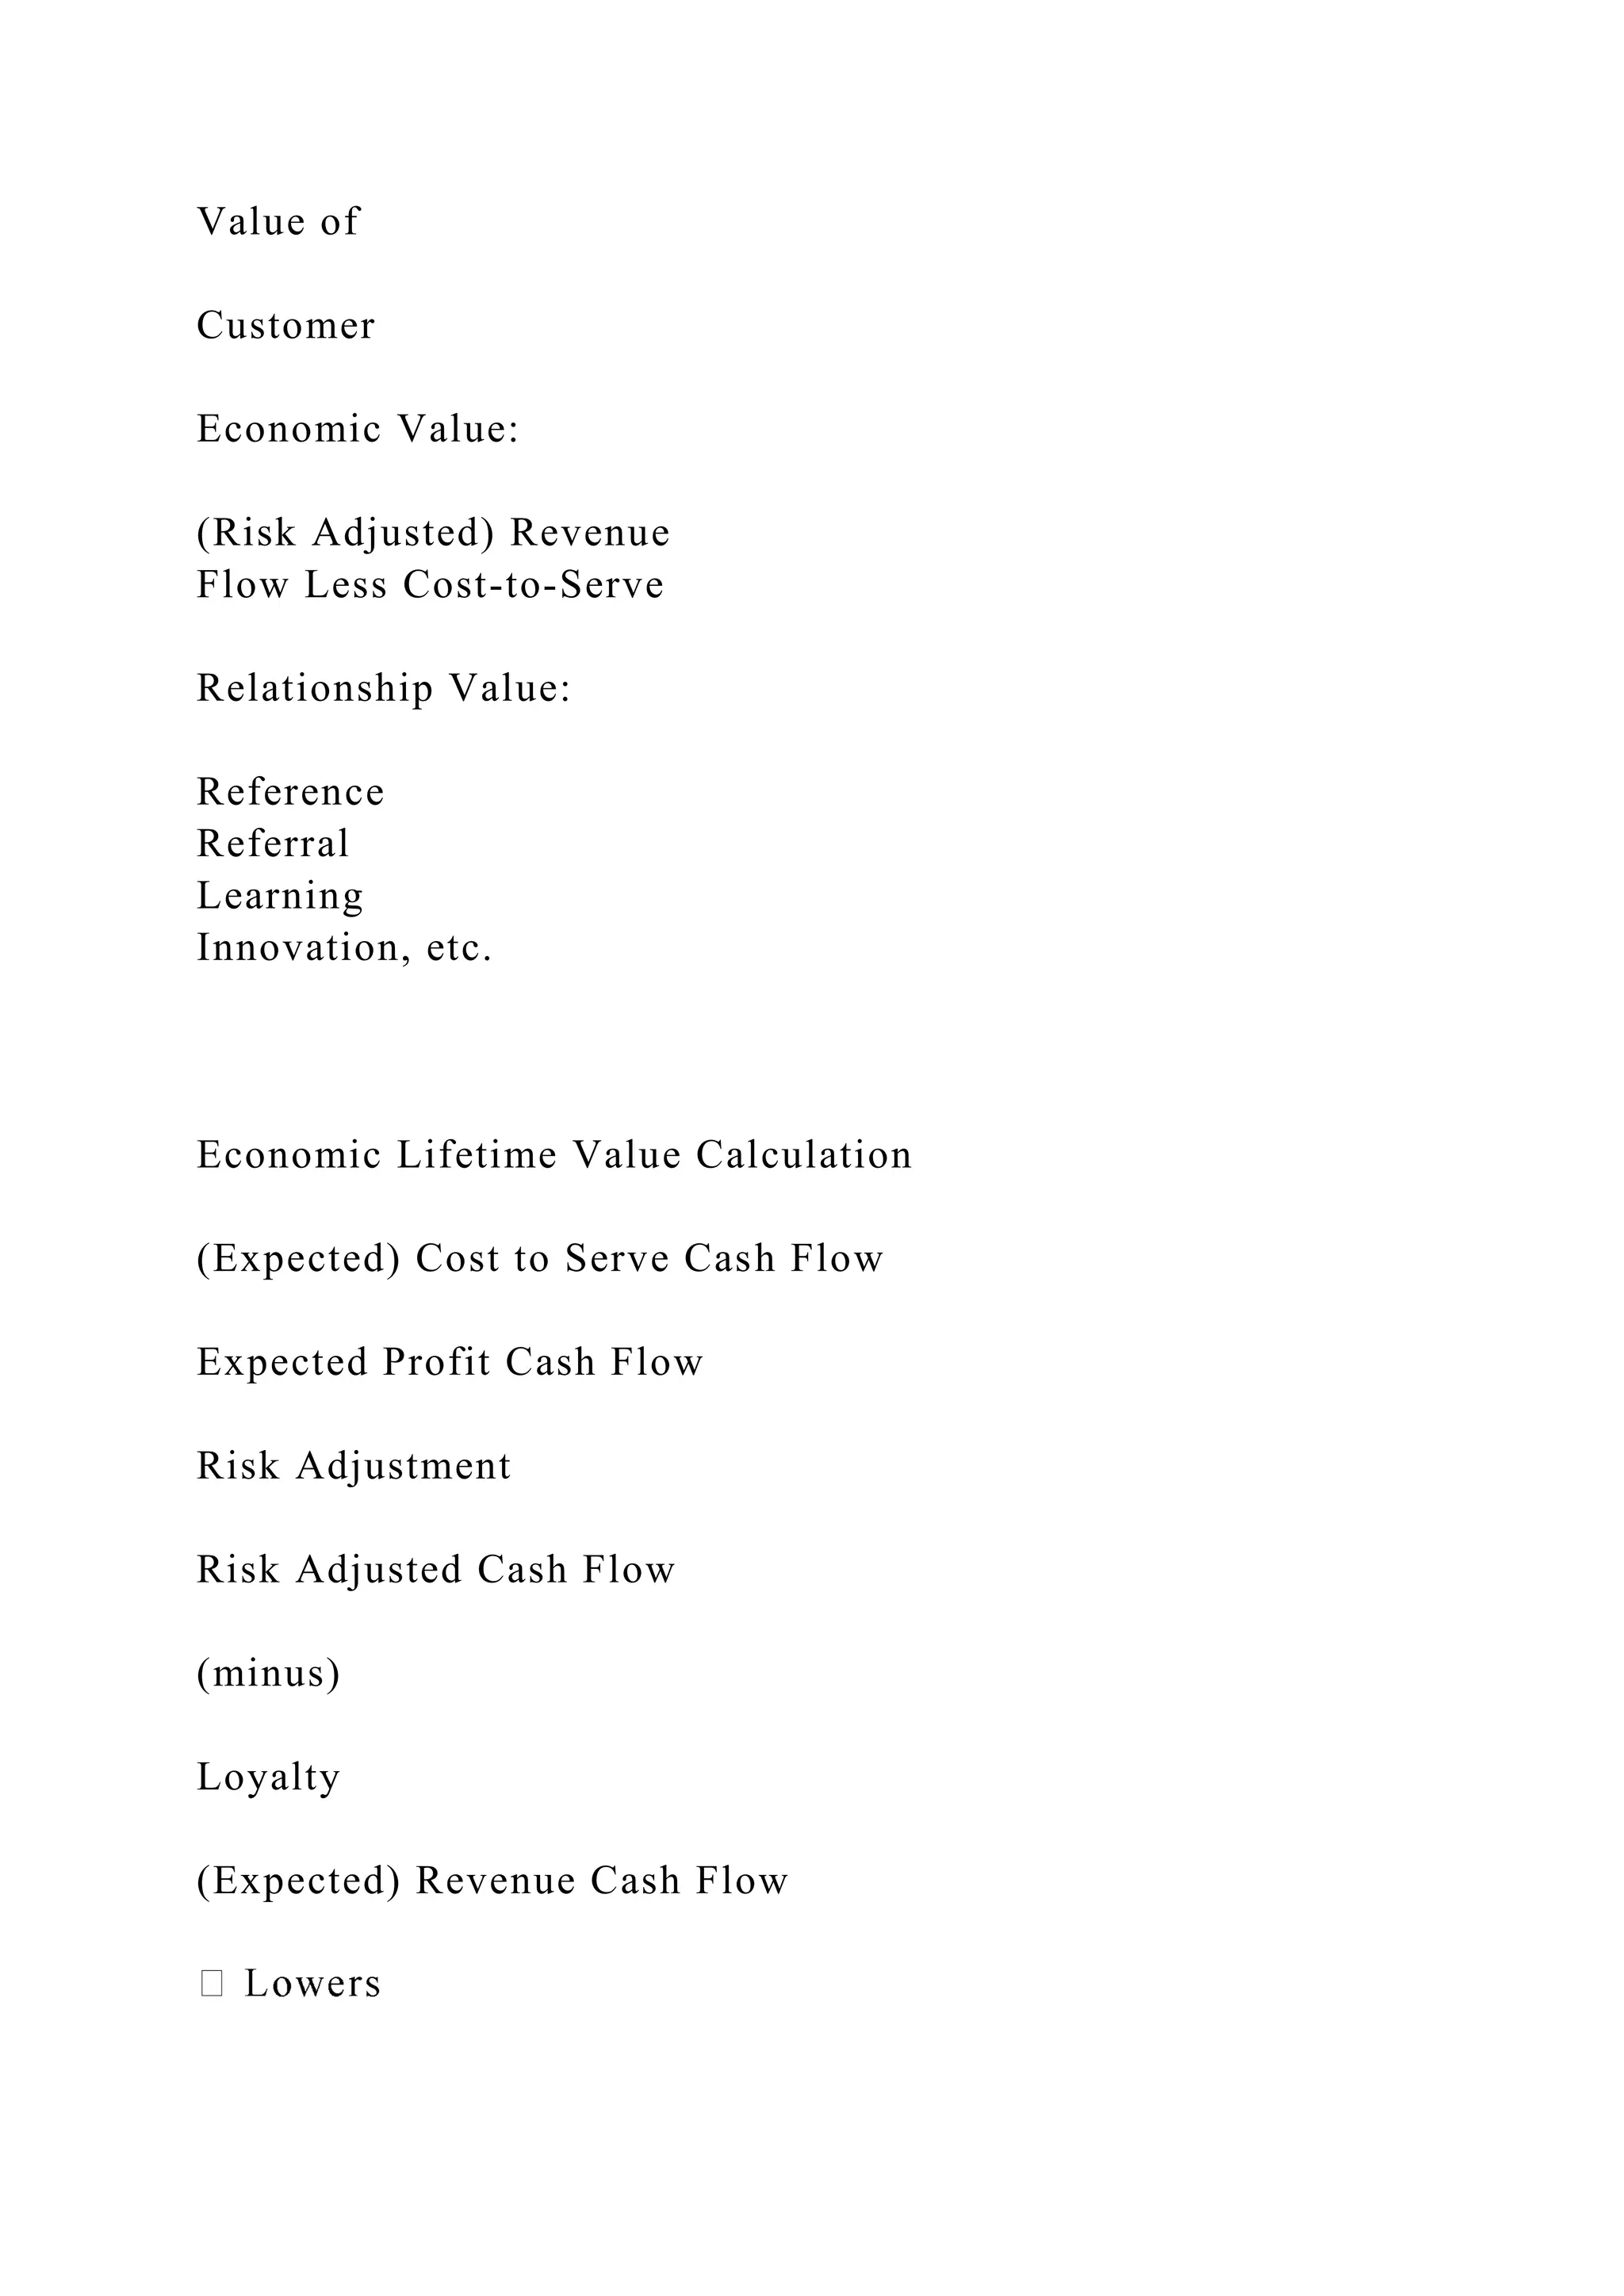
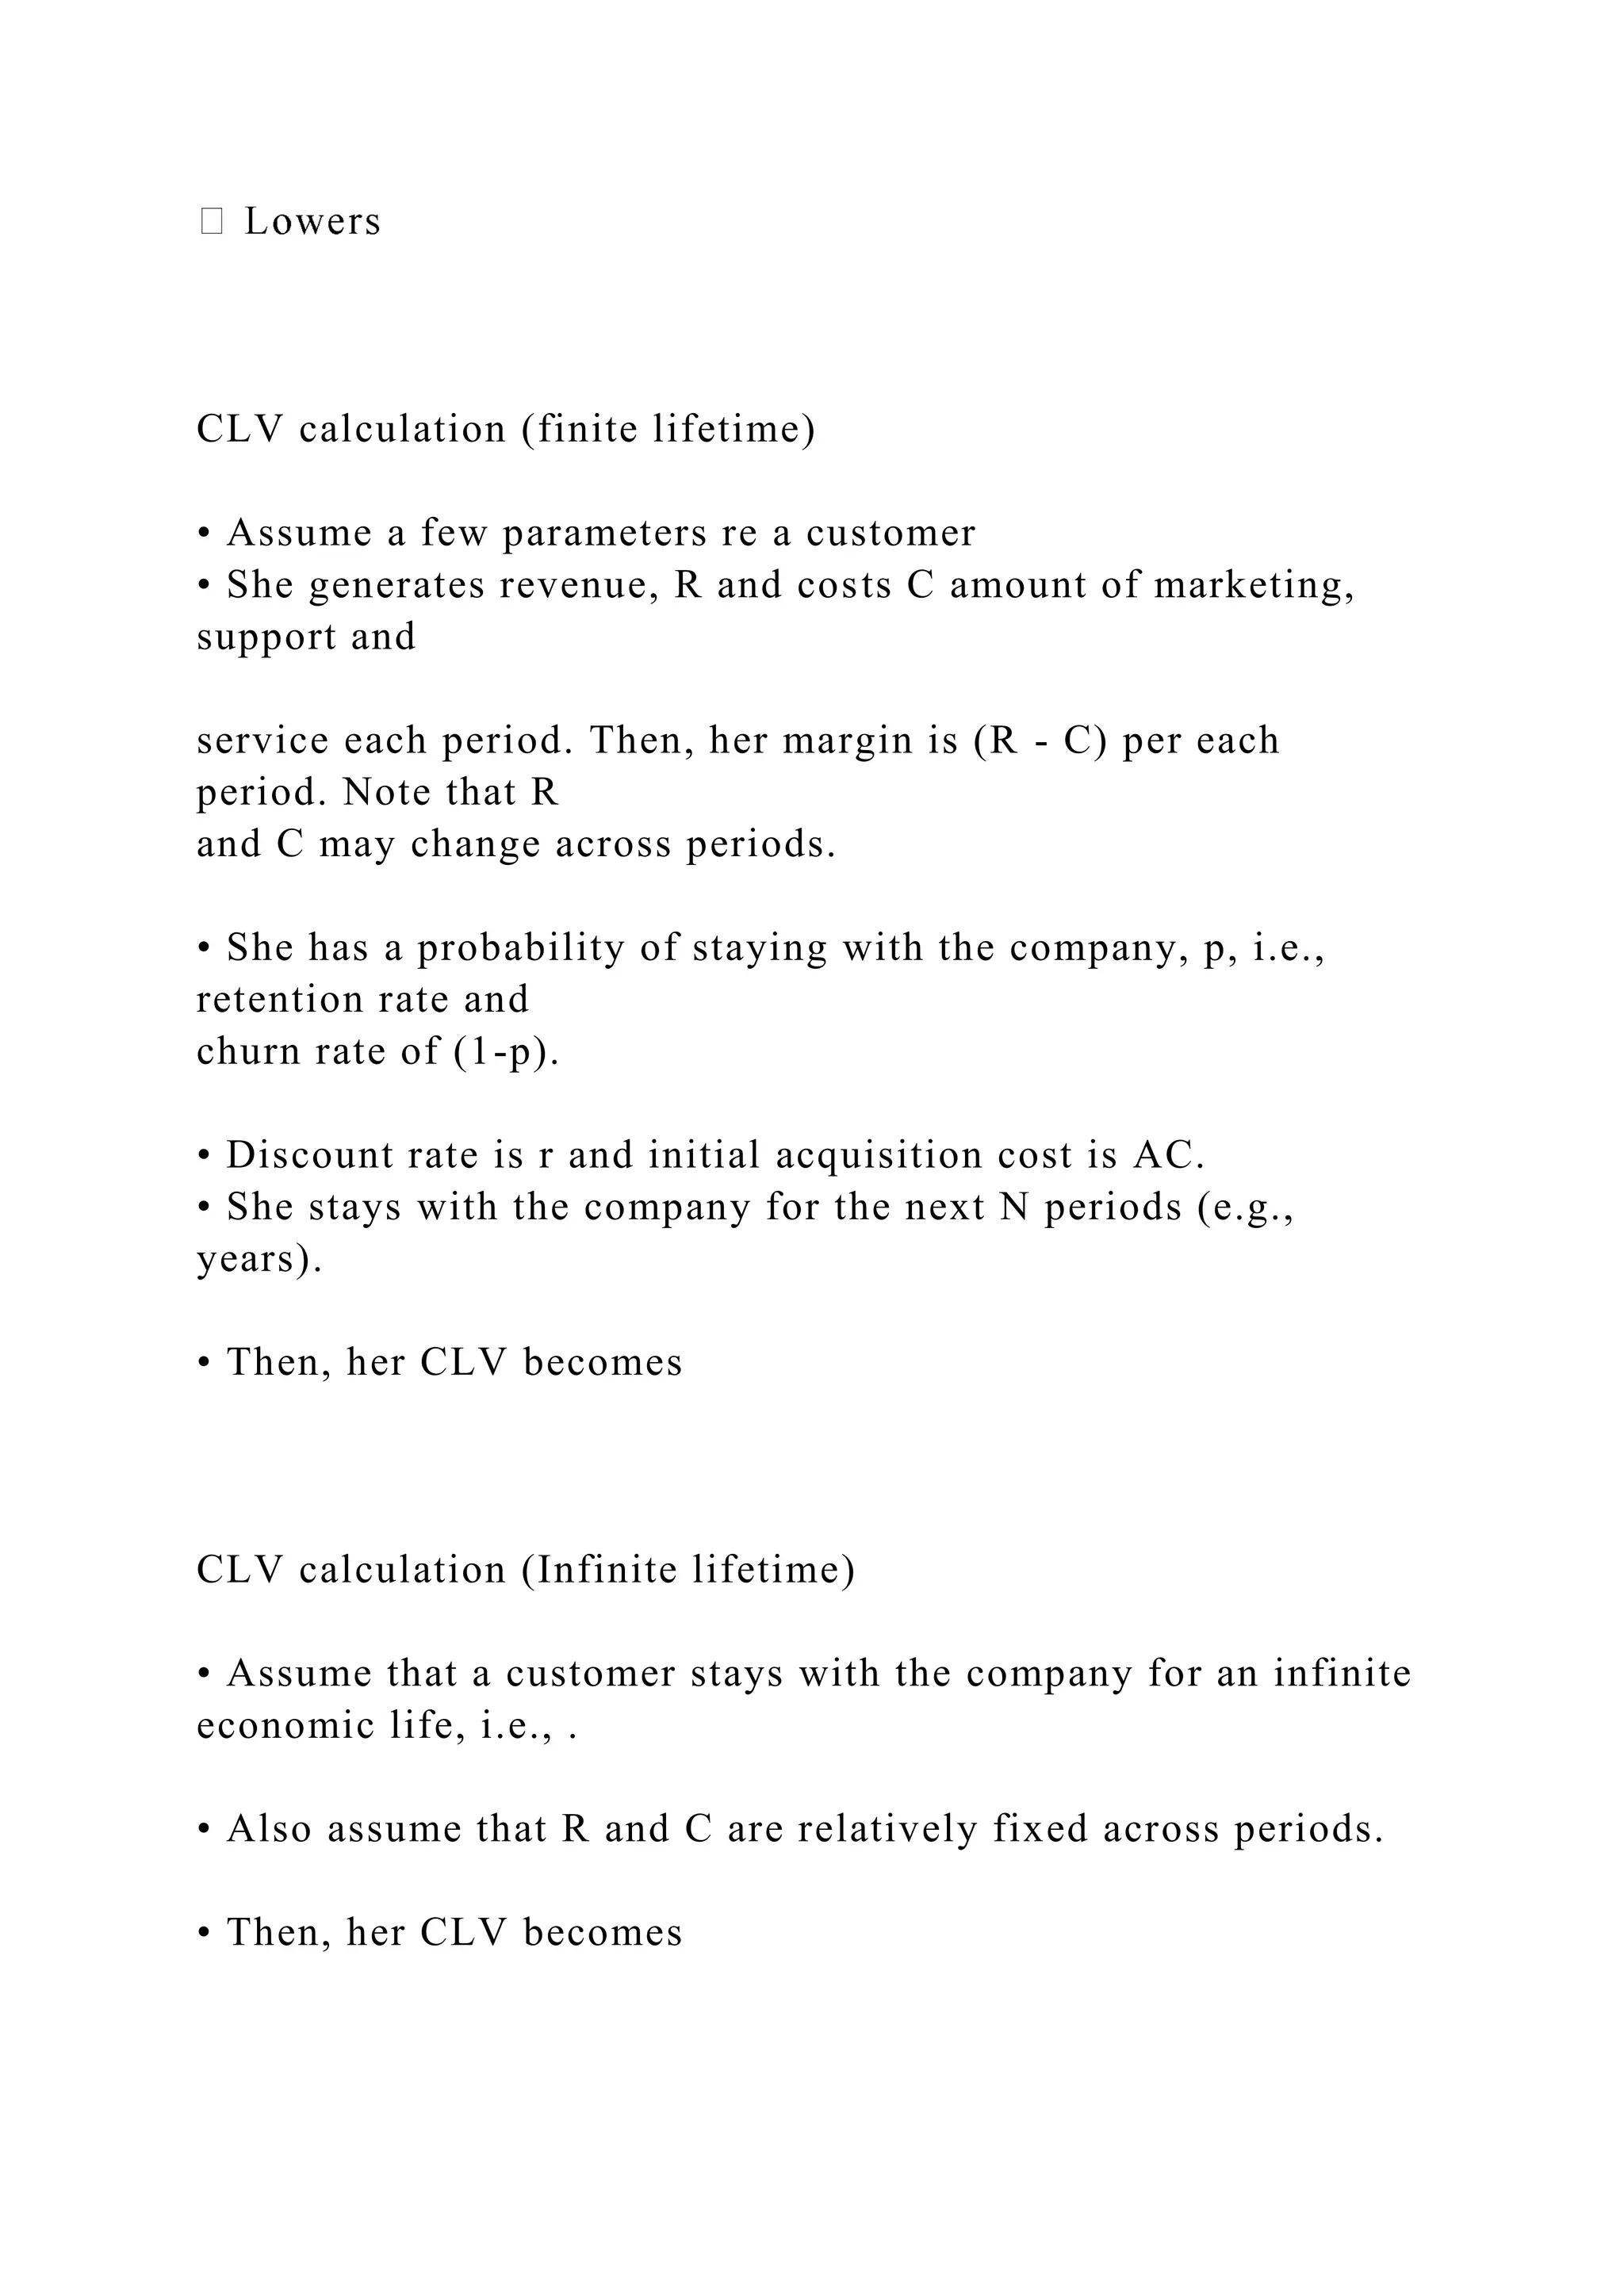
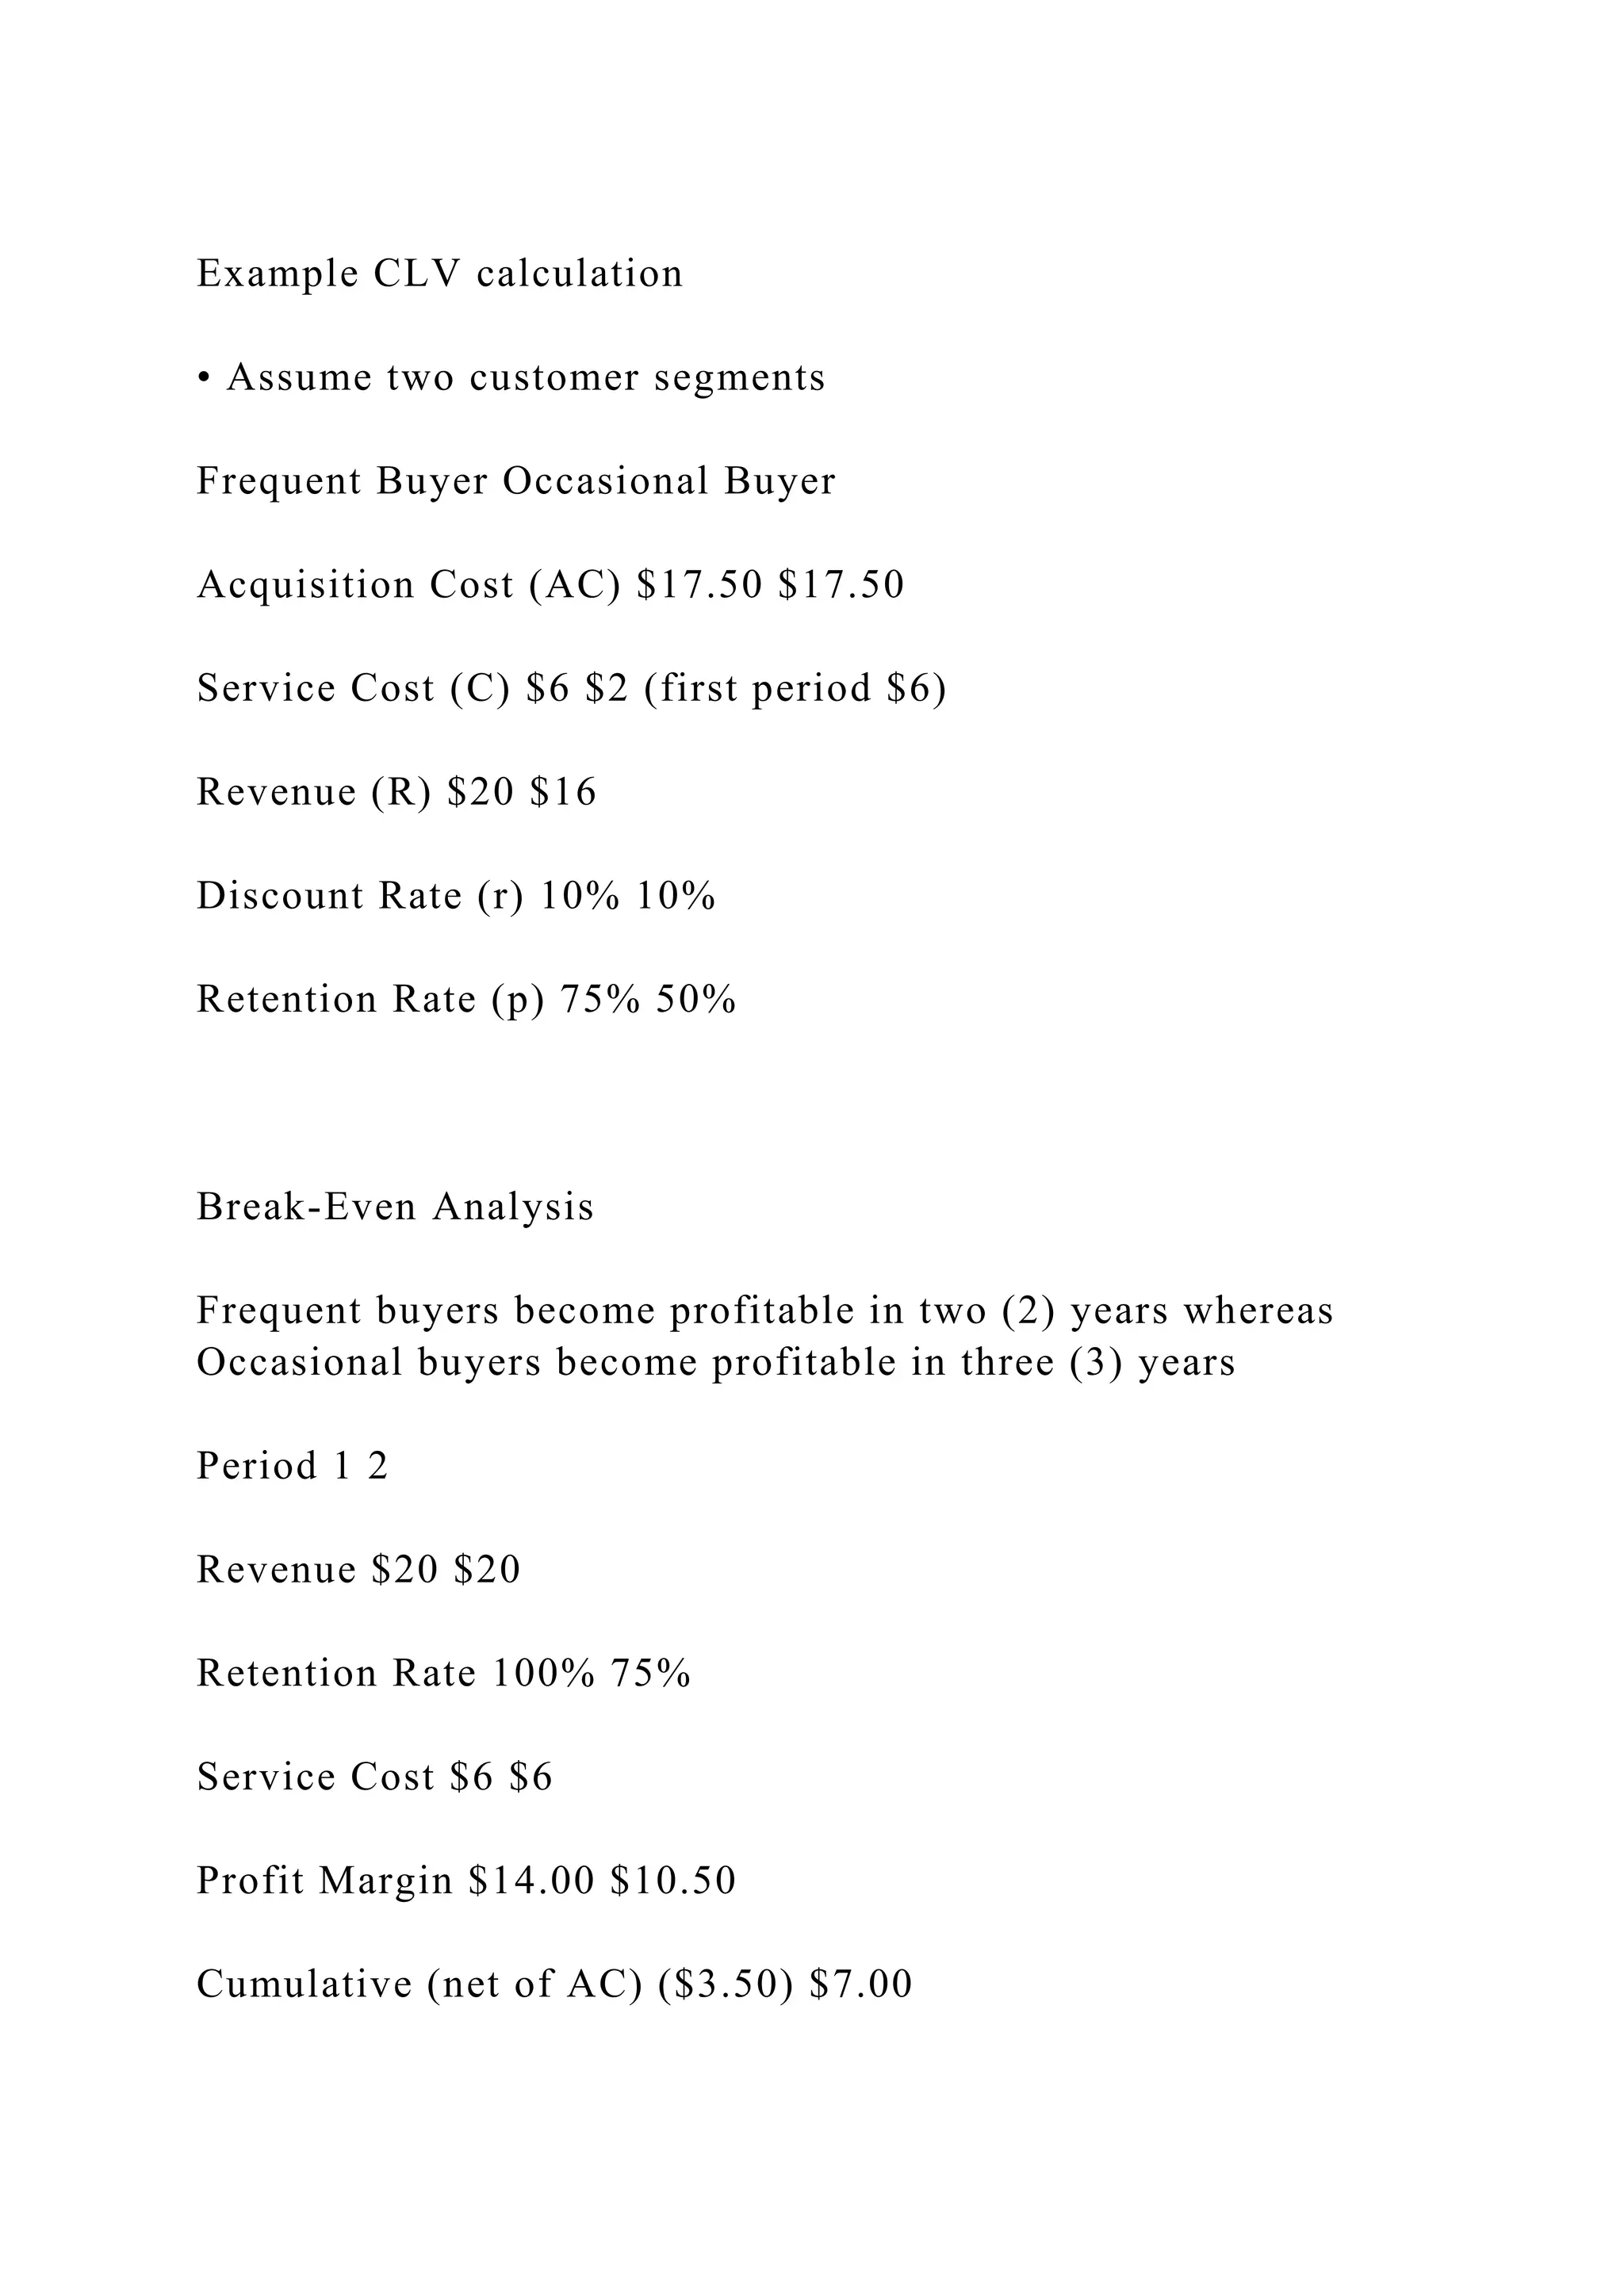
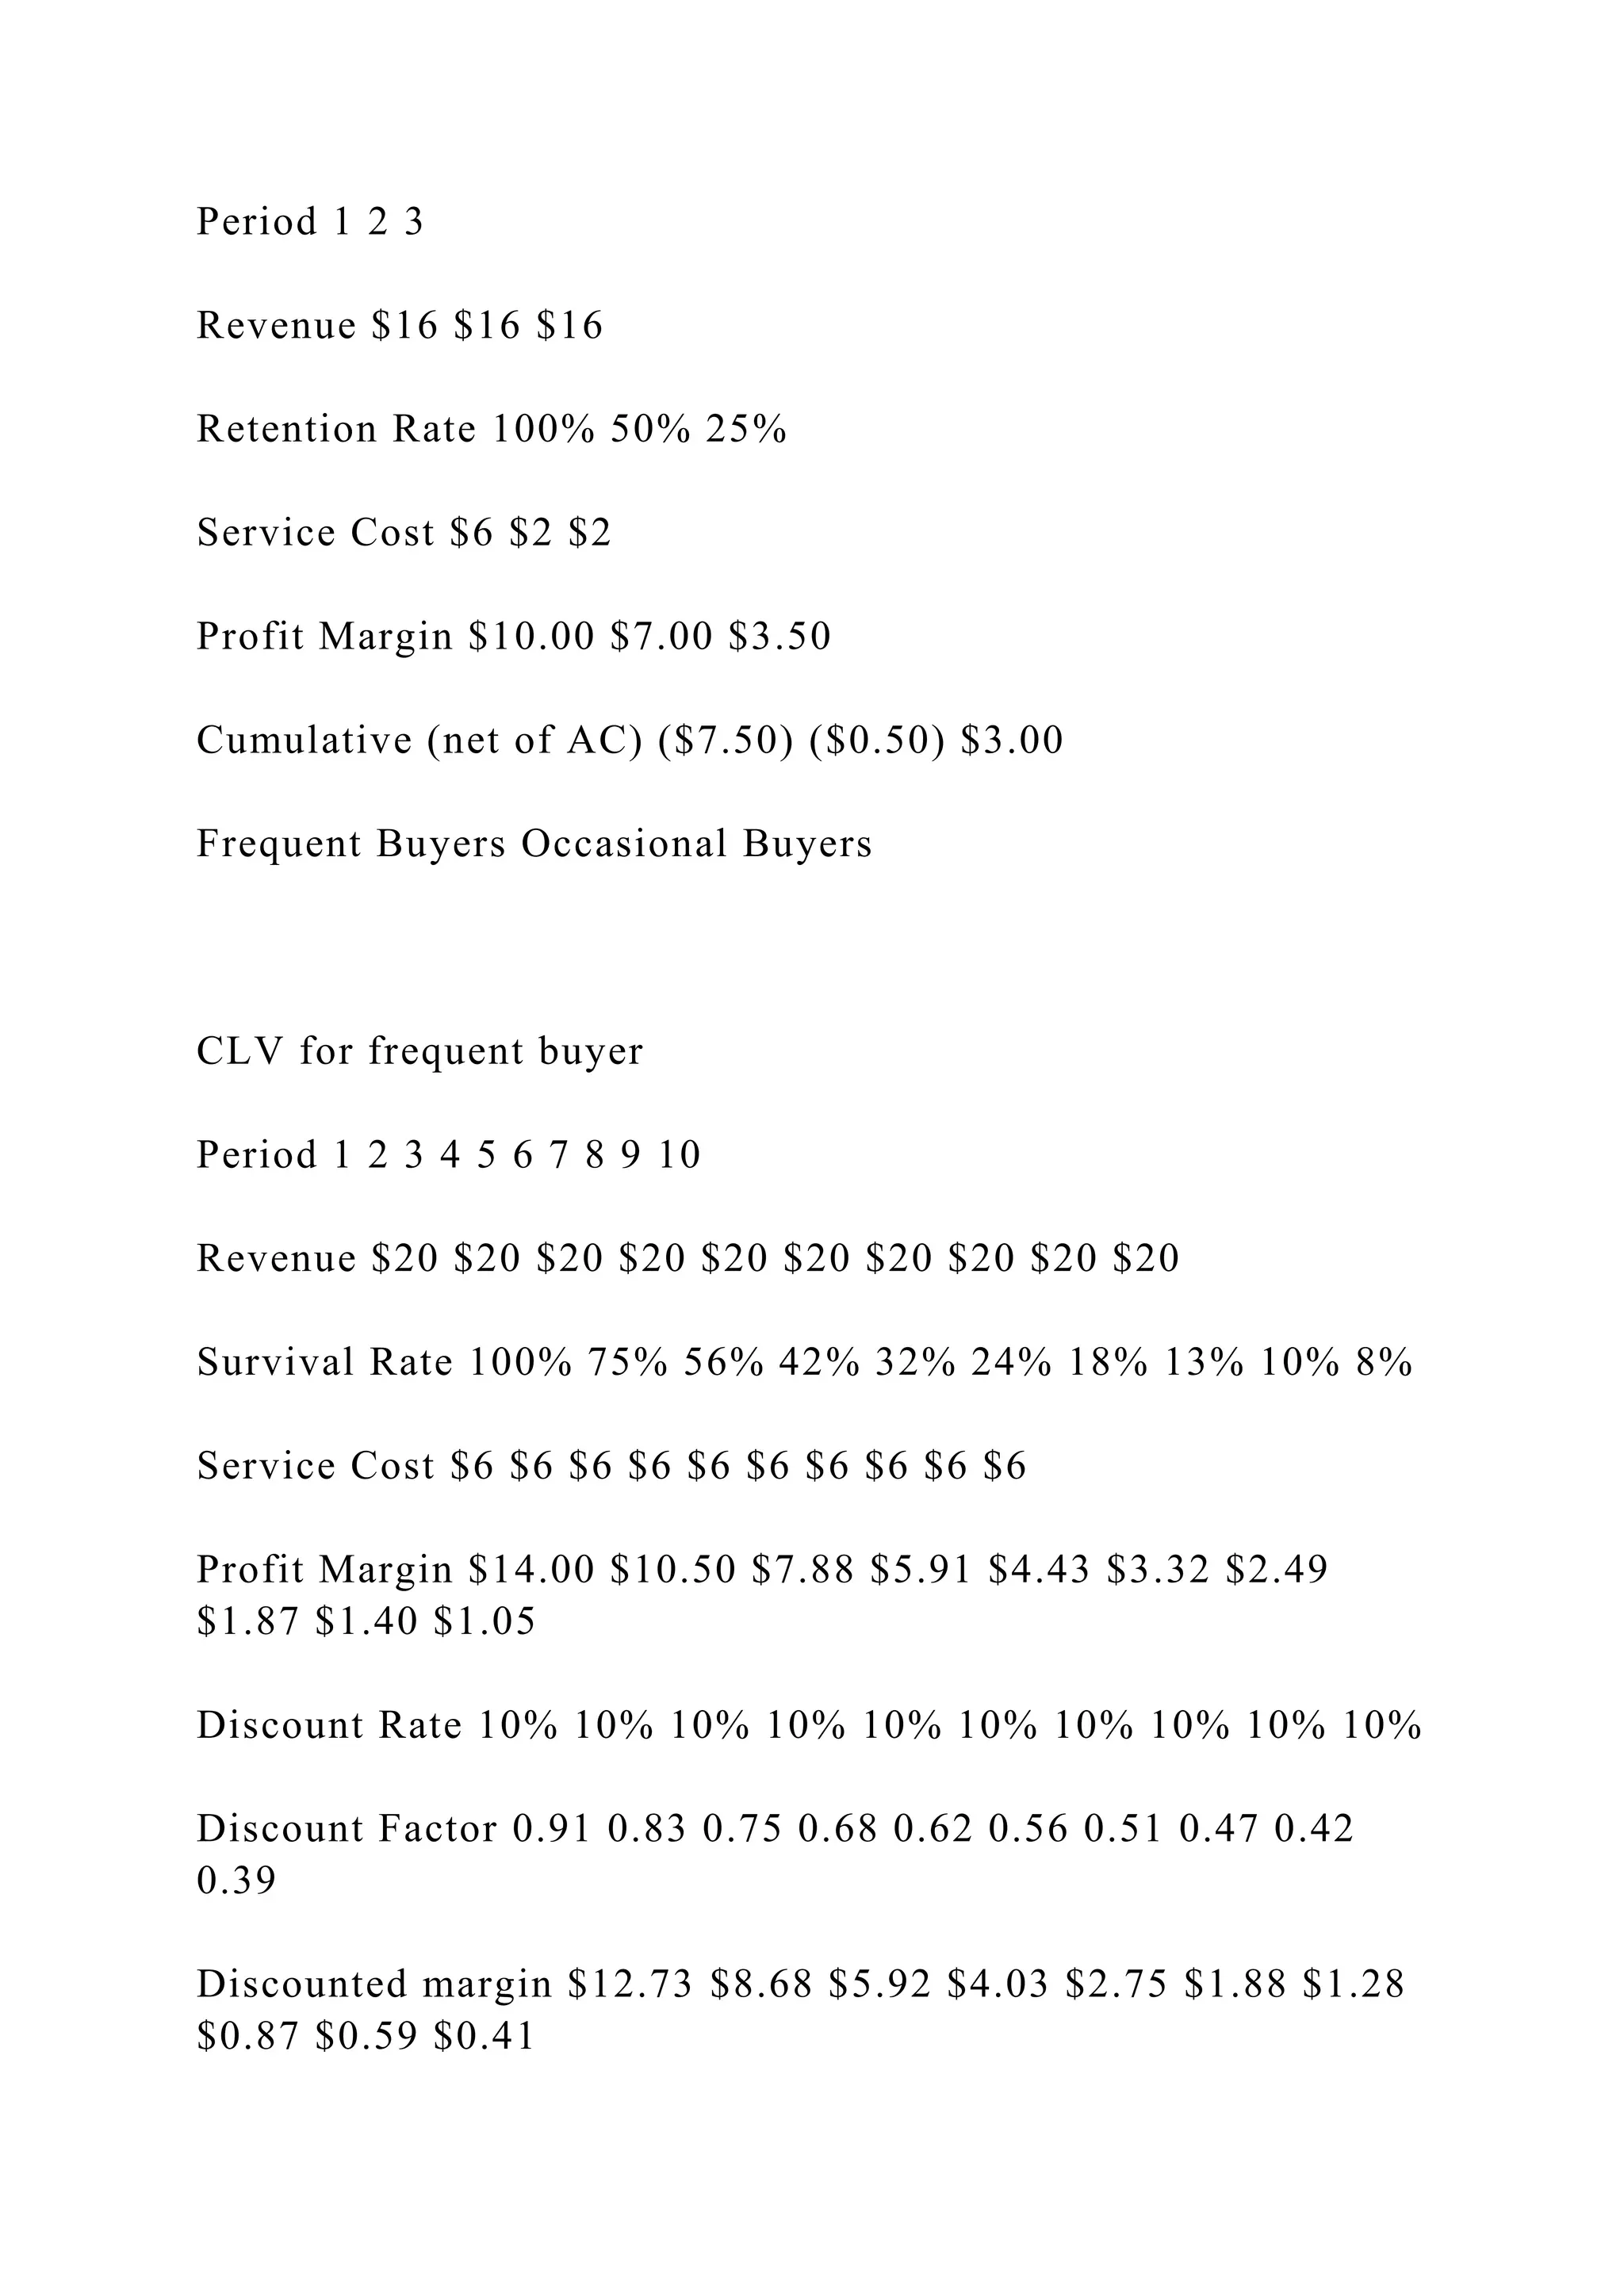
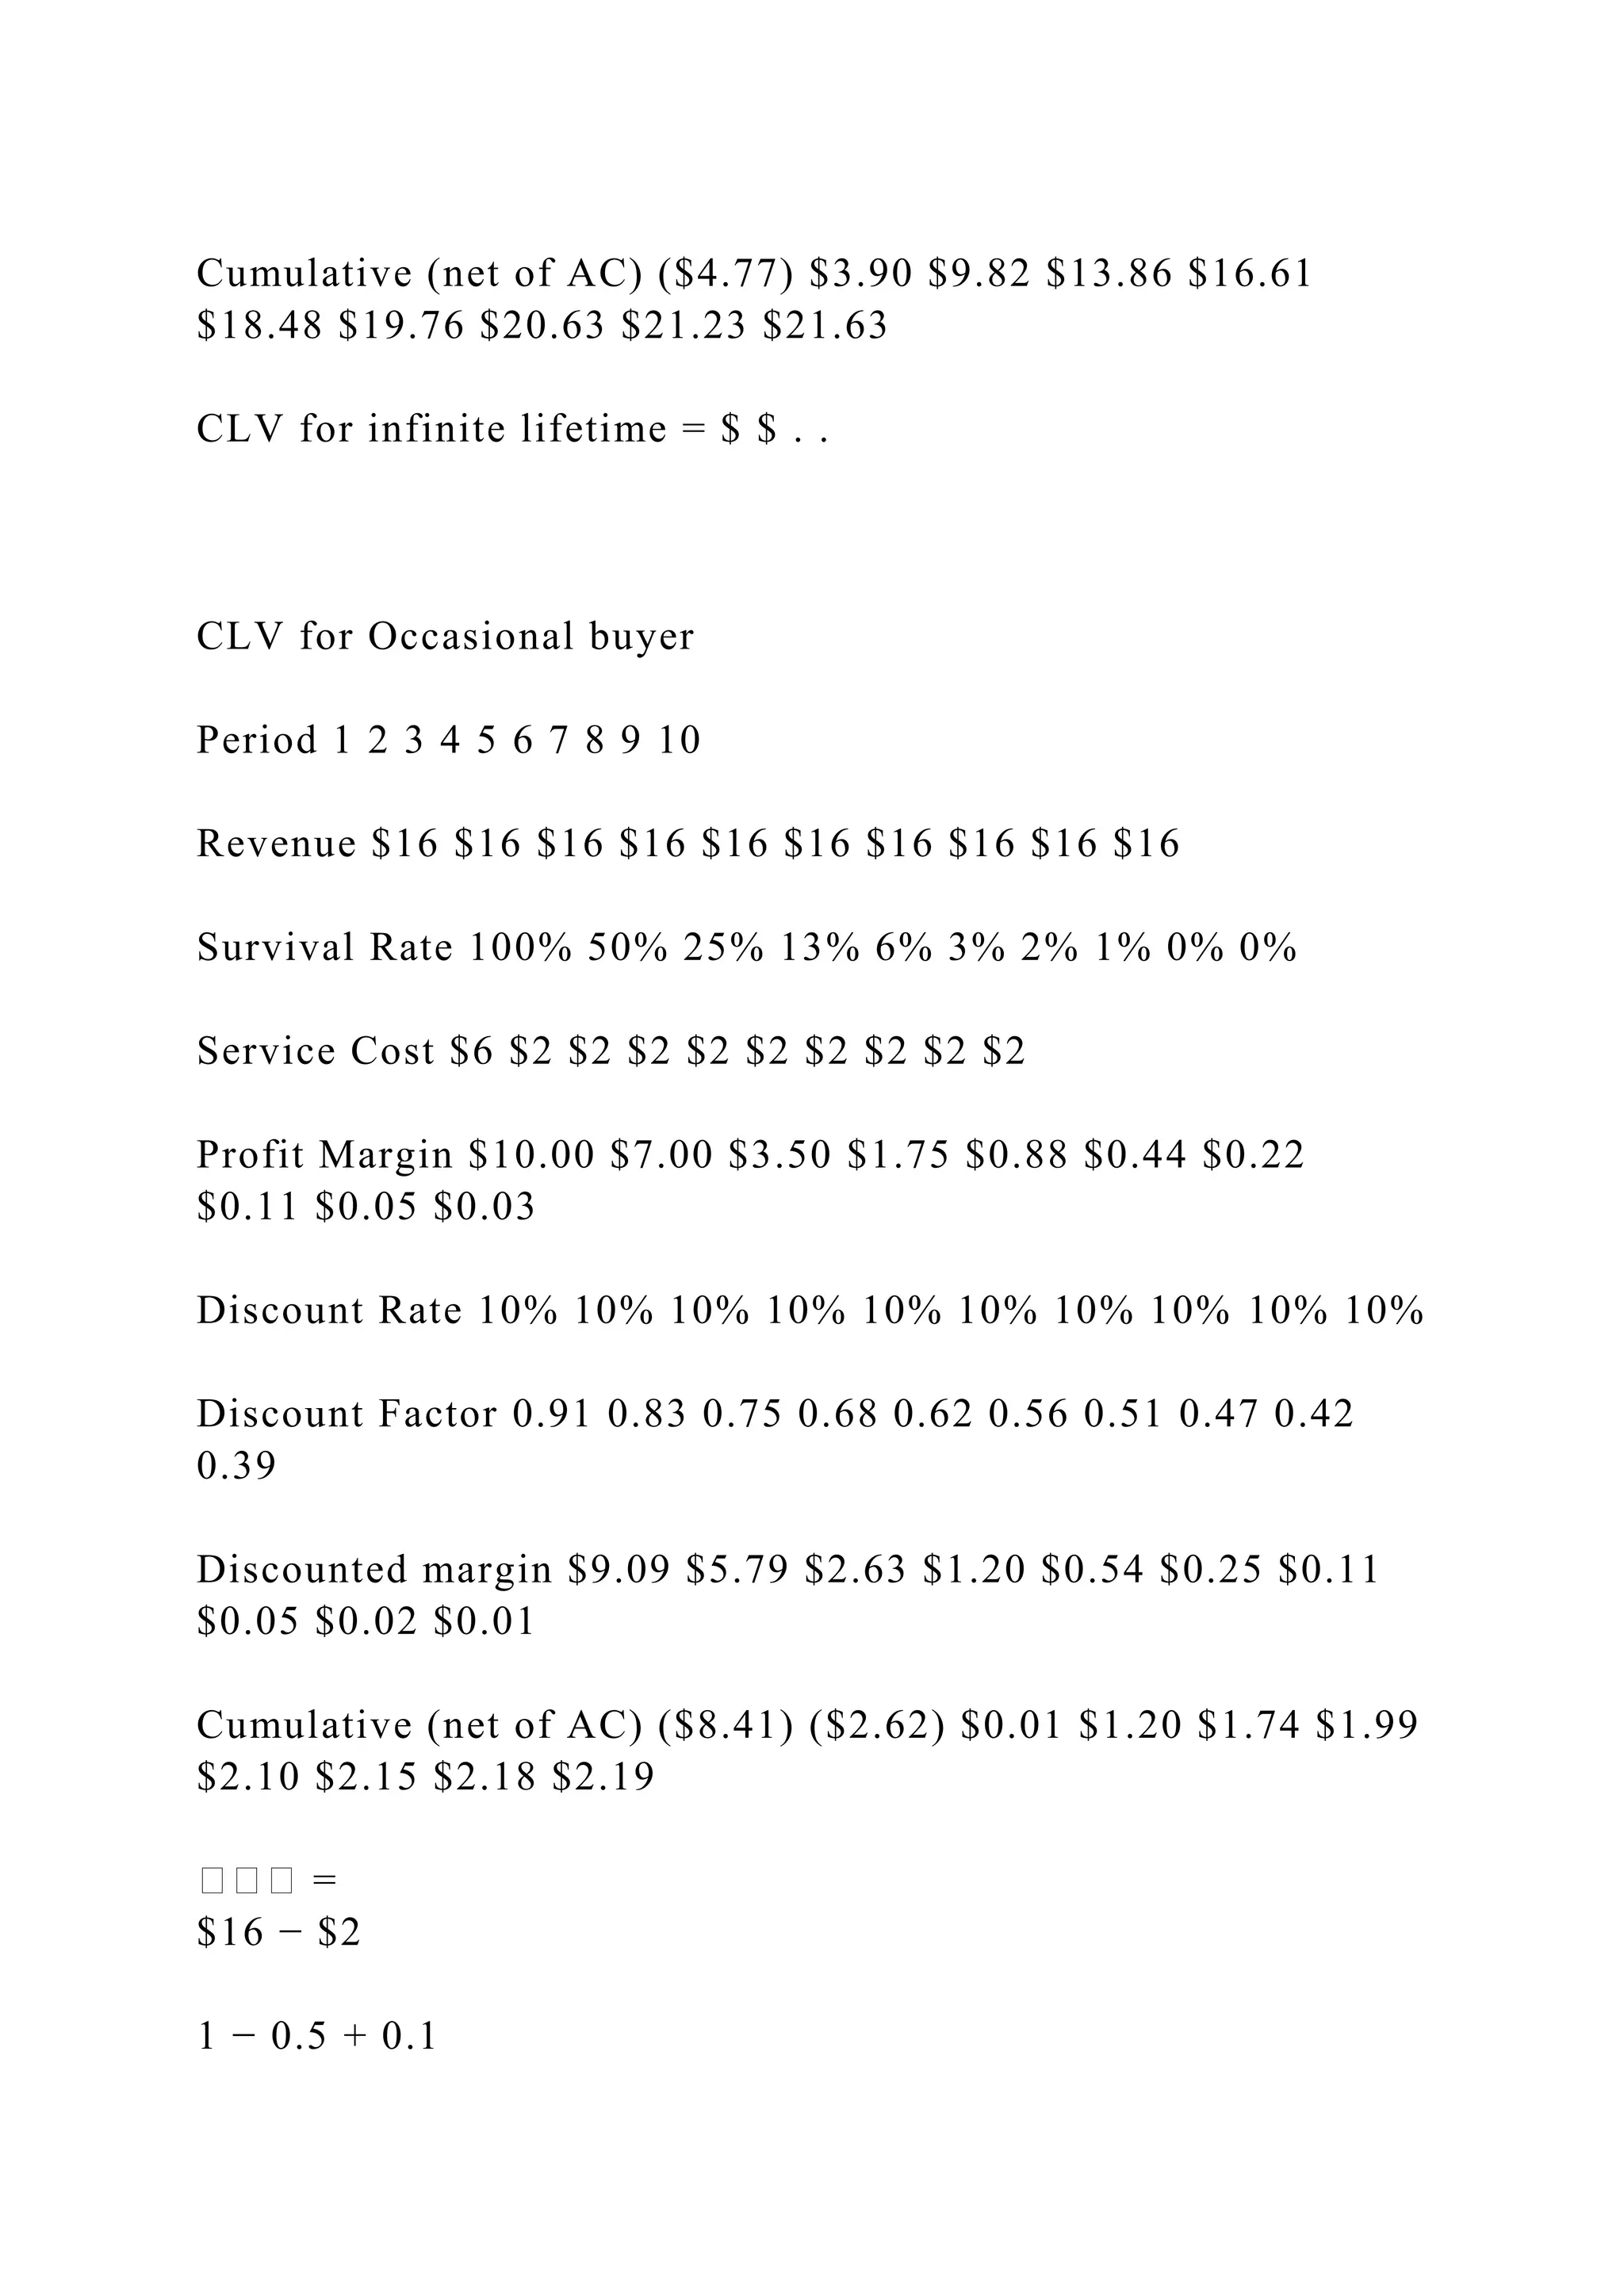
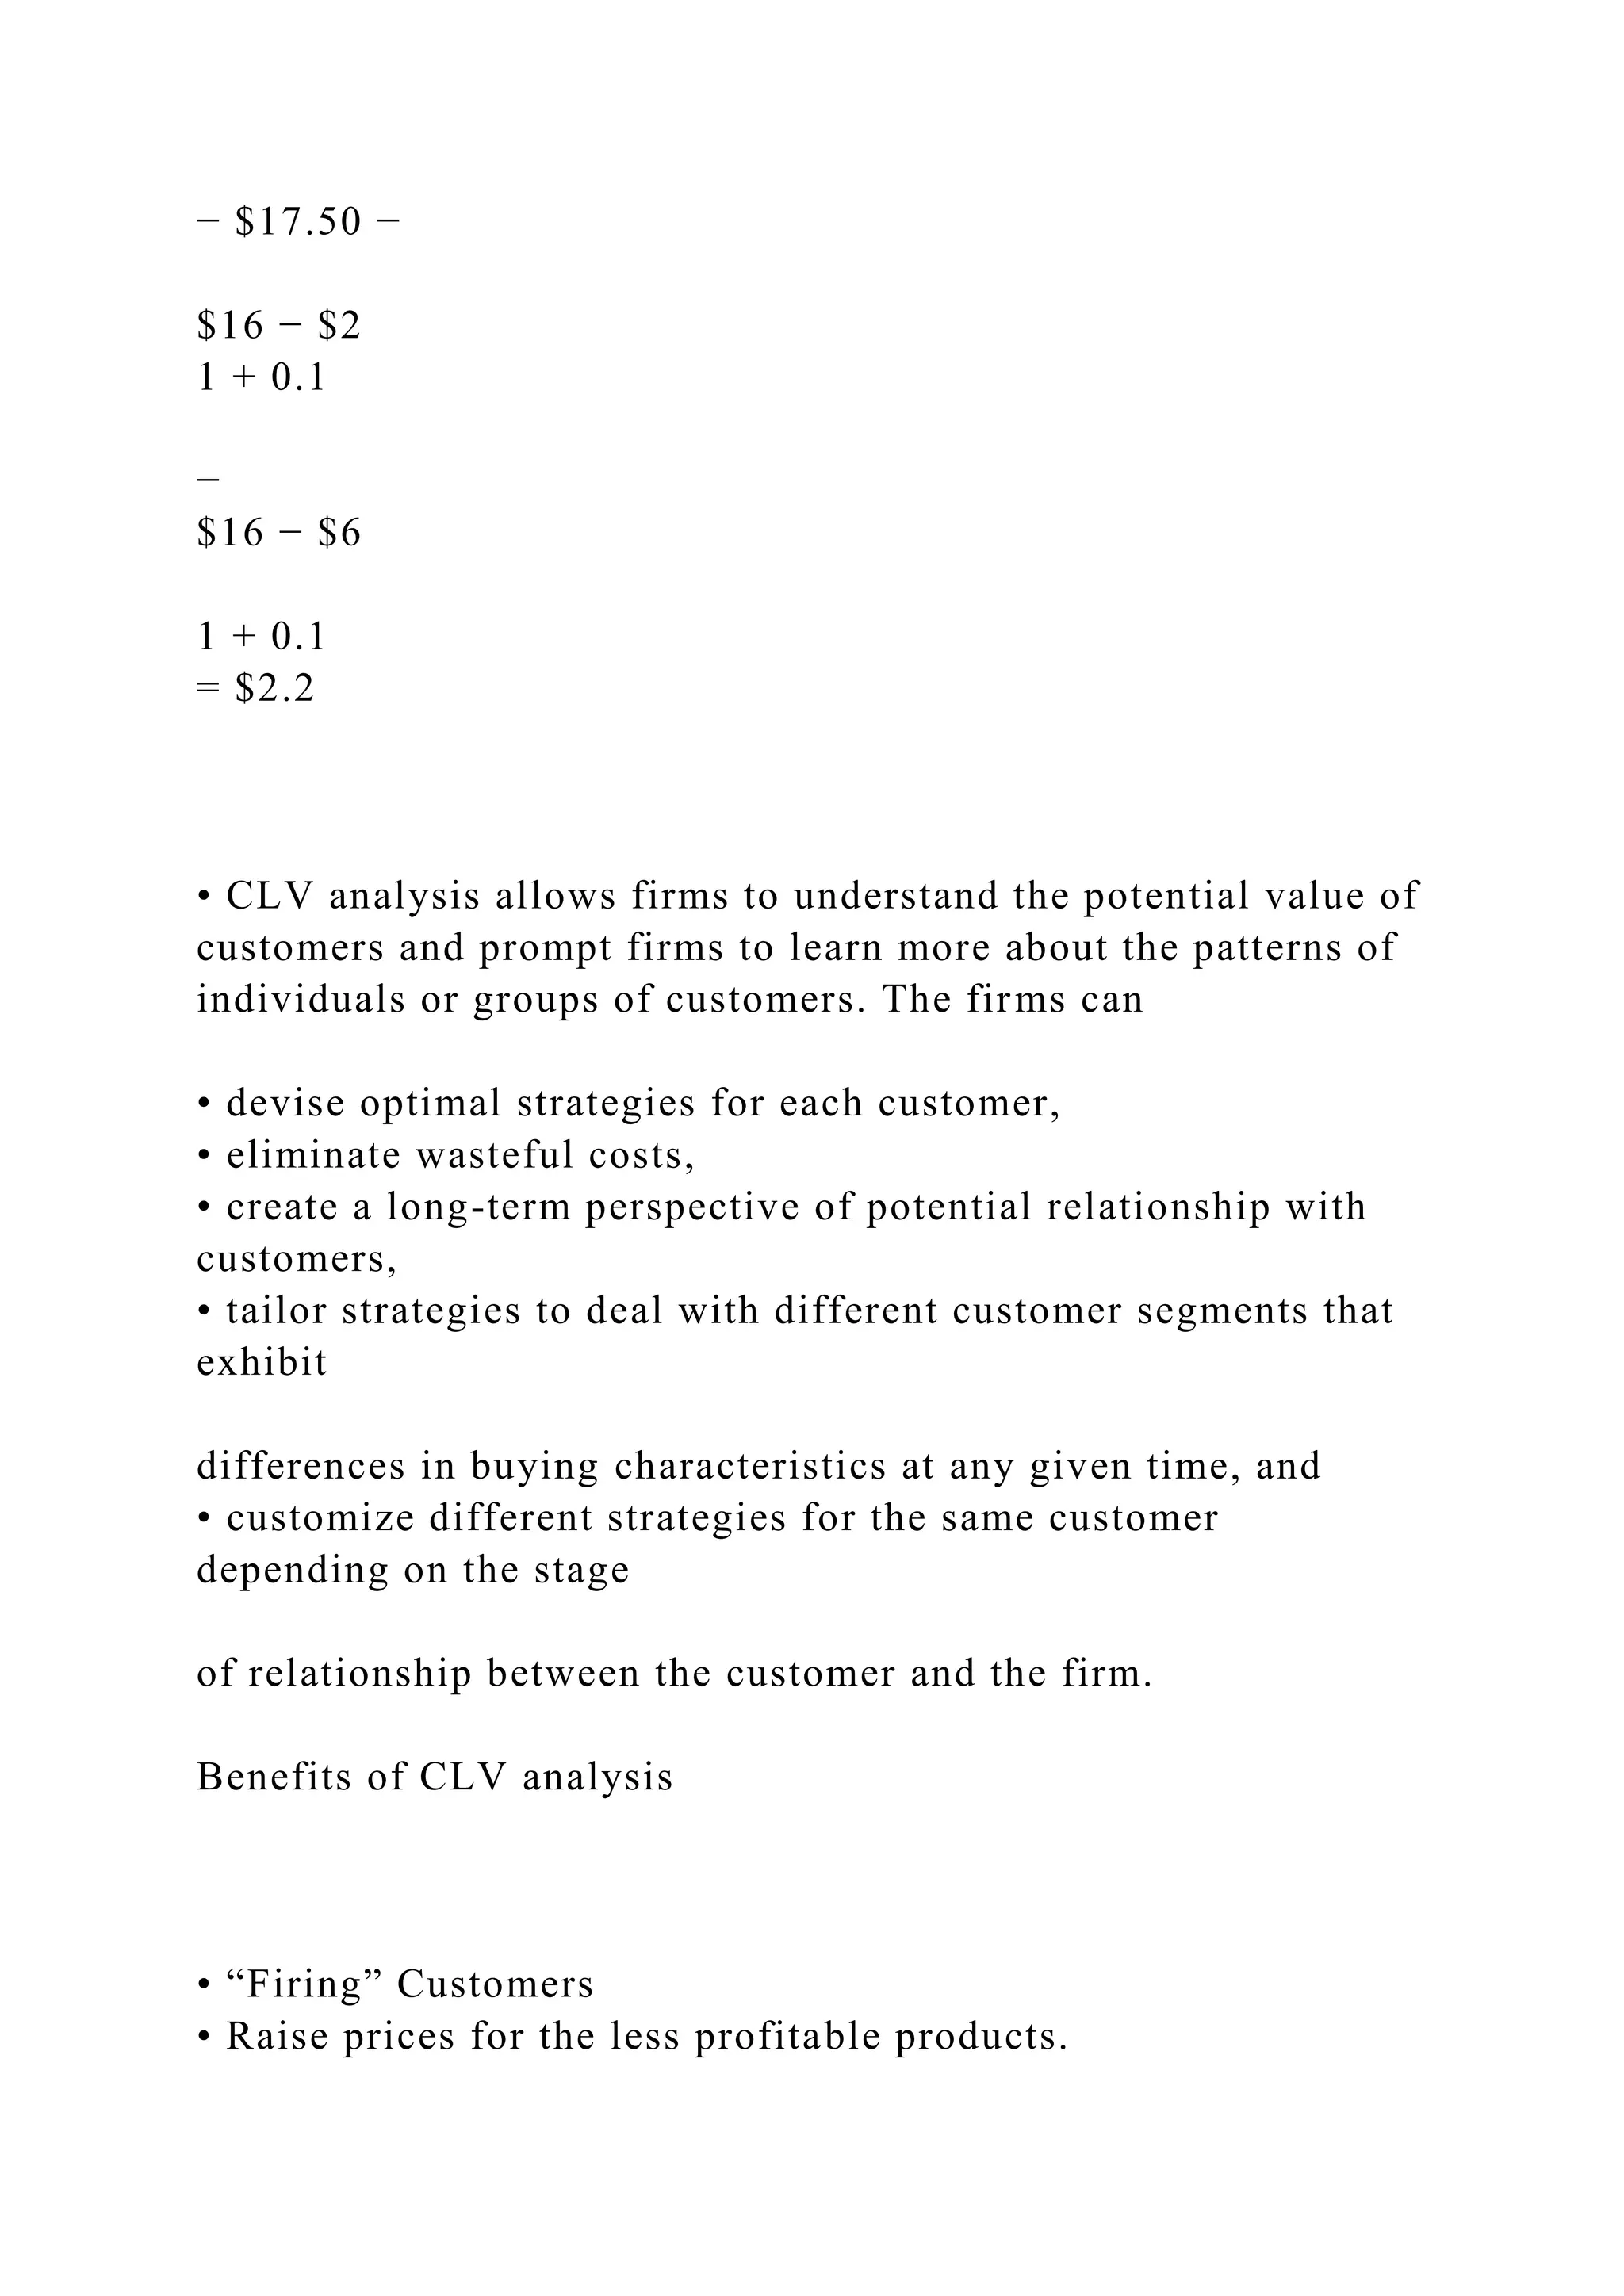
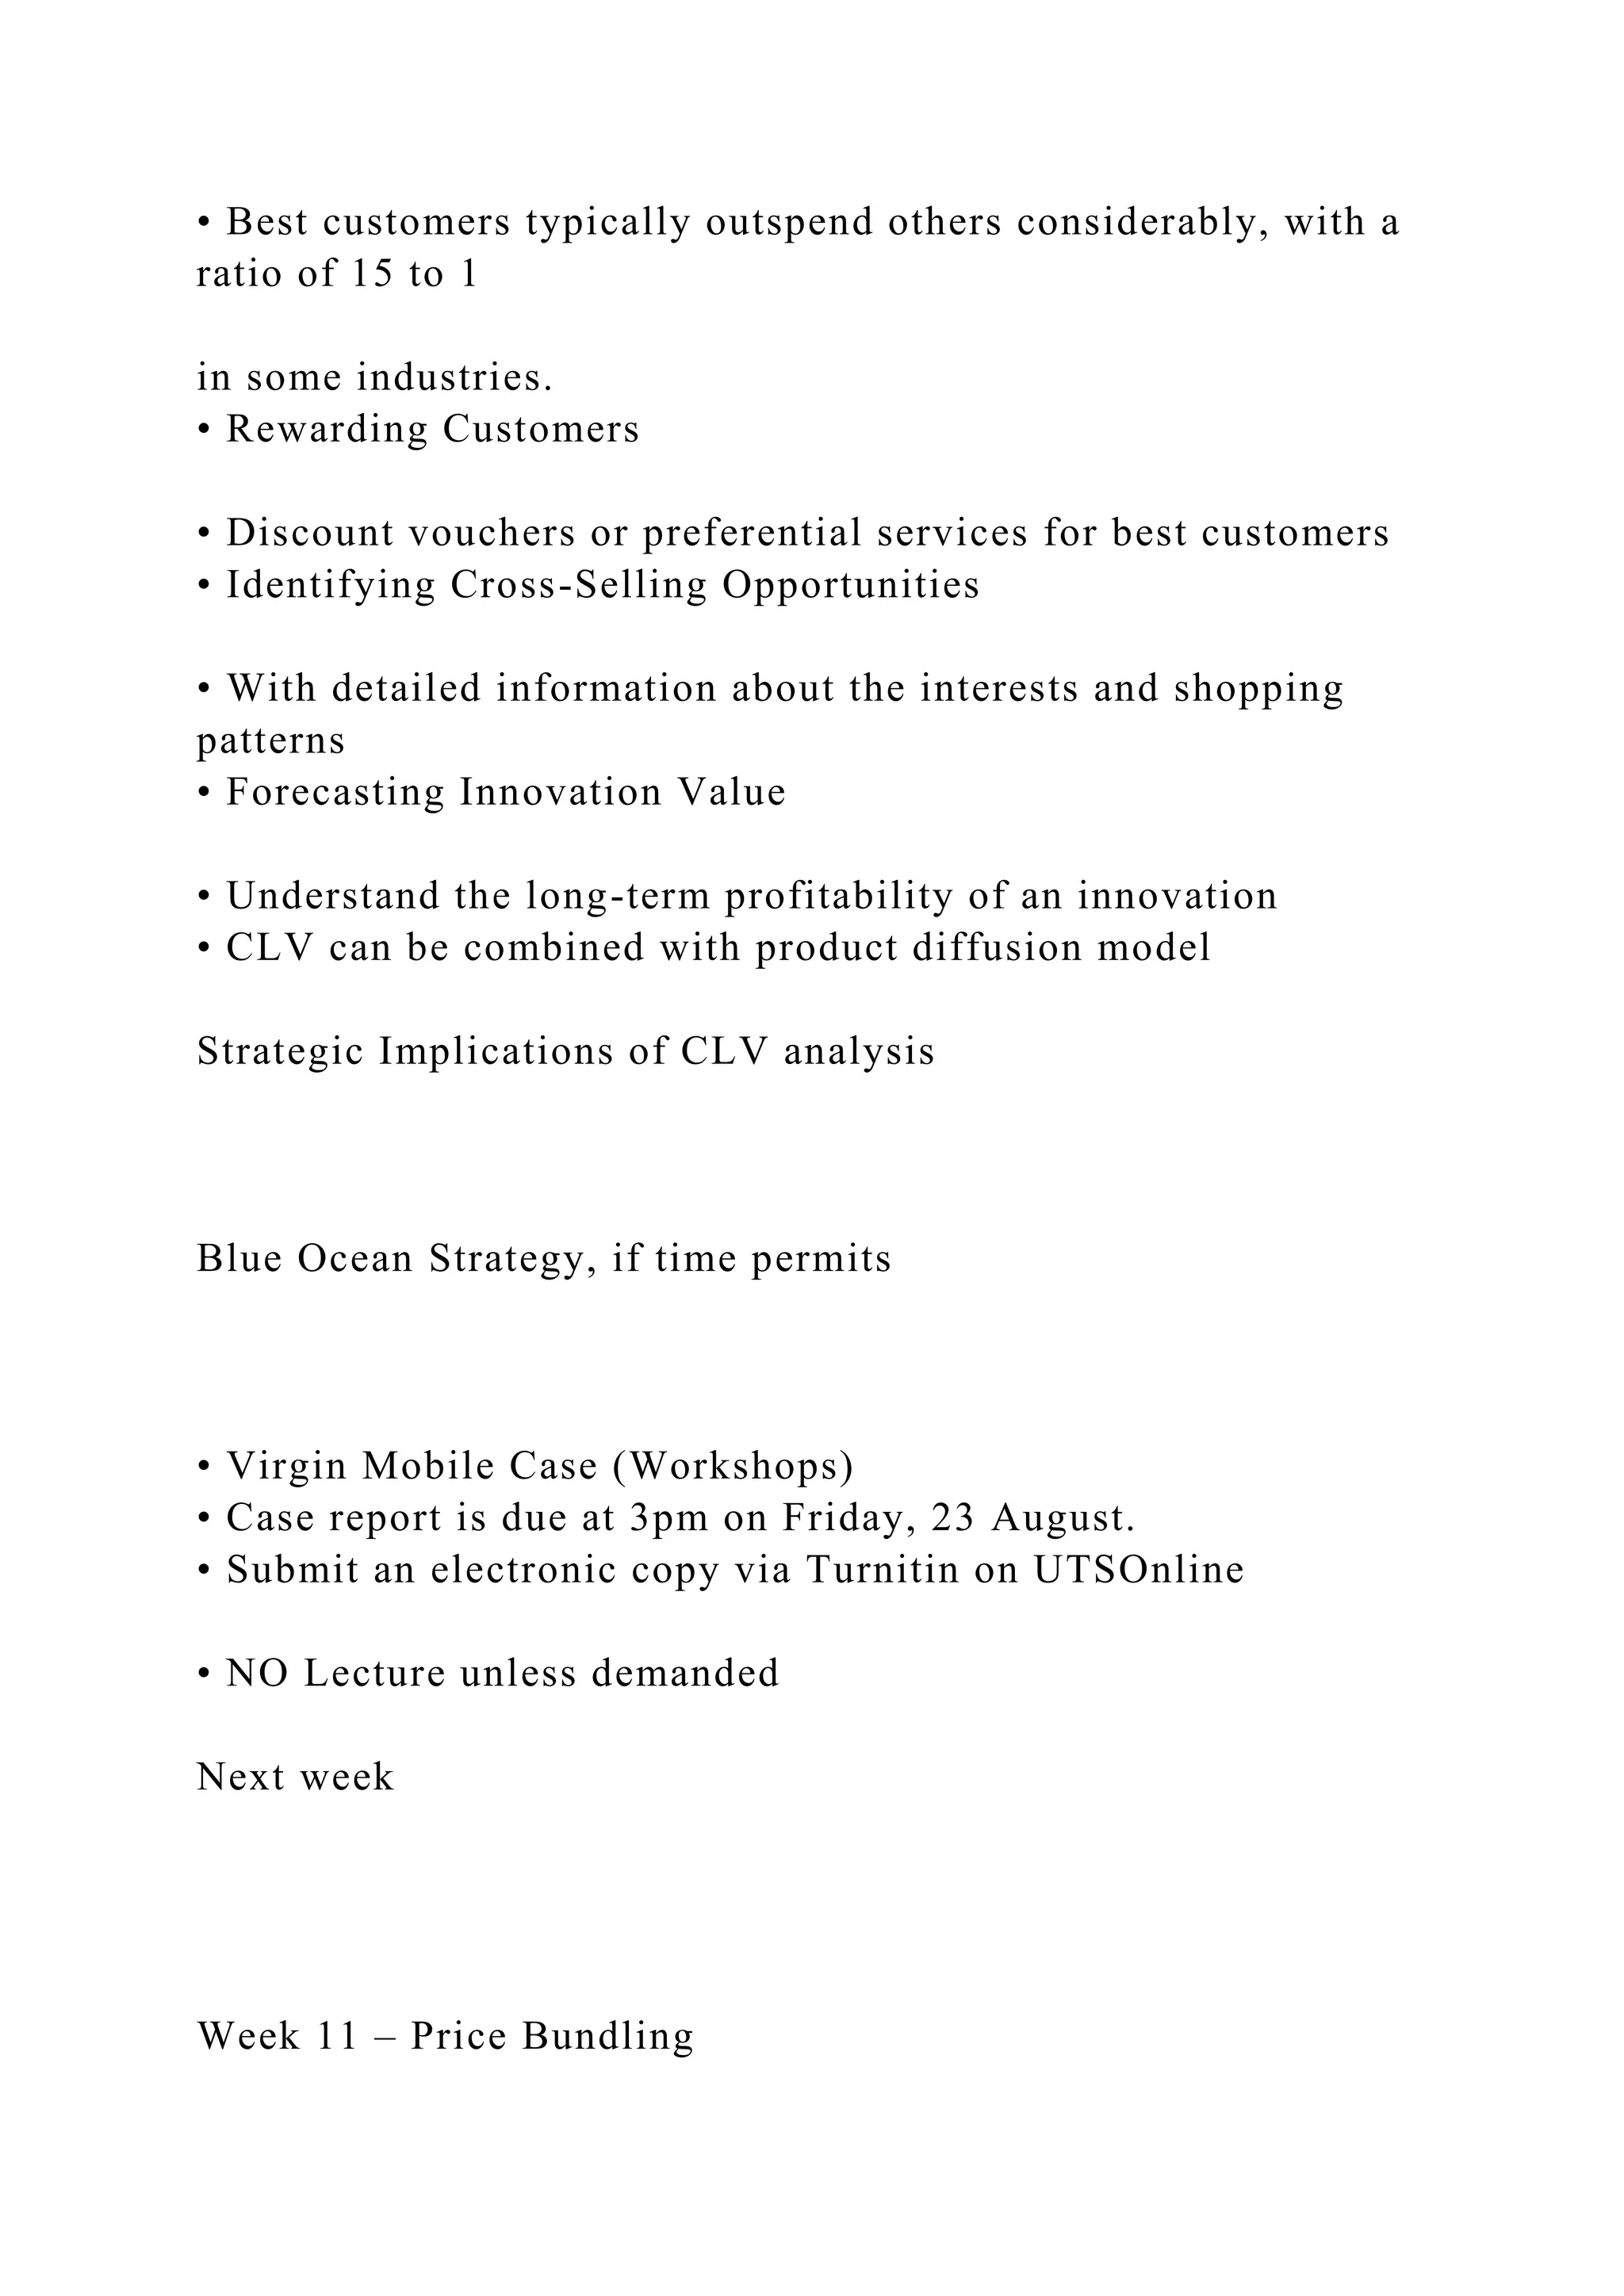
https://www.azed.gov/oelas/elps/
Use this to see the English Language Proficiency Standards of Arizona-Pick a grade level
https://cms.azed.gov/home/GetDocumentFile?id=54de1d88aadebe14a87070f0
http://www.corestandards.org/ELA-Literacy/introduction/how-to-read-the-standards/
how to read standards
Week 04
Acquisition and Customer Lifetime Value (CLV)
https://www.smh.com.au/politics/federal/nbn-customers-face-higher-prices-or-poorer-internet-connection-audit-warns-20190813-p52go7.html
Customer Relationship Management?
CRM is the process of carefully managing detailed information about individual
customers and all customer touch points to maximize customer loyalty.
Now closely associated with data warehousing and mining
Relationship
Relationship
Identifying good customers: RFM Model
Recency
Frequency
Monetary Value
Time/purchase occasions since the last purchase
Number of purchase occasions since first purchase
Amount spent since the first purchase
R
F
M
Total RFM Score: R Score + F score + M Score
CASE: Database for BookBinders Book Club
Predict response to a mailing for the book, Art History of Florence, based on the
following variables accumulated in the database and the responses to a test mailing:
Gender
Amount purchased
Months since first purchase
Months since last purchase
Frequency of purchase
Past purchases of art books
Past purchases of children’s books
Past purchases of cook books
Past purchases of DIY books
Past purchases of youth books
Recency
Frequency
Monetary
Example: RFM Model Scoring Criteria
R
Months from last
purchase
13-max 10-12 7-9 3-6 0-2
Score 5pts 10 15 20 25
F
Frequency > 30 21-30 16-20 11-15 0-10
Score 25pts 20 15 10 5
M
Amount
purchased
> 400 301-400 201-300 101- 200 100
Score 50 45 30 15 10
Implement using Nested If statements in Excel
Decile Classification
• Standard Assessment Method
• Apply the results of approach and
calculate the “score” of each individual
• Order the customers based on “score”
from the highest to the lowest
• Divide into deciles
• Calculate profits per deciles
Customer 1 Score 1.00
Customer 2 Score 0.99
….
Customer 230 Score 0.92
Customer 2300 Score 0.00
Decile1
Decile10
…
..
…
..
Output for Bookbinders club
Decile Score RFM No. of Mailings Cost of mailing RFM Units sold RFM Profit
10 17.6% 5000 $3,250 783 $4,733
20 34.8% 10000 $6,500 1,543 $9,243
30 46.1% 15000 $9,750 2,043 $11,093
40 53.4% 20000 $13,000 2,370 $11,170
50 65.2% 25000 $16,250 2,891 $13,241
60 77.9% 30000 $19,500 3,457 $15,757
70 83.3% 35000 $22,750 3,696 $14,946
80 91.7% 40000 $26,000 4,065 $15,465
90 97.5% 45000 $29,250 4,326 $14,876
100 100.0% 50000 $32,500 4,435 $12,735
Note: Market Potential = 4435 units and margin = $10.20
Leaky bucket
New customer
acquisition
Purchase increase by
current customers
Purchase decrease by
current customers
Lost customers
Lost customers
Credit Card Rewards Program ...
Acting as digital analyst for RestorationHardware.com, 2016 sales have been forecasted based on the previous 4-years of data from the web analytics provider.
Scenario:
▪ In order to save money in the down economy, RestorationHardware.com has reduced marketing spending and cut inventory buys.
▪ This strategy caused for negative sales growth – much lower than expected.
Goal:
▪ Increase Sales back to positive growth rate to reach $662m in Item Sales for 2016.
▪ List what metrics will be used.
Purchasing cooperatives have become an essential tool for many businesses and organizations. Purchasing cooperatives help members improve their competitiveness, and leverage their combined purchasing volumes into savings and efficiencies. In this four-part educational series, co-op developers will learn the strategies and the development process for starting a purchasing cooperative.
Attendees will learn how to:
Recognize the benefits of purchasing cooperatives
Define the types of cooperative purchasing
Define key factors in the feasibility of purchasing
cooperatives
Understand major steps in starting a purchasing cooperative
Part III: Feasibility of a Purchasing Co-op
Economics of starting a purchasing co-op
The chicken & egg situation
Ten qualifying questions
Great Expectations Retention Workshop2derekfmartin
Skills based workshop on Customer Retention. Why its important, how to measure it, and the tactics to drive a defensive and offensive strategy designed to optimize customer loyalty and revenue.
Simon Rowles Institutional Bank Presentation July 2014Simon Rowles
Presentation to a New Zealand institutional bank and their customers. The big data arms race is supermarket retail has finally come to banking with loyalty program now capable of covering all bank products through data driven merchant funded value.
2014 Customer Loyalty ASEAN Conference: Prof de los ReyesJim D Griffin
Prof. Francisco de los Reyes (Prof. Kikko) discusses the art and science of segmentation, using a case-study approach. He presents a practical 8-step framework that loyalty marketers can use to improve engagement and sales. Prof. Kikko is a consultant for measurement science at Nielsen Media Research, SAS and McCann Worldgroup, among others, including a wide variety of marketing initiatives at top companies in the banking sector, FMCG and other verticals. He leads the statistical practice for Lassu (lassuloyalty.com)
The Case for Cash Recycling in VendingSchubert b2b
Presented by Chuck Reed, Marketing Director - Vending Americas and SE Asia
For more information: chuck.reed@meigroup.com
http://www.meigroup.com/usa/vending/
In an effort to find a way to build the best fundraising product possible the idea of a Universal Gift Cert was explored for development. The core idea was based on tapping into the well established Federal Reserve check processing system that has been in place for over 1000 years and is in a declining use in the past 15 years. This low cost processing model, along with the ability to get more funds to charities, schools, non profits and churches was explored.
httpfmx.sagepub.comField Methods DOI 10.117715258.docxpooleavelina
http://fmx.sagepub.com
Field Methods
DOI: 10.1177/1525822X04269550
2005; 17; 30 Field Methods
Don A. Dillman and Leah Melani Christian
Survey Mode as a Source of Instability in Responses across Surveys
http://fmx.sagepub.com/cgi/content/abstract/17/1/30
The online version of this article can be found at:
Published by:
http://www.sagepublications.com
can be found at:Field Methods Additional services and information for
http://fmx.sagepub.com/cgi/alerts Email Alerts:
http://fmx.sagepub.com/subscriptions Subscriptions:
http://www.sagepub.com/journalsReprints.navReprints:
http://www.sagepub.com/journalsPermissions.navPermissions:
http://fmx.sagepub.com/cgi/content/refs/17/1/30 Citations
at SAGE Publications on September 9, 2009 http://fmx.sagepub.comDownloaded from
http://fmx.sagepub.com/cgi/alerts
http://fmx.sagepub.com/subscriptions
http://www.sagepub.com/journalsReprints.nav
http://www.sagepub.com/journalsPermissions.nav
http://fmx.sagepub.com/cgi/content/refs/17/1/30
http://fmx.sagepub.com
10.1177/1525822X04269550FIELD METHODSDillman, Christian / SURVEY MODE AS SOURCE OF INSTABILITY
Survey Mode as a Source of Instability
in Responses across Surveys
DON A. DILLMAN
LEAH MELANI CHRISTIAN
Washington State University
Changes in survey mode for conducting panel surveys may contribute significantly to
survey error. This article explores the causes and consequences of such changes in
survey mode. The authors describe how and why the choice of survey mode often
causes changes to be made to the wording of questions, as well as the reasons that
identically worded questions often produce different answers when administered
through different modes. The authors provide evidence that answers may change as a
result of different visual layouts for otherwise identical questions and suggest ways
to keep measurement the same despite changes in survey mode.
Keywords: survey mode; questionnaire; panel survey; measurement; survey error
Most panel studies require measurement of the same variables at different
times. Often, participants are asked questions, several days, weeks, months,
or years apart to measure change in some characteristics of interest to the
investigation. These characteristics might include political attitudes, satis-
faction with a health care provider, frequency of a behavior, ownership of
financial resources, or level of educational attainment. Whatever the charac-
teristic of interest, it is important that the question used to ascertain it perform
the same across multiple data collections.
In addition, declining survey response rates, particularly for telephone
surveys, have encouraged researchers to use multiple modes of data collec-
tion during the administration of a single cross-sectional survey. Encouraged
by the availability of more survey modes than in the past and evidence that a
change in modes produces higher response rates (Dillman 2002), surveyors
This is a revision of a paper presented at t ...
https://iexaminer.org/fake-news-personal-responsibility-must-trump-intellectual-laziness/
Fake news: Personal responsibility must trump intellectual laziness
By Matt Chan January 4, 2017
Where do you get your news? That question has become incredibly important given the results of our Presidential Election. How many times have you heard, “I read a news story on Facebook and …” The problem: Facebook is not a news service; it’s a “social media” site whose purpose is to connect like-minded friends and family, to provide you with social connections, and online entertainment.
For Asian Americans social media provides an important and useful way of connecting socially and in some cases politically, but there is a downside. The downside is how social media actually works. These sites employ elaborate algorithms to track and analyze your posts, likes, and dislikes to provide you with a custom experience unique to you. The truth is you are being marketed to, not informed. What looks like news, is not really news, it’s personal validation. All in an attempt to keep you on the site longer, to click a few more things, to make you feel good about what you’re reading. It makes it seem like most people agree with you because you’re only fed information and stories that validate your worldview.
On the other hand, real news is hard work. Its fact-based information presented by people who have checked, researched, and documented what they are presenting as the truth. Real news can be verified.
“Fake News” is, well, fake, often times entirely made-up or containing a hint of truth. Social media was largely responsible for pushing “fake news” stories that were entirely made up to drive clicks on websites. These clicks in turn generated money for the people promoting the stories. The more outrageous the story, the more clicks, the more revenue. When you factor in the algorithms that feed you what you like, you can clearly see the more “fake news” you consume on social media, the more is pushed your way. There’s an abundance of pseudo news sites that merely re-post and curate existing stories, adding their bias to validate their audience’s beliefs, no matter how crazy or mainstream. It is curated solely for you. Now factor in that nearly 44% of Americans obtain some or most of their news from social media and you have a very toxic mix.
The mainstream news media has also fallen into this validation trap. You have one news network that solely reflects the right wing, others that take the view of the left-center leaning, and what is lost are the facts and context, the balance we need to evaluate, learn, and understand the world. People seeking fact-based journalism lose, because the more extreme the media becomes to entice consumers with provocative headlines and click-bait to earn more money, the less their news is fact-based and becomes more opinion driven.
There was a time when fact-based reporting was required of broadcast news. It was called “The Fairness Doctrin ...
http1500cms.comBECAUSE THIS FORM IS USED BY VARIOUS .docxpooleavelina
http://1500cms.com/
BECAUSE THIS FORM IS USED BY VARIOUS GOVERNMENT AND PRIVATE HEALTH PROGRAMS, SEE SEPARATE INSTRUCTIONS ISSUED BY
APPLICABLE PROGRAMS.
NOTICE: Any person who knowingly files a statement of claim containing any misrepresentation or any false, incomplete or misleading information may
be guilty of a criminal act punishable under law and may be subject to civil penalties.
REFERS TO GOVERNMENT PROGRAMS ONLY
MEDICARE AND CHAMPUS PAYMENTS: A patient’s signature requests that payment be made and authorizes release of any information necessary to process
the claim and certifies that the information provided in Blocks 1 through 12 is true, accurate and complete. In the case of a Medicare claim, the patient’s signature
authorizes any entity to release to Medicare medical and nonmedical information, including employment status, and whether the person has employer group health
insurance, liability, no-fault, worker’s compensation or other insurance which is responsible to pay for the services for which the Medicare claim is made. See 42
CFR 411.24(a). If item 9 is completed, the patient’s signature authorizes release of the information to the health plan or agency shown. In Medicare assigned or
CHAMPUS participation cases, the physician agrees to accept the charge determination of the Medicare carrier or CHAMPUS fiscal intermediary as the full charge,
and the patient is responsible only for the deductible, coinsurance and noncovered services. Coinsurance and the deductible are based upon the charge
determination of the Medicare carrier or CHAMPUS fiscal intermediary if this is less than the charge submitted. CHAMPUS is not a health insurance program but
makes payment for health benefits provided through certain affiliations with the Uniformed Services. Information on the patient’s sponsor should be provided in those
items captioned in “Insured”; i.e., items 1a, 4, 6, 7, 9, and 11.
BLACK LUNG AND FECA CLAIMS
The provider agrees to accept the amount paid by the Government as payment in full. See Black Lung and FECA instructions regarding required procedure and
diagnosis coding systems.
SIGNATURE OF PHYSICIAN OR SUPPLIER (MEDICARE, CHAMPUS, FECA AND BLACK LUNG)
I certify that the services shown on this form were medically indicated and necessary for the health of the patient and were personally furnished by me or were furnished
incident to my professional service by my employee under my immediate personal supervision, except as otherwise expressly permitted by Medicare or CHAMPUS
regulations.
For services to be considered as “incident” to a physician’s professional service, 1) they must be rendered under the physician’s immediate personal supervision
by his/her employee, 2) they must be an integral, although incidental part of a covered physician’s service, 3) they must be of kinds commonly furnished in physician’s
offices, and 4) the services of nonphysicians must be included on the physician’s bills.
For CHA ...
https://www.medicalnewstoday.com/articles/323444.php
https://ascopubs.org/doi/full/10.1200/JCO.2008.16.0333
https://journals.lww.com/co-hematology/Abstract/2007/03000/Influence_of_new_molecular_prognostic_markers_in.5.aspx
Influence of new molecular prognostic markers in patients with karyotypically normal acute myeloid leukemia: recent advances
Mrózek, Krzysztofa; Döhner, Hartmutb; Bloomfield, Clara Da
Current Opinion in Hematology: March 2007 - Volume 14 - Issue 2 - p 106–114
doi: 10.1097/MOH.0b013e32801684c7
Myeloid disease
Purpose of review Molecular study of cytogenetically normal acute myeloid leukemia is among the most active areas of leukemia research. Despite having the same normal karyotype, adults with de-novo cytogenetically normal acute myeloid leukemia who constitute the largest cytogenetic group of acute myeloid leukemia, are very diverse with respect to acquired gene mutations and gene expression changes. These genetic alterations affect clinical outcome and may assist in selection of proper treatment. Herein we critically summarize recent clinically relevant molecular genetic studies of cytogenetically normal acute myeloid leukemia.
Recent findings NPM1 gene mutations causing aberrant cytoplasmic localization of nucleophosmin have been demonstrated to be the most frequent submicroscopic alterations in cytogenetically normal acute myeloid leukemia and to confer improved prognosis, especially in patients without a concomitant FLT3 gene internal tandem duplication. Overexpressed BAALC, ERG and MN1 genes and expression of breast cancer resistance protein have been shown to confer poor prognosis. A gene-expression signature previously suggested to separate cytogenetically normal acute myeloid leukemia patients into prognostic subgroups has been validated on a different microarray platform, although gene-expression signature-based classifiers predicting outcome for individual patients with greater accuracy are still needed.
Summary The discovery of new prognostic markers has increased our understanding of leukemogenesis and may lead to improved prognostication and generation of novel risk-adapted therapies.
http://www.bloodjournal.org/content/127/1/53?sso-checked=true
An update of current treatments for adult acute myeloid leukemia
Hervé Dombret and Claude Gardin
Abstract
Recent advances in acute myeloid leukemia (AML) biology and its genetic landscape should ultimately lead to more subset-specific AML therapies, ideally tailored to each patient's disease. Although a growing number of distinct AML subsets have been increasingly characterized, patient management has remained disappointingly uniform. If one excludes acute promyelocytic leukemia, current AML management still relies largely on intensive chemotherapy and allogeneic hematopoietic stem cell transplantation (HSCT), at least in younger patients who can tolerate such intensive treatments. Nevertheless, progress has been made, notably in terms of standard drug dose in ...
httpstheater.nytimes.com mem theater treview.htmlres=9902e6.docxpooleavelina
https://theater.nytimes.com/ mem/ theater/ treview.html?res=9902e6db1639f931a25753c1a962948260
THEATER: WILSON'S 'MA RAINEY'S' OPENS
By FRANK RICH
Published: October 12, 1984, Friday
LATE in Act I of ''Ma Rainey's Black Bottom,'' a somber, aging band trombonist (Joe Seneca) tilts his head heavenward to sing the blues. The setting is a dilapidated Chicago recording studio of 1927, and the song sounds as old as time. ''If I had my way,'' goes the lyric, ''I would tear this old building down.''
Once the play has ended, that lyric has almost become a prophecy. In ''Ma Rainey's Black Bottom,'' the writer August Wilson sends the entire history of black America crashing down upon our heads. This play is a searing inside account of what white racism does to its victims - and it floats on the same authentic artistry as the blues music it celebrates. Harrowing as ''Ma Rainey's'' can be, it is also funny, salty, carnal and lyrical. Like his real-life heroine, the legendary singer Gertrude (Ma) Rainey, Mr. Wilson articulates a legacy of unspeakable agony and rage in a spellbinding voice.
The play is Mr. Wilson's first to arrive in New York, and it reached here, via the Yale Repertory Theater, under the sensitive hand of the man who was born to direct it, Lloyd Richards. On Broadway, Mr. Richards has honed ''Ma Rainey's'' to its finest form. What's more, the director brings us an exciting young actor - Charles S. Dutton - along with his extraordinary dramatist. One wonders if the electricity at the Cort is the same that audiences felt when Mr. Richards, Lorraine Hansberry and Sidney Poitier stormed into Broadway with ''A Raisin in the Sun'' a quarter-century ago.
As ''Ma Rainey's'' shares its director and Chicago setting with ''Raisin,'' so it builds on Hansberry's themes: Mr. Wilson's characters want to make it in white America. And, to a degree, they have. Ma Rainey (1886-1939) was among the first black singers to get a recording contract - albeit with a white company's ''race'' division. Mr. Wilson gives us Ma (Theresa Merritt) at the height of her fame. A mountain of glitter and feathers, she has become a despotic, temperamental star, complete with a retinue of flunkies, a fancy car and a kept young lesbian lover.
The evening's framework is a Paramount-label recording session that actually happened, but whose details and supporting players have been invented by the author. As the action swings between the studio and the band's warm-up room - designed by Charles Henry McClennahan as if they might be the festering last- chance saloon of ''The Iceman Cometh'' - Ma and her four accompanying musicians overcome various mishaps to record ''Ma Rainey's Black Bottom'' and other songs. During the delays, the band members smoke reefers, joke around and reminisce about past gigs on a well-traveled road stretching through whorehouses and church socials from New Orleans to Fat Back, Ark.
The musicians' speeches are like improvised band solos - variously fiz ...
https://fitsmallbusiness.com/employee-compensation-plan/
The puzzle of motivation | Dan Pink [Video file]. Retrieved from https://www.youtube.com/watch?v=rrkrvAUbU9Y
Refining the total rewards package through employee input at MillerCoors [Video file]. Retrieved from https://www.youtube.com/watch?v=_I7nv0B4_NU&feature=youtu.be
How to design an employee compensation plan [SlideShare slides]. Retrieved from http://www.slideshare.net/FitSmallBusiness/how-to-design-a-compensation-plan-dave?ref=http://fitsmallbusiness.com/how-to-pay-employees/
Compensation strategies [Video file]. Retrieved from https://youtu.be/U2wjvBigs7w
· Expectations for Power Point Presentations in Units IV and V
I would like to provide information about what needs to be included in presentations. Please review the rubric prior to submitting any assignment. If you don't know where to find this, please contact me.
1. You need a title slide.
2. You need an overview of the presentation slide (slide after the title slide). This is how you would organize a presentation if you were presenting it at work.
3. You need a summary slide (before the reference slide); same reason as above.
4. Please do not forget to cite on slides where you are writing about something related to what you have read. Please consider each slide a paragraph. You can cite on the slides or in the notes. If you do not cite, you will not get credit for the slide.
- Direct quotes should not be used in this presentation as they are not analysis.
5. Remember, all I can evaluate is what you submit, so please consider using notes to explain what you are writing in further detail. Bullets are great and you can use these but then provide more detail in the notes.
6. Graphics - Please include graphics/charts/graphs as this is evaluated in the rubric (quality of the presentation).
7. References - For all references, you need citations. For all citations, you need references. They must match. All must be formatted using APA requirements. Please review the Quick Reference Guide that was posted in the announcements.
Please never hesitate to email me with any questions. If you need further clarification about feedback or if you do not agree with any of the feedback, please contact me. My door is always open.
Assignment 1
Positioning Statement and Motto
Use the provided information, as well as your own research, to assess one (1) of the stated brands (Tesla, SmoothieKing, Suave, or Nintendo) by completing the questions below with an ORIGINAL response to each. At the end of the worksheet, be sure to develop a new ORIGINAL positioning statement and motto for the brand you selected. Submit the completed template in the Week 4 assignment submission link.
Name:
Professor’s Name:
Course Title:
Date:
Company/Brand Selected (Tesla, SmoothieKing, Suave or Nintendo):
1. Target Customers/Users
Who are the target customers for the company/brand? Make sure you tell why you selected each item that you did. (NOTE: DO NO ...
http://hps.org/documents/pregnancy_fact_sheet.pdf
https://www.asge.org/docs/default-source/education/practice_guidelines/doc-5c7150fd-910a-4181-89bf-bc697b369103.pdf?sfvrsn=6
http://hps.org/hpspublications/articles/pregnancyandradiationexposureinfosheet.html
Data Science
and
Big Data Analytics
Chapter 12: The Endgame, or Putting It All Together
1
Chapter Contents
12.1 Communicating and Operationalizing an Analytics Project
12.2 Creating the Final Deliverables
Developing core material for multiple audiences, project goals, main findings, approach, model description, key points supported with data, model details, recommendations, tips on final presentation, providing technical specifications and code
12.3 Data Visualization Basics
Key points supported with data, evolution of a graph, common representation methods, how to clean up a graphic, additional considerations
Summary
2
12.1 Communicating and Operationalizing an Analytics Project
3
12.1 Communicating and Operationalizing an Analytics Project
Deliverables and Stakeholders
4
12.1 Communicating and Operationalizing an Analytics Project
Deliverables
General Deliverables – from Textbook
Presentation for Project Sponsors
Presentation for Analysts
Code
Technical Specifications
Deliverables For This Course
Presentation for Analysts – half hour per team, next week
Technical Paper for Research Day Conference
Submit CD – Presentation, Paper, Data or URL, Code
5
12.2 Creating the Final Deliverables
Case Study – Fictional Bank Churn Prediction
This section describes a scenario of a fictional bank and a churn prediction model of its customers
The analytic plan contains components that can be used as inputs for writing the final presentations
scope
underlying assumptions
modeling techniques
initial hypotheses
and key findings
6
12.2 Creating the Final Deliverables
Case Study – Fictional Bank Churn Prediction
7
12.2 Creating the Final Deliverables
Case Study – Fictional Bank Analytics Plan
8
12.2 Creating the Final Deliverables
12.2.1 Developing Core Material for Multiple Audiences
Some project components have dual use
Create core materials used for both analyst and business audiences
Three areas on the next slide used for both audiences
Sections after the following overview slide
12.2.2 – Project Goals
12.2.3 – Key Findings
12.2.4 – Approach
12.2.5 – Model Description
12.2.6 – Key Points Supported by Data
12.2.7 – Model Details
12.2.8 – Recommendations
12.2.9 – Additional Tips on the Final Presentation
12.2.10 – Providing Technical Specifications and Code
9
12.2 Creating the Final Deliverables
12.2.1 Developing Core Material for Multiple Audiences
10
12.2 Creating the Final Deliverables
12.2.2 Project Goals
The project goals portion of the final presentation is generally the same for sponsors and analysts
The project goals are described first to lay the groundwork for the solution and recommendations
Generally, the goals are agreed on earl ...
https://www.worldbank.org/en/country/vietnam/overview
-------------- Context ----------------
Vietnam’s development over the past 30 years has been remarkable. Economic and political reforms under Đổi Mới, launched in 1986, have spurred rapid economic growth, transforming what was then one of the world’s poorest nations into a lower middle-income country. Between 2002 and 2018, more than 45 million people were lifted out of poverty. Poverty rates declined sharply from over 70% to below 6% (US$3.2/day PPP), and GDP per capita increased by 2.5 times, standing over US$2,500 in 2018.
In the medium-term, Vietnam’s economic outlook is positive, despite signs of cyclical moderation in growth. After peaking at 7.1% in 2018, real GDP growth in 2019 is projected to slightly decelerate in 2019, led by weaker external demand and continued tightening of credit and fiscal policies. Real GDP growth is projected to remain robust at around 6.5% in 2020 and 2021. Annual headline inflation has been stable for the seven consecutive years – at single digits, trending towards 4% and below in recent years. The external balance remains under control and should continue to be financed by strong FDI inflows which reached almost US$18 billion in 2018 – accounting for almost 24% of total investment in the economy.
Vietnam is experiencing rapid demographic and social change. Its population reached 97 million in 2018 (up from about 60 million in 1986) and is expected to expand to 120 million before moderating around 2050. Today, 70% of the population is under 35 years of age, with a life expectancy of 76 years, the highest among countries in the region at similar income levels. But the population is rapidly aging. And an emerging middle class, currently accounting for 13% of the population, is expected to reach 26% by 2026.
Vietnam ranks 48 out of 157 countries on the human capital index (HCI), second in ASEAN behind Singapore. A Vietnamese child born today will be 67% as productive when she grows up as she could be if she enjoyed complete education and full health. Vietnam’s HCI is highest among middle-income countries, but there are some disparities within the country, especially for ethnic minorities. There would also be a need to upgrade the skill of the workforce to create productive jobs at a large scale in the future.
Over the last thirty years, the provision of basic services has significantly improved. Access of households to modern infrastructure services has increased dramatically. As of 2016, 99% of the population used electricity as their main source of lighting, up from 14 % in 1993. Access to clean water in rural areas has also improved, up from 17% in 1993 to 70% in 2016, while that figure for urban areas is above 95%.
Vietnam performs well on general education. Coverage and learning outcomes are high and equitably achieved in primary schools — evidenced by remarkably high scores in the Program for International Student Assessment (PISA) in 2012 and 2015, ...
HTML WEB Page solutionAbout.htmlQuantum PhysicsHomeServicesAbou.docxpooleavelina
HTML WEB Page solution/About.htmlQuantum PhysicsHomeServicesAboutContact Me
This website gives a detail inward look in quantam physics as it is a evolving field now-a-days and has many upcoming changes that is going to leave the world in shock. There has been a lot of confusion lately related to this topics in people so it is encourage that people visit this website and get to know more about this field and explore the horizons there is yet to come.
HTML WEB Page solution/FirstLastHomePage.htmlQuantum PhysicsHomeServicesAboutContact Me
Definition
Quantum mechanics is the part of material science identifying with the little.
It brings about what may have all the earmarks of being some extremely peculiar decisions about the physical world. At the size of particles and electrons, a significant number of the conditions of old style mechanics, which depict how things move at ordinary sizes and speeds, stop to be helpful. In traditional mechanics, objects exist in a particular spot at a particular time. Be that as it may, in quantum mechanics, protests rather exist in a fog of likelihood; they have a specific possibility of being at point An, another possibility of being at point B, etc.Three revolutionary principles
Quantum mechanics (QM) created over numerous decades, starting as a lot of questionable scientific clarifications of tests that the math of old style mechanics couldn't clarify. It started at the turn of the twentieth century, around a similar time that Albert Einstein distributed his hypothesis of relativity, a different numerical unrest in material science that portrays the movement of things at high speeds. In contrast to relativity, nonetheless, the sources of QM can't be credited to any one researcher. Or maybe, various researchers added to an establishment of three progressive rules that bit by bit picked up acknowledgment and exploratory confirmation somewhere in the range of 1900 and 1930. They are:
Quantized properties:
Certain properties, for example, position, speed and shading, can once in a while just happen in explicit, set sums, much like a dial that "clicks" from number to number. This tested a crucial presumption of old style mechanics, which said that such properties should exist on a smooth, ceaseless range. To portray the possibility that a few properties "clicked" like a dial with explicit settings, researchers begat the word "quantized".
Particles of light:
Light can now and again act as a molecule. This was at first met with unforgiving analysis, as it negated 200 years of trials indicating that light acted as a wave; much like waves on the outside of a quiet lake. Light acts comparatively in that it ricochets off dividers and twists around corners, and that the peaks and troughs of the wave can include or counteract. Included wave peaks bring about more splendid light, while waves that counterbalance produce obscurity. A light source can be thought of ...
https://www.huffpost.com/entry/online-dating-vs-offline_b_4037867
For your initial post, provide a sentence to share which article you are referring to so that you can best communicate with your peers. Include a link to your selection.
· Explain how the argument contains or avoids bias.
i. Provide specific examples to support your explanation.
ii. What assumptions does it make?
· Discuss the credibility of the overall argument.
i. Were the resources the argument was built upon credible?
ii. Does the credibility support or undermine the article’s claims in any important ways?
In response to your peers, provide an additional resource to support or refute the argument your peer makes. Do you agree with their claims of credibility? Are there any other possible bias not identified?
Response #1
Allysa Tantala posted Sep 22, 2019 10:17 PM
Subscribe
The article that I am looking at is Online Dating Vs. Offline Dating: Pros and Cons.It was written by Julie Spira, an online dating expert, bestselling author, and CEO of Cyber-Dating Expert. The name of the article is spot on in describing what it is about. The author goes through the pros and cons of dating online and offline in today’s day and age. The author avoids bias because she looks at both options in both their positive and negative attributes. She comes at the issues from both angles and I believe she does a very good job at remaining unbiased. She states that “if you're serious about meeting someone special, you must include a combination of both online and offline dating in your routine” (Spira, 2013, par. 18). She’s stating that both options have their pros and cons and that really a combination of both is needed to find someone. The only bias I could see anyone pointing out would be that she is a woman, so you do not get the male perspective on these things. That being said, I one hundred percent think she covers all of the questions people may have about online and offline dating in today’s world. The only assumption being made here is that the reader wants to be out in the dating world and they need to know what is best. But, the title of the article is pretty self-explanatory so if someone did not want to know these things, they would not have to waste their time reading it all because they could tell what it would be about by the title.
The resource that she used was herself, and like I stated above, she is an online dating expert, bestselling author, and CEO of Cyber-Dating Expert; so she is more than qualified to give her perspective on these issues. I find her to be credible and thought provoking. Her credibility supports everything the article says and makes the reader feel like they are being told the truth by someone who completely understands all of the pros and cons.
Resource:
Spira, J. (2013, December 3). Online Dating Vs. Offline Dating: Pros and Cons. Retrieved from https://www.huffpost.com/entry/online-dating-vs-offline_b_4037867
Response #2
Jennifer Caforio posted Se ...
https://www.vitalsource.com/products/comparative-criminal-justice-systems-harry-r-dammer-jay-s-v9781285630779
THE ASSIGNMENT IS BASED ON CHAPTER 1 (ONE)
Login : [email protected]
Password: Greekyogurt13!
1
3Defining the Problem
Rigina CochranMPA/593
August 19, 2019
Peter ReevesDefining the Problem
The health care system in Colorado is a composition of medical professionals providing services such as diagnosis, treatment, as well as preventive measures to mental illness and injuries ("Healthcare policy in Colorado - Ballotpedia," 2019). Health care policy involves the establishment and implementation of legislation and other regulations that the states use to manage its health care system effectively. Further, this sector consists of other participants, such as insurance and health information technology. The cost citizens pay for medical care and also the access to quality care influence the overall health care providers in Colorado. Therefore, the need for the creation and implementation of laws that help the state maintain efficiency in the health sector in Colorado.
Problem Statement
The declining standards of medical care within the United States has caused significant concern in the world. Due to these rising concerns, there have been various policies implemented, leading to mixed reactions among the different states. Some of the active policies implemented offer a long-term solution to this problem including Medicaid and Medicare. After acquiring state control, the Republicans dismissed the idea to expand and create medical insurance for Medicaid in Colorado. Sustaining the structure of the health care payroll calls for the deductions from the employees and the employers, which may lead to loss of jobs and increased burden of expenditure (Garcia, 2019).
Identify the Methodology
The main objective of this policy plan is to investigate the role of legislation in the management of the health care sector in the United States. Due to the need for achieving in-depth exploration, this paper uses a combination of both qualitative and quantitative methods of data collection by addressing both practical and theoretical aspects of the research. Based on the answers that the policy requires, choosing survey as the research design. This method involves collecting and analyzing data from a few people who represent the principal group within health care. However, the survey method faces some challenges such as attitudes and perception of the health workers leading to the delimitation of the study. The target population for the study includes the nurses within the health sectors in Colorado. The selection of the participants involved in the use of stratified random sampling.
Identify your Stakeholders
The major stakeholders in the creation and implementation of the policy plan include the legislatures, local government, patients, and other private parties such as the insurance companies. Collectively, these bodies are involved in the makin ...
https://www.nationaleatingdisorders.org/learn/by-eating-disorder/arfid
AVOIDANT RESTRICTIVE FOOD INTAKE DISORDER (ARFID)
Avoidant Restrictive Food Intake Disorder (ARFID) is a new diagnosis in the DSM-5, and was previously referred to as “Selective Eating Disorder.” ARFID is similar to anorexia in that both disorders involve limitations in the amount and/or types of food consumed, but unlike anorexia, ARFID does not involve any distress about body shape or size, or fears of fatness.
Although many children go through phases of picky or selective eating, a person with ARFID does not consume enough calories to grow and develop properly and, in adults, to maintain basic body function. In children, this results in stalled weight gain and vertical growth; in adults, this results in weight loss. ARFID can also result in problems at school or work, due to difficulties eating with others and extended times needed to eat.
DIAGNOSTIC CRITERIA
According to the DSM-5, ARFID is diagnosed when:
· An eating or feeding disturbance (e.g., apparent lack of interest in eating or food; avoidance based on the sensory characteristics of food; concern about aversive consequences of eating) as manifested by persistent failure to meet appropriate nutritional and/or energy needs associated with one (or more) of the following:
· Significant weight loss (or failure to achieve expected weight gain or faltering growth in children).
· Significant nutritional deficiency.
· Dependence on enteral feeding or oral nutritional supplements.
· Marked interference with psychosocial functioning.
· The disturbance is not better explained by lack of available food or by an associated culturally sanctioned practice.
· The eating disturbance does not occur exclusively during the course of anorexia nervosa or bulimia nervosa, and there is no evidence of a disturbance in the way in which one’s body weight or shape is experienced.
· The eating disturbance is not attributable to a concurrent medical condition or not better explained by another mental disorder. When the eating disturbance occurs in the context of another condition or disorder, the severity of the eating disturbance exceeds that routinely associated with the condition or disorder and warrants additional clinical attention.
RISK FACTORS
As with all eating disorders, the risk factors for ARFID involve a range of biological, psychological, and sociocultural issues. These factors may interact differently in different people, which means two people with the same eating disorder can have very diverse perspectives, experiences, and symptoms. Researchers know much less about what puts someone at risk of developing ARFID, but here’s what they do know:
· People with autism spectrum conditions are much more likely to develop ARFID, as are those with ADHD and intellectual disabilities.
· Children who don’t outgrow normal picky eating, or in whom picky eating is severe, appear to be more likely to develop ARFID.
· Many children with ARFID ...
https://www.youtube.com/watch?time_continue=59&v=Bh_oEYX1zNM&feature=emb_logo
BA 325 Pivot Table Assignment Answer Sheet
Name:
Before you do anything fill out your name on the assignment and save your file as BA325 Firstname Lastname (use your actual name).
The table has all of the questions from the DuPont Assignment. Fill in your answers to the questions in the corresponding cell in the Answer column. Below the table there is a spot for the Screen Clippings from both the Practice Assignment, and the DuPont Assignment.
After you have filled out all of the answers and Screen Clippings submit the file to the Assignments folder in D2L.
Q Number
Question
Answer
Q1
How much was American Airlines’ Net Revenues in 2013?
Q2
What was the Return on Equity for Apple in 2015?
Q3
Which company had the highest Net Income and in which year? What was the value?
Q4
Which company had the lowest Net Income and in which year? What was the value?
Q5
How many unique companies in your sample had Net Losses exceeding one billion dollars? Which companies, and what years?
Q6
What was the Sum of the Net Income for all companies in the sample for 2015?
Q7
Which company had the highest total Net Income over the three year period? What was the value?
Q8
Which company had the lowest total Net Income over the three year period? What was the value?
Q9
Which industry had the highest Average Profit Margin over the three year period? What was the value?
Q10
In which year was the Average Profit Margin the highest for the entire sample? What was the value?
Q11
For how many companies do you have Profit Margin ratio data in 2013?
Q12
For what Industry do you have the most Profit Margin ratio data in the sample? What was the value? For that Industry what year was the highest? What was the value?
Q13
Which Industry has the highest Average Asset Turnover over the three year period? What was the value?
Q14
Which of the remaining Industries has the highest Asset Turnover in 2014? What was the value?
Q15
Which Industry has the highest Average Financial Leverage over the three year period? What was the value?
Q16
Which Industry has the lowest Average Financial Leverage that does not include negative numbers in any year? What was the value?
Q17
What is the Average Financial Leverage for the Transportation Industry in 2013?
Note: The answer is odd. You will have to use Data Cleaning to resolve the issue.
Q18
Which Industry has the highest Average Return on Equity over the three year period and which company is the highest within that Industry? What are the values?
Q19
Which two companies in the Public Utilities Industry have the highest Average Return on Equity during the period? What are the values?
Q20
Which Industry had the largest decrease in Average Return on Equity between 2013 and 2014? What was the value?
Q21
Which Industry had the largest increase in Average Return on Equity between 2014 and 2015? What was the value?
Q22
Bonus Question 1: How many industrie ...
https://www.fbi.gov/news/pressrel/press-releases/fbi-expects-a-rise-in-scams-involving-cryptocurrency-related-to-the-covid-19-pandemic
https://www.coindesk.com/bitcoin-bulls-trillions-coronavirus-aid
https://www.forbes.com/sites/walterpavlo/2020/02/25/crime-and-punishment-in-the-cryptocurrency-world/#62232a6748fe
Running head: Bitcoin as a cryptocurrency 1
Bitcoin as a cryptocurrency 8Bitcoin as a Cryptocurrency of Misconduct
Roger F. Lewis
Miami Dade College-North Campus
June 5, 2019
Bitcoin as a Cryptocurrency of Misconduct
In the expansion of cryptocurrencies in particular bitcoins have resulted in providing clients with exceptional advantages, the advantages in this matter have not had their hazards and struggles. In the peculiar free mode in the cryptocurrency arcade, it has been in constant misuse and linked to several illegal activities. Lawmakers globally repetitively stumble upon this very position (Anon,2019). The tendency on allowing a market to settle on its fosters this activity as the lawmakers tend to abstain from events of the market. They cannot also sit by and enable misconduct behaviors to foster in the markets. Tracking the cryptocurrency action has proved to be much more complicated than the standard plugged-in transactions. The bottom line is that these transactions occur globally has established a headache to try and monitor this particular field. The release of the bitcoin in the year two thousand and nine as the world’s pioneer and most profound mode of cryptocurrency was a breakthrough in the industry. Cryptocurrency, on the other hand, is the mode of exchange that occurs only in the digital dimension. Cryptocurrency uses complex codes as a skill of protecting data. Thus, monetary transactions are carried out most safely (Anon,2019). A public ledger is used to know the actual owner of a particular cryptocurrency.
Assets in the digital market portray distinctive characteristics –delegation, simple connections between members as well as the relative use of modern technology, many have the thought or mindset that in time bitcoins will be used as a forthcoming currency. To understand the illegal uses of bitcoins we must first address the non-illegal activities in this field. As earlier stated, there is a possibility that the bitcoins will indeed replace the current custom. One can lawfully use bid coins in the following areas; travels, to pay tuition fee for institutions and can be used as an alternative where the standards of payment are online. The above depicts numerous ways can use bitcoins to settle their bills. The difference in value between the bitcoins and the traditional currency leads to individuals opting to use the bitcoins for exchange in cases or scenarios where a high exchange rate is noted, and alternatively, the opposite is exact. Chargebacks risk is reduced in the event of using bitcoins, therefore easing access to the broader market for traders. In the event of unlawful trades, both ends to ...
Palestine last event orientationfvgnh .pptxRaedMohamed3
An EFL lesson about the current events in Palestine. It is intended to be for intermediate students who wish to increase their listening skills through a short lesson in power point.
Model Attribute Check Company Auto PropertyCeline George
In Odoo, the multi-company feature allows you to manage multiple companies within a single Odoo database instance. Each company can have its own configurations while still sharing common resources such as products, customers, and suppliers.
Instructions for Submissions thorugh G- Classroom.pptxJheel Barad
This presentation provides a briefing on how to upload submissions and documents in Google Classroom. It was prepared as part of an orientation for new Sainik School in-service teacher trainees. As a training officer, my goal is to ensure that you are comfortable and proficient with this essential tool for managing assignments and fostering student engagement.
The Art Pastor's Guide to Sabbath | Steve ThomasonSteve Thomason
What is the purpose of the Sabbath Law in the Torah. It is interesting to compare how the context of the law shifts from Exodus to Deuteronomy. Who gets to rest, and why?
How to Make a Field invisible in Odoo 17Celine George
It is possible to hide or invisible some fields in odoo. Commonly using “invisible” attribute in the field definition to invisible the fields. This slide will show how to make a field invisible in odoo 17.
Unit 8 - Information and Communication Technology (Paper I).pdfThiyagu K
This slides describes the basic concepts of ICT, basics of Email, Emerging Technology and Digital Initiatives in Education. This presentations aligns with the UGC Paper I syllabus.
Read| The latest issue of The Challenger is here! We are thrilled to announce that our school paper has qualified for the NATIONAL SCHOOLS PRESS CONFERENCE (NSPC) 2024. Thank you for your unwavering support and trust. Dive into the stories that made us stand out!
httpswww.azed.govoelaselpsUse this to see the English Lang.docx
1. https://www.azed.gov/oelas/elps/
Use this to see the English Language Proficiency Standards of
Arizona-Pick a grade level
https://cms.azed.gov/home/GetDocumentFile?id=54de1d88aade
be14a87070f0
http://www.corestandards.org/ELA-Literacy/introduction/how-
to-read-the-standards/
how to read standards
Week 04
Acquisition and Customer Lifetime Value (CLV)
https://www.smh.com.au/politics/federal/nbn-customers-face-
higher-prices-or-poorer-internet-connection-audit-warns-
20190813-p52go7.html
Customer Relationship Management?
CRM is the process of carefully managing detailed information
about individual
customers and all customer touch points to maximize customer
loyalty.
Now closely associated with data warehousing and mining
2. Relationship
Relationship
Identifying good customers: RFM Model
Recency
Frequency
Monetary Value
Time/purchase occasions since the last purchase
Number of purchase occasions since first purchase
Amount spent since the first purchase
R
F
M
Total RFM Score: R Score + F score + M Score
CASE: Database for BookBinders Book Club
3. Predict response to a mailing for the book, Art History of
Florence, based on the
following variables accumulated in the database and the
responses to a test mailing:
f DIY books
Recency
Frequency
Monetary
Example: RFM Model Scoring Criteria
R
Months from last
purchase
13-max 10-12 7-9 3-6 0-2
Score 5pts 10 15 20 25
F
4. Frequency > 30 21-30 16-20 11-15 0-10
Score 25pts 20 15 10 5
M
Amount
purchased
> 400 301-400 201-300 101-
Score 50 45 30 15 10
Implement using Nested If statements in Excel
Decile Classification
• Standard Assessment Method
• Apply the results of approach and
calculate the “score” of each individual
• Order the customers based on “score”
from the highest to the lowest
• Divide into deciles
• Calculate profits per deciles
Customer 1 Score 1.00
Customer 2 Score 0.99
….
Customer 230 Score 0.92
Customer 2300 Score 0.00
6. Note: Market Potential = 4435 units and margin = $10.20
Leaky bucket
New customer
acquisition
Purchase increase by
current customers
Purchase decrease by
current customers
Lost customers
Lost customers
Credit Card Rewards Programs Have Had a
Direct Impact on Lowering Churn
Rewards Cards and Card Attrition
Reward Card
Penetration
Industry Attrition
Rate
%
o
10. “present value of a stream of revenue a customer produces”
Focus on long-term relationship, not a single transaction
relationship value
cost savings
price premium
demand increase
base profit
acquisition cost
Time
A
n
n
u
al
P
ro
fi
t
CLV: Customer Lifetime Value
Total Lifetime
11. Value of
Customer
Economic Value:
(Risk Adjusted) Revenue
Flow Less Cost-to-Serve
Relationship Value:
Reference
Referral
Learning
Innovation, etc.
Economic Lifetime Value Calculation
(Expected) Cost to Serve Cash Flow
Expected Profit Cash Flow
Risk Adjustment
Risk Adjusted Cash Flow
(minus)
Loyalty
(Expected) Revenue Cash Flow
12. CLV calculation (finite lifetime)
• Assume a few parameters re a customer
• She generates revenue, R and costs C amount of marketing,
support and
service each period. Then, her margin is (R - C) per each
period. Note that R
and C may change across periods.
• She has a probability of staying with the company, p, i.e.,
retention rate and
churn rate of (1-p).
• Discount rate is r and initial acquisition cost is AC.
• She stays with the company for the next N periods (e.g.,
years).
• Then, her CLV becomes
CLV calculation (Infinite lifetime)
• Assume that a customer stays with the company for an infinite
economic life, i.e., .
• Also assume that R and C are relatively fixed across periods.
• Then, her CLV becomes
13. Example CLV calculation
• Assume two customer segments
Frequent Buyer Occasional Buyer
Acquisition Cost (AC) $17.50 $17.50
Service Cost (C) $6 $2 (first period $6)
Revenue (R) $20 $16
Discount Rate (r) 10% 10%
Retention Rate (p) 75% 50%
Break-Even Analysis
Frequent buyers become profitable in two (2) years whereas
Occasional buyers become profitable in three (3) years
Period 1 2
Revenue $20 $20
Retention Rate 100% 75%
Service Cost $6 $6
Profit Margin $14.00 $10.50
Cumulative (net of AC) ($3.50) $7.00
16. − $17.50 −
$16 − $2
1 + 0.1
−
$16 − $6
1 + 0.1
= $2.2
• CLV analysis allows firms to understand the potential value of
customers and prompt firms to learn more about the patterns of
individuals or groups of customers. The firms can
• devise optimal strategies for each customer,
• eliminate wasteful costs,
• create a long-term perspective of potential relationship with
customers,
• tailor strategies to deal with different customer segments that
exhibit
differences in buying characteristics at any given time, and
• customize different strategies for the same customer
depending on the stage
of relationship between the customer and the firm.
Benefits of CLV analysis
• “Firing” Customers
• Raise prices for the less profitable products.
17. • Best customers typically outspend others considerably, with a
ratio of 15 to 1
in some industries.
• Rewarding Customers
• Discount vouchers or preferential services for best customers
• Identifying Cross-Selling Opportunities
• With detailed information about the interests and shopping
patterns
• Forecasting Innovation Value
• Understand the long-term profitability of an innovation
• CLV can be combined with product diffusion model
Strategic Implications of CLV analysis
Blue Ocean Strategy, if time permits
• Virgin Mobile Case (Workshops)
• Case report is due at 3pm on Friday, 23 August.
• Submit an electronic copy via Turnitin on UTSOnline
• NO Lecture unless demanded
Next week
Week 11 – Price Bundling
18. Company uses Bundles
Another Bundling: Season Tickets
•
Packages of banking and insurance products, e.g., “select” suite
of
products, Fidelity’s Cash Management & Brokerage accounts.
• Vacation package –
return airline ticket, rental car, & hotel room for
six nights
• Home‐delivered pizza (Pizza + delivery)
• Processor, hard disk and memory?
•
Not separate for end users, so it is not a bundle of products, but
a bundle of
components (see conjoint).
• Laptop plus carrying bag
Bundling examples
• Capitalize on cost efficiencies or economies of scale
• Use natural consumption complementarity
19. • Increase sales in the same transaction to customers
• Create switching costs
• Capitalize on locked‐in customers
• Create a powerful differentiator
Reasons for Bundling
• Bundling is the sale of two or more separate
products in a single
package
two main types:
(1) Price Bundling
(2) Product Bundling
Bundling?
• The integration and sale of two or more separate products or
services* at any price.
Integration provides at least some consumers with added value a
nd
often this value can be substantial
* Each product should have its own market independent of other
products in the bundle
What is Product Bundling?
20. • Product bundling creates added value
for consumers over and above the
additive value of bundled items
• Reduced risk (mutual funds instead of individual stocks)
• Non‐duplicating coverage (one‐stop insurance)
• Convenience
(one bill for a telephone plus internet plus cable TV plan)
• Seamless interaction (a suite of software applications)
Product Bundling
The sale of two or more separate products or services* in a pack
age
at a discount, without any integration of the products
* Each product or service must have its own market that is
independent of other items in the bundle
What is Price Bundling?
Pizza Delivery
• Price bundling does not create any added value for consumers
(beyond what is offered by items in the bundle)
• Reservation price* for the bundle = sum of the conditional
reservation prices** of the separate products in the bundle
• *Reservation price = consumer’s maximum willingness‐to‐pay
21. •
**Conditional reservation price = reservation price of the produ
ct,
conditional on the consumer buying the other product or product
s
• Six pack of beer, Combo meal, Season ticket
• What is the purpose of price bundling?
Price Bundling
Price vs. Product Bundling
Price bundling is primarily
a pricing and promotional
tool, product bundling is a
strategic marketing activity.
1
Price bundling can be
deployed easily, at short
notice, and for a short
duration
• Creative marketing activity to take
advantage of lower incremental
cost of sales
2
Product bundling is a long‐
term differentiation
strategy; often approached
from a new product
development perspective
22. 3
Forms of Price Bundling
Pure bundling: Only the
bundle is offered by the
firm. Products can’t be
purchased individually
•This approach is called “Tying”
•Basic cable package, magazine
01
Mixed bundling: Both
the bundle and the
individual products are
offered for sale. The
customer can choose
02
Unbundling: Only the
separate products are
offered, there is no
bundle
03
•
Price bundling enables to transfer consumer surplus from produ
ct A
to product B.
23. Economic Value of Price Bundling
WTP Product
A
WTP Product
B
Price for
products
A and B
CS Product A
WTP
A
Price
A> =
Purchase A
WTP
B
Price
B< =
No
Purchase B
WTP
A+B
Price
A+B> =
24. Purchase
A+B
•
Imagine a symphony orchestra that is preparing a short concert
series
with 2 programs (two different events). There are four potential
audience segments of equal size with different music tastes.
•
Evaluate the consequences of offering a single ticket for the con
cert
series either in addition to, or in place of, offering tickets for ea
ch
concert separately.
Concert Patron Problem
•
Assume one concert patron of each type (or equal segments of e
ach
type)
• What will happen if only separate tickets are offered?
•
Candidate prices to charge for each concert are $5, $20, $40, an
d $45
• Corresponding demands = 4, 3, 2, and 1 tickets per concert
• Revenue maximizing price = $40 (why?)
• Total revenue for the two concerts = $160
25. Unbundled Strategy: Offer Only Separate
Tickets
• What will happen if only combined ticket is offered?
•
Candidate prices to charge for combined ticket are $50 and $60
• Corresponding demands = 4 and 2 tickets
• Revenue maximizing price = $50 (why?)
• Total revenue for the two concerts = $200
• Selling a pure bundled ticket increases revenue ($160 vs $200)
Pure Bundled Strategy: Offer Only
Combined Ticket
•
This is the revenue maximizing strategy: Offer a ticket for the s
eries
($60) and single tickets for each concert at $45 (why?)
•
Revenue = $60 (Romantic) + $60 (Neo‐classical) + $45 (Tchaik
ovsky‐
lover) + $45 (Sophisticate) = $210 (vs $160 vs $200)
Mixed Bundled Strategy: Offer Combined
Ticket & Single Tickets
•
Unbundled pricing: If customers display similarity in their valu
ations
26. •
Pure price bundling: If market has two (or more) customer grou
ps
with dissimilar (negatively associated) component valuations
• In this case, bundling becomes “selective discounting”
• If the market is characterized by a combination of customers –
both
those with “extreme” preferences and those with “balanced”
preferences (seeing the products as equally valuable) – mixed
bundling is likely to be the best concept
• Single price is as high as those extreme’s WTP
Lessons from the Concert Patron Problem
Microsoft In‐class exercise
19
Suppose that Microsoft produces Word and Excel each at zero m
arginal cost
(but very high fixed costs). Further suppose that the demand for
these
products is characterized by five distinct and equal‐sized custo
mer segments as
described in the following table:
1) What are the optimal prices
for Microsoft to charge for
Word and Excel if it only sells
the two products
27. separately?
2) What is the optimal price for
Microsoft to charge for both
if it only sells the two in a
bundle?
3) What are the optimal prices
for a mixed bundling
strategy?
What if segment sizes are different?
Price bundling and Behavioral
Economics
21
•
Transaction decoupling: Match frequency of price presentation
and
payment to frequency of consumption
•
Backfiring effects from categorical reasoning: Be cautious when
combining bundles that have products or services of different va
lues.
The high‐value item will be devalued by the low‐value item if y
ou are
not careful.
28. • Partitioned pricing: Understand the pros and cons of offering
partitioned prices vs. all‐inclusive prices. Partitioning results in
under‐
estimation and focus on secondary differentiated features of the
product.
22
Price bundling and behavioral economics
Transaction Decoupling
Bundling price and payment leads to a dissociation or “decoupli
ng” of
transaction costs and benefits
• Reduces customer’s attention to sunk costs
•
Decreases the customer’s likelihood of consuming a paid‐for ser
vice
•
Potentially reduces the likelihood they will buy the product agai
n
Mary & Bill join a health‐club
•
Bill pays $1,200 for a year, billed and paid annually, Mary selec
ts the $100 per month
plan, billed and paid monthly.
•
Mary is more likely to use the membership, and more likely to r
enew.
29. 24Source: Gourville & Soman, HBR, September 2002
• Price bundling masks the individual item’s cost, reducing the
likelihood of its consumption at the correct time.
•
Season tickets “hide” the cost of individual tickets. Eventually,
less renewal.
•
People tend to consume products when awareness of price and t
he
“pain of payment” is top‐of‐mind.
• Customers’ perceptions of price determine their likelihood of
consuming paid‐for products. When people pay with credit card
s,
they’re less likely to remember the cost –
or consume the product. At
one theater, the no‐show rate for credit card customers was 10 ti
mes
that for cash customers.
Implication of Transaction Decoupling
Backfiring effects from categorical
reasoning
The Dieter’s Paradox
30. Random
assignment to one
of two groups
Estimate the
number of
calories you
consumed
Chernev
(2011). The Dieter’s Paradox, Journal of Consumer Psychology
The Dieter’s Paradox
Random
assignment to one
of two groups
711 calories
Chernev
(2011). The Dieter’s Paradox, Journal of Consumer Psychology
28
The Dieter’s Paradox
Random
assignment to one
of two groups
711 calories
31. 615 calories
Chernev
(2011). The Dieter’s Paradox, Journal of Consumer Psychology
29
Source: This discussion is from Chernev
(2011). The Dieter’s Paradox, Journal of Consumer Psychology
Chernev
(2011). The Dieter’s Paradox, Journal of Consumer Psychology
Price = $2,299 in each case
Key Takeaway: The popular pricing strategy of adding premium
s to make core products appear
more attractive can hurt rather than increase sales.
Source: Brough, Aaron and Alexander Chernev
(2012), “When Opposites Detract: Categorical Reasoning and S
ubtractive
Valuations of Product Combinations” Journal of Consumer Rese
arch (August)
How to Bundle Without Reducing Value
32. Avoid combining a
cheap item with an
expensive item and
promoting this mixed
package. People will
focus on the cheap item
which will drive bundle
value down.
1
If you are mixing
products with different
values, establish the
value of the individual
items first, and
emphasize the most
expensive one.
2
Take a lesson from
infomercial producers
and emphasize the
additive nature of
bundled items.
3
Focus on non‐price
attributes of the
product (e.g., durability
or comfort) . This will
reduce the devaluation
occurring from mixed‐
value items.
4
33. 1. Avoid combining cheap item with
premium item
2. Individual items first, emphasize the most
expensive one
3. Emphasize additive nature of bundles
38
39
40
41
Price Partitioning
Should the offered price be presented as an all‐inclusive price o
r a list of itemized
34. prices?
What is
Partitioned
pricing?
•
Partitioned pricing is the method of presenting the price to the
consumer as a list of mandatory charges attached to various feat
ures
of an offer.
• The alternative is to charge an “all‐inclusive” price
• Examples:
•
$34 for shirt + $5.95 shipping and handling vs. $39.95 (includes
free shipping)
•
$1,295 for Caribbean cruise + $140 mandatory port charges + $
560 for meal
plans VS. $1,995 all‐inclusive for the trip
• Distinction coincides partially with AYCE vs. à la carte
pricing
•
In à la carte pricing, consumer has the choice of whether to pick
additional
features (or stick with the base offer). In partitioned pricing, all
features are
mandatory, there is no choice
35. Partitioned Pricing
44
Source: TripBadger.com
Partitioned pricing: RESORT FEE
Source: TripAdvisor review of Grand Cayman Beach Resort by
Kendal UK on November 30, 2014
Partitioned pricing
Source: The Consumerist Guide to Understanding your Comcast
Bill
Partitioned pricing
Source: The Consumerist Guide to Understanding your Comcast
Bill
Partitioned pricing
Source: Ars Technica, January 31, 2018
36. All‐inclusive pricing
All‐inclusive prices
• Reasons for using all‐
inclusive pricing
• Simple
• Just one number to
communicate
• Facilitates consumer choice
• Increases consumer
satisfaction with pricing
Benefits of Partitioned prices
• What does the research say?
• Strategy increases demand for products (Morwitz et al. 1998)
•
Large proportion of consumers do not account fully for surcharg
es and
underestimate the total product cost
•
They anchor on the larger price item in the set and do not accou
nt for the
remaining smaller items
•
Breaking down an expense into separate components makes pric
37. ing more
transparent, enhancing perceptions of fairness, seller trustworthi
ness, and
likelihood of purchase (Xia and Monroe 2004)
•
It focuses consumer attention on secondary features of the offeri
ng (to which price
is attached), highlighting dimensions of differentiation
that may otherwise go
unnoticed (Bertini and Wathieu 2008)
Underestimation under partitioned pricing
Pricing
Method
Presentation
Format
Recalled
Price
All‐inclusive price $82.90 $83.90
Base price + surcharge in
dollars
$69.95 + $12.95 $80.36
Base price + surcharge in
percentage terms
$69.95 + 18.5% $75.43
38. Pricing
Method
Presentation
Format
All‐inclusive price $82.90
Base price + surcharge in
dollars
$69.95 + $12.95
Base price + surcharge in
percentage terms
$69.95 + 18.5%
• Case 5: Culinarian Cookware (18 Oct)
• Final case write‐up & summary
•
Final Executive Summary (20%, Due: 5pm Friday 25 Oct, 2019)
• Read Portfolio Summary Note instructions from UTSOnline.
Next weeks
Week 09 – Price Discovery
39. The Value Pricing Framework
Customer Value
Customer Value represents the
total amount of money that
the customer is willing to pay
for the benefits received from
the product.
1
Customer benefits are of two
types: Functional, the main
reason why the product was
purchased, and Hedonic or the
emotional benefits the
customer receives. Together,
they drive customer valuation
of the product or service.
2
Customer value usually sets
the ceiling or the highest
possible price that can be
charged for the product.
3
Functional and Hedonic Benefits
More likely to be related to costs
40. and to be considered in pricing
May cost very little yet customers
may be willing to pay a lot for
these benefits. Managers often
tend to ignore them
Value and Willingness‐To‐Pay
Mistake: Cost‐Plus Pricing
•
With a “cost‐plus” mentality these products appear to be over pr
iced. People value intangible benefits such as
comfort, speed, convenience and indulgence, and therefore are p
repared to pay significant amounts for it.
The 8 most ‘overpriced’ products?
Product characteristics on Customer Value
Market Research results
source: Simon‐Kucher Project Example
41. The Customer Value Grid
Survey‐based method
Step 1): Unbundle the product into its features
Step 2): Understand the hedonic and functional
benefits derived by customers from each product
feature
Step 3): Ask customers to quantify the benefits in
economic terms, that is, how much they are willing to
pay for each benefit
Step 4): Add the economic value of each benefit to
calculate the product’s total economic value to the
customer.
•
Answer the questions: What is the price that customers are willi
ng
to pay?
• Three methods
•
Conjoint Analysis (indirect method using tradeoffs between pric
e and other
attributes)
• Van Westendorp Price Sensitivity Meter (PSM)
• Becker DeGroot Marschak procedure
Price Discovery Methods
42. •
For all methods to answer the question: “What is the price that
customers are willing to pay?”
• Consider using the following best practices
• Choose respondents carefully –
requires careful prior segment definition &
target selection
•
Describe product concept in detail. If available, show the produ
ct and let
respondents try it or use it
•
Simulate the customer purchase decision as well as you can (e.g
., the
process, the use of reference prices)
• Try to make the procedure “incentive‐compatible” –
Respondents achieve
the best outcome by acting according to their true preference.
Price Discover Method: Best Practices
Van Westendorp Price Sensitivity Meter
(PSM)
Price discovery
•
43. Respondents are asked direct questions about the expected price
in
different contexts. The ‘real’ willingness‐to‐pay usually is close
to
what is considered to be an expensive price
• Example:
The Van Westndorp Price Sensitivity Meter
Set of four questions included as part of a concept test
1.
At what price do you begin to perceive the product as so expens
ive that
you would not consider buying it? (Too expensive)
2.
At what price do you begin to perceived the product as so inexp
ensive
that you would feel the quality cannot be very good? (Too inexp
ensive)
3.
At what price do you perceive that the product is beginning to g
et
expensive, so that it is not out of the question, but you would ha
ve to
give some thought to buying it? (Expensive)
4. At what price do you perceive the product to be a bargain –
a great buy
for the money? (Inexpensive)
44. The Van Westndorp Price Sensitivity Meter
The Van Westndorp Price Sensitivity Meter
Inexpensive Too Inexpensive
Expensive
The Indifference Price Point (IPP)
is the point at which an equal
number of respondents believe
the test product is expensive as
believe it is inexpensive
The Point of Marginal
Cheapness (PMC) is the point
at which an equal number of
respondents believe the
product is expensive as believe
it is too inexpensive
Too
Expensive
The Point of Marginal
Expensiveness (PME) is the point
at which an equal number of
respondents believe the test
product is too expensive as
believe it is inexpensive
The Optimal Price Point (OPP)
45. is the point at which an equal
number of respondents believe
the product is too expensive as
believe it is too inexpensive
• Van Westendorp
results can be used to calculate a ‘normal’ and
‘penetration’ price.
• Example:
Van Westndorp Price Sensitivity Meter ‐ Result
Van Westendorp PSM Interpretations
The IPP reflects either the
median price actually
paid by consumers
already in the market or
the price of the market
leader
1
The range of prices
between the PMC and
PME is the range of
acceptable prices. In well‐
established markets, few
competitive products will
be outside this range.
2
46. The OPP is the optimal
price that the seller
should set as
recommended by this
method
3
Steps in Conducting VWPSM Exercise
(see VWPSM Exercise.xlsx)
In Excel:
1) Use “countif” function
or
2) Insert ‘Pivot Table’
<Step 1. Data collection>
<Step 2. Count responses for each price category>
Steps in Conducting VWPSM Exercise
(see VWPSM Exercise.xlsx)
Total 104 responses.
Formula for $13
as TooInexpensive
=1‐1/104 = 0.9903846
Formula for $13
as TooExpensive
48. 1. Not based on sound behavioral theory –
it’s an applied procedure
2. Does not try to replicate the actual shopping process
(unlike conjoint
analysis)
3.
Results will depend on respondents’ experience with price level
s in the
market
4.
Concerns with asking customers directly regarding price. Focus
should be
on behavior, not price
5. Consumer‐defined prices may not
correspond with the actual range of
acceptable product prices from manager’s perspective
Problems with the Van Westendorp PSM
Some Notes
Van Westendorp notes: “A word of caution is in order: price
consciousness of this nature should never be equated with prope
nsity to
buy. One can be fully conscious that a product is “expensive” a
nd yet
prefer it over a cheaper alternative.”
49. MarketVision
Research notes: “Despite the concerns, the PSM remains a
simple method; it is both easy to execute and easy to understand
.
Although we never recommend the PSM as a method for definiti
vely
selecting the price of a product, it can be used as a tool for gaug
ing
consumers’ price perceptions and expectations.”
The Becker‐DeGroot‐Marschak Procedure
(BDM)
Price Discovery
•
Widely employed incentive compatible mechanism used to elicit
consumer’s willingness‐to‐pay
• Step 1: Show product and inform consumer of distribution of
prices at which product may be purchased
• Step 2: Consumer indicates a reservation price for product
• Step 3: Price drawn from announced distribution, termed
“realized price”
•
Step 4: If the reservation price is higher than realized price, the
y
obtain the product and pays realized price, otherwise they walk
away.
50. Becker‐DeGroot‐Marschak (BDM) Procedure
BDM – Step 1
“You will now have a chance to buy a bar of Valrhona
Noir Extra Amer 85% Cacao chocolate bar.
To determine its price, we will use the BDM procedure.
You will have one chance to pick a price that you are
willing to pay.
After you have indicated this price, a random number
generator will produce a price with the following
distribution:”
•
You can choose any distribution but it should be clearly explain
ed to
the consumer. Normal and Uniform distributions are commonly
used.
• How will you pick? Range?
BDM – Picking a distribution
a b
Normal distribution Uniform distribution
•
Consumer picks the maximum price they are willing to pay (to
maximize
51. the chance of getting the product)
• The random number is then drawn.
“If the number you chose is higher than or equal to the number
generated
from this distribution, you will get the bar of chocolate and pay
the amount
equal to the random number.
If the number you chose is lower than the number generated fro
m this
distribution, you will not get the chocolate and pay nothing.
Note that the BDM procedure is such that your best response is
to write
down the maximum amount you are willing to pay for the choco
late – not a
penny more, and not a penny less.”
BDM – Steps 2 and 3
Conjoint Analysis – We Know it!!!
See Week 6 lecture and workshop for detail
•
Another important property of Customer Value is that it is not st
able
•
It changes in predictable ways that should guide pricing decisio
ns
•
Understanding when customer value increases and the triggers o
f
value increase provides useful information for effective pricing
52. decisions
Instability of Customer Value
Demand for Chocolate
When would it make sense to charge high prices?
And to offer discounts?
Demand for Chocolate
Coupons
Demand for Chocolate
High/Full
Prices
•
Manage price levels using a pricing structure so that they coinci
de
with predictable shifts in customer value.
•
Identify value triggers of customers. What makes value go up an
d
down? Minimize incentives during periods of high value.
53. Key Insights
• Case 4: SafeBlend Fracturing (4 Oct)
• B2B pricing
• Submit case report before due (please submit early!!!)
• Lecture & Workshop (11 Oct)
• Price bundling
• Lecture wrap‐up
• Case 5: Culinarian Cookware (18 Oct)
• Final case write‐up & summary
•
Final Executive Summary (20%, Due: 5pm Friday 25 Oct, 2019)
• Read Portfolio Summary Note instructions from UTSOnline.
Next weeks
Week 02
Pricing Methods
https://www.abc.net.au/news/2019‐07‐
30/how‐online‐food‐deliver‐reshaped‐
the‐restaurant‐market/11363332
•
54. Have a chat with each other to decide whether this phenomenon
provides restaurants good potential or doom.
•
Use your mobile phone or laptop to access www.zeetings.com/k
kwak
•
Select your answer. You can only select one answer. Please hav
e a
comprehensive thought before selecting your answer.
• You can have a chat with each other.
•
Once you submit, you may be able to say your reason of selectio
n in
‘activity’.
Good or Bad?
Today’s topics
• Cost‐plus pricing
• Value‐based pricing
Cost‐Based Pricing
•
It is widely criticized, but is still, by far, the most commonly us
ed
pricing method.
• 75% of restaurants use it, 60% of manufacturers.
•
55. Retailers commonly use “double markup” adding margin of 100
% on their
wholesale cost.
•
Restaurants have established benchmarks, 2X for food, 5X for li
quor, and so
on.
•
The logic of cost‐based pricing is simple: Price every product to
deliver a fair return over costs, fully and fairly allocated.
Cost‐Based Pricing Example
•
ABC Navigation Systems has a contract to supply the US Air Fo
rce with
advanced aircraft navigational equipment. Under contract terms,
price of each navigational unit to be paid by the USAF is calcul
ated as
follows:
• Variable cost (labor, components, electricity, etc.) = $10,000
•
Allocated fixed costs (salaries, insurance, R&D, building heat,
debt service,
maintenance, etc.) = $8,000
• Contract guarantees 15 percent profit
• Unit price = ($10,000 + $8,000) * (1 + 0.15) = $20,700
56. Break‐even point (volume)
��������� ������
����� ����
����� �������� ����
Cost‐Plus Pricing in Distribution Channels
Manufacturer’s price = $10.00
Cost to acquire: $10.00
Markup: $2 (20%)
Wholesale Price = $12.00
Cost to acquire: $12.00
Markup: $12 (100%)
Retail Price = $24.00
Consumers
Retailer
Wholesaler
Manufacturer
Advantages of Cost‐Based Pricing
It is simple. Line
57. employees can
implement it with
moderate training.
1
It is easy to explain and
justify. This pricing
method can be
described and defended
easily to employees and
customers.
2
It stabilizes market
prices. When all
competitors have similar
cost structures, and use
it, prices remain stable.
3
It encourages customers
to focus on quality.
Prices tend to correlate
to quality.
4
Source: Dholakia, When cost‐plus pricing is a good idea, Harvar
d Business Review, 2018
Weakness of Cost‐Based Pricing
It encourages inefficiency.
There is a disincentive to
58. be efficient and to lower
costs. Reducing costs will
decrease revenues and
total profits.
1
It ignores customer value
and reference prices. This
can be dangerous, because
it can either results in
prices no one is willing to
pay, or leave a lot of
money on the table.
2
It creates a false sense of
complacency. Managers
think they cannot lose
money when they use
cost‐based pricing, which
is not the case.
3
Source: Dholakia, When cost‐plus pricing is a good idea, Harvar
d Business Review, 2018
Problems with Cost‐Plus Pricing
•
In most industries, it is impossible to determine a product’s unit
cost
before determining its price
59. • Unit costs are dependent on volume!
• Wang Laboratory case
•
Introduced in 1976, word processor was very successful. By mid
‐1980s, PCs became
viable competitors. As competition increased and growth slowed
, cost‐driven pricing
strategy accelerated the Wang’s decline
• Price affects sales volume, sales volume affects costs
Price Sales
Cost‐Plus Pricing in Strong Markets
•
Cost‐based price serves as a cap on price if it can be easily achi
eved
• Toyota Prius launch case‐study
•
In June 2004, the backlog for 2004 Toyota Prius reached 22,000
in the US.
•
As of April 2004, the expected delivery time for Prius in the Ne
therlands was
one year.
•
As of March 2004, the waiting list at a Sonoma County, Califor
nia dealership
was over 100 people long
60. •
Price at the time: MSRP = $19,995, Invoice = $18,411; Dealer p
riced $6 to $8K
higher (“fair market adjustment”)
• How about BTS concert tickets? Holiday bestseller toys?
https://www.youtube.com/watch?v=YVVRMRRxGGg
Source: Forget Rebates: The Hybrid‐Car Markup, by Sholnn
Freeman, WSJ, June 10, 2004
Cost‐Plus Pricing
•
Leads to over‐pricing in weak markets and underpricing in stron
g
ones
•
Cost‐based price still does not provide a guarantee of covering f
ixed
costs
• The underlying logic is flawed
•
But most importantly, firm can do better with other pricing strat
egies
Source: Dholakia, When cost‐plus pricing is a good idea, Harvar
d Business Review, 2018
The Value Pricing Framework
61. Source: Dholakia, How to price effectively, 2017
Customer Value
•
Customer Value is the total amount of money that the customer
is
willing to pay for the benefits received from the product.
•
For pricing, each customer benefit should be equated to dollars
and
cents that customers are willing to pay (WTP) for it.
•
Benefit 1 + Benefit 2 + ….. = WTP 1 + WTP 2 + … = Total WT
P
•
Customer value sets the ceiling or the highest possible price tha
t can
be charged for the product.
•
Understanding customer value requires an understanding of the
types and number of benefits customers receive from the produc
t
and the product/ service features that contribute.
Source: Dholakia, How to price effectively, 2017
Sell me this pen!
62. Value‐Based Pricing
Source: Dholakia, How to price effectively, 2017
1. Identify the target customer
2. Determine competitive offers & the focal competitor
3. Conduct head‐to‐head comparison
4. Identify differentiators & deficiencies
5. Assess their economic value
6. Calculate the value‐based price
• Product: Listing a vacation rental house on a beach to rent on
Airbnb.com by the week. What should its price be?
Value‐based Pricing: Vacation Rental
Sources: How to price effectively, Chapter 10; The 1%
Solution
, Rafi Mohammed
• Product: Listing a vacation rental house on a beach to rent on
63. airbnb.com by the week. What should its price be?
• Step 1: Identify target customers. Vacationers. Airbnb users.
Value‐Based Pricing: Vacation Rental
Sources: How to price effectively, Chapter 10; The 1%