SlideShare a Scribd company logo
1 of 72
http://fmx.sagepub.com
Field Methods
DOI: 10.1177/1525822X04269550
2005; 17; 30 Field Methods
Don A. Dillman and Leah Melani Christian
Survey Mode as a Source of Instability in Responses across
Surveys
http://fmx.sagepub.com/cgi/content/abstract/17/1/30
The online version of this article can be found at:
Published by:
http://www.sagepublications.com
can be found at:Field Methods Additional services and
information for
http://fmx.sagepub.com/cgi/alerts Email Alerts:
http://fmx.sagepub.com/subscriptions Subscriptions:
http://www.sagepub.com/journalsReprints.navReprints:
http://www.sagepub.com/journalsPermissions.navPermissions:
http://fmx.sagepub.com/cgi/content/refs/17/1/30 Citations
at SAGE Publications on September 9, 2009
http://fmx.sagepub.comDownloaded from
http://fmx.sagepub.com/cgi/alerts
http://fmx.sagepub.com/subscriptions
http://www.sagepub.com/journalsReprints.nav
http://www.sagepub.com/journalsPermissions.nav
http://fmx.sagepub.com/cgi/content/refs/17/1/30
http://fmx.sagepub.com
10.1177/1525822X04269550FIELD METHODSDillman,
Christian / SURVEY MODE AS SOURCE OF INSTABILITY
Survey Mode as a Source of Instability
in Responses across Surveys
DON A. DILLMAN
LEAH MELANI CHRISTIAN
Washington State University
Changes in survey mode for conducting panel surveys may
contribute significantly to
survey error. This article explores the causes and consequences
of such changes in
survey mode. The authors describe how and why the choice of
survey mode often
causes changes to be made to the wording of questions, as well
as the reasons that
identically worded questions often produce different answers
when administered
through different modes. The authors provide evidence that
answers may change as a
result of different visual layouts for otherwise identical
questions and suggest ways
to keep measurement the same despite changes in survey mode.
Keywords: survey mode; questionnaire; panel survey;
measurement; survey error
Most panel studies require measurement of the same variables at
different
times. Often, participants are asked questions, several days,
weeks, months,
or years apart to measure change in some characteristics of
interest to the
investigation. These characteristics might include political
attitudes, satis-
faction with a health care provider, frequency of a behavior,
ownership of
financial resources, or level of educational attainment.
Whatever the charac-
teristic of interest, it is important that the question used to
ascertain it perform
the same across multiple data collections.
In addition, declining survey response rates, particularly for
telephone
surveys, have encouraged researchers to use multiple modes of
data collec-
tion during the administration of a single cross-sectional
survey. Encouraged
by the availability of more survey modes than in the past and
evidence that a
change in modes produces higher response rates (Dillman
2002), surveyors
This is a revision of a paper presented at the Workshop on
Stability of Methods for Collecting,
Analyzing and Managing Panel Data, American Academy of
Arts and Sciences, Cambridge,
Massachusetts, March 26–28, 2003. This research was financed
in part by funds provided to
Washington State University under a Cooperative Agreement
with the USDA-National Agricul-
tural Statistics Service supported by the National Science
Foundation Division of Science
Resource Statistics.
Field Methods, Vol. 17, No. 1, February 2005 30–52
DOI: 10.1177/1525822X04269550
© 2005 Sage Publications
30
at SAGE Publications on September 9, 2009
http://fmx.sagepub.comDownloaded from
http://fmx.sagepub.com
are increasingly using mixed-mode methods to collect
information from
their respondents.
Considerable evidence now exists that the choice of survey
mode affects
respondents’ answers to survey questions that are worded the
same (e.g., de
Leeuw and Van Der Zowen 1988; Dillman et al. 1996; Fowler,
Roman, and
Di 1998). This means that differences in answers to some
survey questions
between Time 1 and Time 2 may be the result of mode change
rather than an
actual difference in the behavior or opinion of interest. In
addition, Internet
and Interactive Voice Response (voice or touchtone data entry
by telephone
in response to prerecorded interview questions and instructions,
hereafter IVR)
modes of collecting data are now taking their places beside the
traditional
alternatives of mail, telephone, face-to-face, and group self-
administration
modes. Both of these new methodologies introduce the
possibility of mode
effects that are not yet well understood.
Our purpose in this article is to discuss why mode changes are
increas-
ingly likely to occur in panel studies and the consequences of
those changes.
We review the nature of likely mode differences and the reasons
for their
occurrence and make suggestions for how differences in
answers between
modes might be reduced. In addition, we present evidence that
suggests that
within-mode differences may result from variations in the visual
layout of
questions used in both mail and Web surveys. Such changes
may also have an
impact on comparisons between visual and aural modes of
surveying.
WHY MODE OF DATA COLLECTION
OFTEN CHANGES
Mode change happens frequently in panel studies after the
initial wave of
data collection. Decisions to change mode are often made with
little consid-
eration of whether such changes might influence substantive
answers to the
survey questions. Several reasons may explain the desire to
switch modes for
subsequent data collections.
First, the locations of panel respondents often change between
data col-
lections. Some panel surveys extend over many years, or even
decades. For
example, students who initially responded to a paper survey in a
classroom
cannot easily be reassembled several years later for follow-up
contacts.
Thus, the researchers may decide to survey those respondents by
telephone at
their new locations. Whereas group administration may be the
most cost-
effective procedure for the initial wave of data collection, the
telephone is
likely to be far more efficient for the follow-up. Also, when
surveying young
people, a face-to-face interview or classroom setting may be the
most appro-
Dillman, Christian / SURVEY MODE AS SOURCE OF
INSTABILITY 31
at SAGE Publications on September 9, 2009
http://fmx.sagepub.comDownloaded from
http://fmx.sagepub.com
priate survey environment, but as people age they may be better
surveyed
using postal mail or the Internet.
In addition, the introduction of new modes creates new
possibilities for
conducting surveys. Specifically, the emergence in the 1990s of
Internet and
IVR provide more ways of contacting and surveying
respondents. In many
cases, these modes offer substantial cost and speed advantages
and may not
have been available at the time of initial data collection.
Furthermore, when follow-up studies are done, researchers may
have
either telephone numbers or mailing address information, but
not both, so
that the method of follow-up is influenced by the kind of
contact information
available. Traditional contact information (i.e., postal addresses
and home
telephones) has now expanded to include e-mail addresses and
cell phone
numbers.
In recent years, response rates to traditional modes of
surveying, in partic-
ular the telephone, appear to be declining. As a result, surveyors
have
become interested in providing panel members choices so
respondents can
decide whether to respond by one mode or another. This
possibility is
encouraged by technological advances, which allow efficient
transfer of
questionnaire word files from one mode to another. Moreover,
the particu-
larly low marginal costs of collecting additional questionnaire
responses
over the Internet are encouraging surveyors to collect as many
responses in
this manner as possible, saving telephone interviews for those
who do not
respond.
The mode choice for follow-up surveys can often be less
restrictive. The
coverage and/or sampling procedure constraints necessary for
initial data
collection may determine the mode of surveying. Household
personal inter-
view methods are often used for initial data collection because
it is necessary
to identify truly representative samples of general public
populations. For
example, the monthly U.S. Current Population Survey, which is
relied on to
estimate nationwide unemployment rates, depends on the use of
face-to-face
interviews to contact households and conduct the initial
interviews. This sur-
vey then switches to telephone interviews for households with
telephones to
reduce costs.
And the influence of the personal preferences of researchers on
choosing
the follow-up survey mode often makes a difference.
Researchers may have
little experience with particular modes resulting in a higher
comfort level for
some survey modes than for others. Also, some organizations
have a tradi-
tion of doing telephone surveys, whereas other firms have a
tradition of
working with self-administered methods and choose modes
based on their
skills and infrastructure. Firm specialization is increasing as
new firms
emerge that only do Internet or IVR surveys. Some researchers,
who desire to
32 FIELD METHODS
at SAGE Publications on September 9, 2009
http://fmx.sagepub.comDownloaded from
http://fmx.sagepub.com
stay on the cutting-edge methodologically, may also choose a
new mode in
hopes of making a methodological contribution to panel
research methods.
In recent years, another kind of mode change has emerged,
which may
create even more complex mode comparison issues. Instead of
only chang-
ing modes between data collections, surveyors sometimes
design individual
data-collection efforts that use one mode for some respondents
and others for
the remaining respondents. An example of this strategy is the
National Sur-
vey of Earned Graduates, for which data-collection procedures
were tested in
1992 (Shettle and Mooney 1999). It began with mail, switched
to telephone,
and finally relied on face-to-face interviews, each of which
added a signifi-
cant amount to response rates. Modes were similarly mixed in
later data col-
lections. Thus, not only do some respondents answer by
different modes in
the initial data collection period than in other periods, the
potential also exists
for respondents to answer using a variety of modes during later
data
collections.
Intramode differences within data-collection periods may be
increasing
(Dillman 2002). One reason is the concern that the response
rates are lower
for some modes than in the past and offering a second mode
may help
improve them. Another contributor is the widely different costs
associated
with modes of data collection. For example, if respondents can
now be
induced to go directly to the Internet, the marginal costs for
each additional
interview completed in that way may be far less than for any of
the other
methods. Whereas the costs of providing the opportunity to
respond by more
than one mode was once substantial, computer software now
makes such
efforts much less difficult and costly.
Thus, a variety of reasons, ranging from personal preferences
and the
changing nature of the available mode choices to cost
considerations, may
influence decisions by investigators to switch modes either
between or
within data collections periods. In addition, changing modes has
often been
viewed as a minor consideration for deciding how to collect
data for panel
studies. However, this position needs to be reevaluated. In some
instances,
changing modes may produce results that provide a false
indication of
change having occurred between waves of data collection.
HOW SURVEY MODE AFFECTS
THE WORDING OF QUESTIONS
Surprisingly, one of the main reasons for differences in answers
to ques-
tions when the survey mode is changed is that each mode
encourages survey-
Dillman, Christian / SURVEY MODE AS SOURCE OF
INSTABILITY 33
at SAGE Publications on September 9, 2009
http://fmx.sagepub.comDownloaded from
http://fmx.sagepub.com
ors to ask questions differently. There are various ways in
which question
wording is shaped by each survey mode.
Face-to-Face Interviews
The face-to-face interview is quite flexible, providing the
potential to
make full use of both visual and aural communication.
Researchers who rely
on face-to-face procedures are able to use long, complex scales,
with word
labels for each of the categories or scale points. To
accommodate long ques-
tions with many answer choices, show cards are typically used
where respon-
dents are handed a card with answer choices and asked to
choose a category
after the interviewer reads the question.
Face-to-face interviews also encourage the use of longer
questionnaires
because once begun, it is often difficult for respondents to
terminate the inter-
view. The use of open-ended questions for which interviewers
can follow-up
with additional probes in order to gather more complete and
interpretable
answers is also encouraged for this survey mode. The presence
of an inter-
viewer who can read body language as well as respond to
silences and incom-
plete answers makes it possible to obtain long, complete
answers.
Telephone Interviews
The advent of telephone interviewing in the 1970s produced
significant
changes in how researchers composed questions. To simplify
the interview
task, scales were shortened and the wording was frequently
limited to
anchored endpoints rather than providing a word description for
each cate-
gory. Thus, a question that might have been asked in a face-to-
face interview
using a fully labeled scale with response choices of not at all
satisfied,
slightly satisfied, somewhat satisfied, mostly satisfied, and
completely satis-
fied would be changed to a 1 to 5 scale, with “the endpoints of 1
being not at
all satisfied and 5 being completed satisfied and you can also
use any number
in between” (Dillman et al. 2001).
Complex questions with longer scales are sometimes divided
into steps
for telephone surveys (Miller 1984). For example, respondents
were first
asked if they were satisfied, dissatisfied, or somewhere in the
middle. Then a
follow-up probe for the satisfied and dissatisfied respondents
asked whether
they were completely, mostly, or somewhat satisfied (or
dissatisfied). Those
in the middle were asked whether they were closer to being
satisfied, dissatis-
fied, or right in the middle. Similarly, respondents might be
asked whether
their income was above or below a given amount, and then
asked repeatedly
with different amounts to allow the income level to be measured
with
reasonable precision.
34 FIELD METHODS
at SAGE Publications on September 9, 2009
http://fmx.sagepub.comDownloaded from
http://fmx.sagepub.com
The need to simplify questions for the telephone also led to an
increase in
the use of screen questions from which the respondent branched
different
ways depending on their answer. This procedure allowed less
information to
be communicated in each interviewer utterance, and the
respondent was
unaware of the extensive and complex branching patterns that
resulted.
When telephone questionnaire programmers encounter questions
with many
words and/or answer choices, they often break them into smaller
parts so
respondents can skip past unnecessary information. The
compelling reason
for seeking question simplification on the telephone is the
reliance entirely
on aural communication.
The use of telephone interviews also places pressure on
researchers to
shorten their interviews. Twenty minutes is deemed a long
interview for most
telephone studies but not for face-to-face interviews. For
example, one
national survey organization has a policy of not conducting
telephone sur-
veys that are more than eighteen minutes long.
Telephone interviews are also quite similar to face-to-face
interviews in
certain respects. One important similarity is that both interview
methods rely
on aural communication. Open-ended questions can be asked in
telephone
interviews, just as in face-to-face interviews, with follow-up
probes being
used to get interpretable answers. Both the telephone and face-
to-face meth-
ods also tend to hide the possibility of certain answers (e.g., “no
opinion” or
“don’t know” categories) from respondents but instead allow the
interviewer
to record such answers only when offered by the respondent.
Refusals to
answer may also be recorded as a separate category.
Interactive Voice Response Surveys
IVR surveys may use voice technology to recognize spoken
answers or
require the respondent to enter data using numbers and/or
symbols on the
telephone’s touchtone keypad (Dillman 2000; Tourangeau,
Steiger, and Wil-
son 2002). This mode is used with increasing frequency for very
brief routine
surveys where respondents are highly motivated to respond
(e.g., certain
employee and customer satisfaction surveys). It has even been
tested for pos-
sible use as an alternative to the 2010 Decennial Census mail-
back form
(Stapleton, Norris, and Brady 2003).
The early use of IVR surveys has witnessed efforts to make
question
wording brief, even shorter than in regular telephone surveys.
Researchers
also seem to be attempting to reduce the lengths of scales, and
keep question-
naires extremely short. In addition, prerecorded instructions on
what the
respondent should do if he or she wants to have an item reread,
and to
Dillman, Christian / SURVEY MODE AS SOURCE OF
INSTABILITY 35
at SAGE Publications on September 9, 2009
http://fmx.sagepub.comDownloaded from
http://fmx.sagepub.com
solve other potential problems, must be developed along with a
protocol for
their use.
Mail Surveys
The use of mail surveys has encouraged respondents to write
questions in
ways that differ from the construction practices for both face-
to-face and
telephone interviews (Dillman 1978). Many users try to avoid as
many
branching questions as possible because respondents are prone
to making
errors when attempting to follow branching instructions
(Redline et al.
2003). Thus, instead of asking a series of questions, such as
“Do you own or
rent a home?” followed by “Do you have a mortgage on this
home, or is it
owned free and clear?” a mail survey question is likely to ask
the question in
this manner: “Is the home in which you live: (1) owned free and
clear, (2)
owned with a mortgage, (3) rented, or (4) occupied under some
other
arrangement?”
The self-administered nature of mail surveys also encourages
researchers
to use check-all-that-apply questions, rather than asking for a
yes or no
answer to each of many items on a list as done for interview
surveys. Check-
all formats are likely to produce fewer affirmative answers than
are the yes/
no formats (Rasinski, Mingay, and Bradburn 1994; Dillman et
al. 2003).
Mail surveys also remove the pressures to shorten questions that
are com-
mon in telephone surveying. Fully labeled scales with many
categories, simi-
lar to those used in face-to-face interviews and displayed as
show cards, can
be used with equal ease in self-administered mail surveys.
In addition, users of mail surveys are often discouraged from
asking open-
ended questions because of the inability to encourage more
complete answers
by probing or asking additional follow-up questions. This
concern often
leads to breaking individual open-ended questions into multiple
parts. For
example, an interviewer can ask for one’s occupation and then
probe for
enough details to allow for coding. On mail questionnaires,
designers may
feel compelled to ask a series of questions (e.g., “What is your
occupation?
What kind of work do you do? Is there a minimal educational
requirement?
What is the name of the company for which you work?”). Thus,
the mail ver-
sion tends to explicitly seek information that may or may not
have been
offered as responses in the open-ended version.
Similarly, the use of mail questionnaires also requires that
researchers
decide what to do with the typically hidden interview categories
(i.e.,
Refused, Don’t Know, No Opinion, or Does Not Apply that are
available for
use by telephone interview but are not offered to the respondent
as part of the
question stimulus). Frequently, such categories are left off the
mail question-
36 FIELD METHODS
at SAGE Publications on September 9, 2009
http://fmx.sagepub.comDownloaded from
http://fmx.sagepub.com
naire, resulting in respondents skipping the question or leaving
it blank in the
self-administered survey mode. Alternatively, they may be
explicitly listed.
Either method changes the stimulus from what is typically
provided in
telephone or face-to-face interviews.
The reliance of mail surveys on visual communication provides
a means
by which respondents can interpret context and review
previously read ques-
tions while formulating an answer to later questions. Thus, in
certain ways
self-administered questionnaires make possible the
communication of greater
complexity than telephone surveys. At the same time, order
effects fre-
quently observed in telephone surveys may be reduced (Bishop
et al. 1988).
Internet Surveys
Internet surveys also rely on the use of visual instead of aural
communica-
tion used in interview surveys. Some similarities exist in how
questions are
constructed for mail and Internet, but important differences also
exist. One
difference is that Internet surveys allow the use of audio, video,
color, and
other dynamic features, which are generally not used in other
types of
surveys.
Internet surveys can be programmed using a page-by-page
construction
whereby each question is displayed on a different screen or a
scrollable dis-
play where respondents can scroll through all the questions at
once. One of
the potential difficulties of using separate screens for each
question is a loss
of context that is provided in mail surveys because respondents
cannot
review previous answers and survey designers may wish to keep
respondents
from being able to go back and change answers to previous
questions. How-
ever, the inability to go backward may result in respondents
getting mentally
lost in a closely related series of items (e.g., a series of
questions asking about
each job held since graduating from college).
Check-all-that-apply questions are also used frequently in
Internet sur-
veys. HTML programming that is employed to construct
Internet surveys
allows two types of answer category formats to be specified: a
set of radio
buttons that lets only one choice be marked or HTML boxes that
let more
than one answer from each group be marked. Check-all-that-
apply formats
are awkward to ask in an interview and, as noted earlier, are not
used in tele-
phone surveys. Instead, they are converted to a series of yes/no
items, which
are likely to result in an increase in the selection of individual
items over the
check-all-that-apply format (Dillman et al. 2003). Furthermore,
Internet sur-
veys also allow the use of longer scales with full labeling, as is
normally done
in mail and face-to-face surveys.
Dillman, Christian / SURVEY MODE AS SOURCE OF
INSTABILITY 37
at SAGE Publications on September 9, 2009
http://fmx.sagepub.comDownloaded from
http://fmx.sagepub.com
Branching instructions do not present a significant problem for
Web sur-
veys inasmuch as when page-by-page construction is used,
branching
becomes transparent to respondents, much as it is on interview
surveys.
Internet surveys are also similar to telephone surveys in that
longer surveys
are typically discouraged and not likely to be tolerated by many
respondents.
Another similarity to telephone interviews is that item
nonresponse, which
represents a major concern in mail surveys, can be overcome by
program-
ming that requires each question to be answered. However, a
consequence of
this programming may be that it produces respondent frustration
and fewer
completions (Dillman 2000).
WHY RESEARCHERS OFTEN
CHANGE QUESTION STRUCTURES FOR
FOLLOW-UP MEASUREMENT BY A DIFFERENT MODE
It is desirable to keep question wording the same across modes.
Yet,
changes are often made. Some of them are quite simple, even
accidental. For
example, an open-ended question was asked in a large-scale
national tele-
phone survey, “What is your current marital status?” where
interviewers
were instructed to check the appropriate category based on the
response pro-
vided. This question was changed for a Web survey so that
respondents
chose either: “single, married, separated, divorced, or
widowed.” The result
was to significantly decrease the number of single and married
respondents
while increasing the percentage that were separated, divorced,
and widowed
Robert Tortora, personal communication, May 9, 2002). The
simple expla-
nation is that some respondents may fit appropriately into more
than one cat-
egory but tend to simplify their response (single or married)
unless the addi-
tional detail of separated, divorced, or widowed is explicitly
offered.
Survey designers may change question structure between rounds
of data
collection in panel studies simply because of a mode change.
These changes
may occur because of the belief that a different question format
will work
better for the new survey mode. For example, check-all-that-
apply formats
used in self-administered questionnaires are frequently
converted to a series
of yes/no items in telephone interviews because the check-all
format is awk-
ward if not impossible to ask over the telephone. However, as
we discussed
earlier, these two formats produce quite different response
distributions
when asked in self-administered questionnaires.
These changes in question structure may happen because a
preferred
mode of constructing survey questions has evolved for each of
the different
modes and tends to be shared across organizations. Thus, when
questions are
38 FIELD METHODS
at SAGE Publications on September 9, 2009
http://fmx.sagepub.comDownloaded from
http://fmx.sagepub.com
designed, especially in large organizations in which there are
specialized
units for telephone, face-to-face, Web, mail, and IVR data
collection, each
unit may have developed a style of question design that they
feel is best for
their mode. Telephone questionnaire designers are especially
sensitive to the
problems of length and verbal comprehension. Mail
questionnaire designers
are especially sensitive to the problems of getting respondents
to follow
branching instructions. And those who implement particular
modes tend to
want to avoid situations in which their mode does not perform
well.
When designing questions for single mode studies, possible
differences
across mode are rarely discussed. Surveyors who have learned
over the years
to design for one mode may find it difficult to accept the need
to optimize
across modes, rather than to maximize efficacy for their own
mode. The
argument that “this is how telephone (or mail or face-to-face)
questions are
usually written” often becomes a powerful force when designing
survey
instruments, and sponsors of panel surveys are often unaware of
these
consequences.
WHY IDENTICALLY WORDED QUESTIONS OFTEN
PRODUCE DIFFERENT ANSWERS ACROSS MODES
Even if one succeeds in maintaining the same questionnaire
stimulus
across survey modes, differences in answers may occur.
However, mode dif-
ferences for identically worded questions are more likely to
occur for some
types of questions than others. In addition, there are a number
of likely causes
for these mode differences.
Some Questions Are More Subject to Instability
across Modes than Are Others
Schwarz (1996) argued that the survey process is governed by
the conduct
of conversation that is used in everyday life and as such
respondents act as
cooperative communicators trying to make sense of the
information pro-
vided to them. The interview or questionnaire exhibits many of
the same
characteristics as a conversation in which the meaning assigned
to later items
is based on earlier information being transmitted between the
respondent and
questionnaire sponsor (Schwarz 1996). Thus, respondents
actively try to
make sense of the survey questions by drawing on all the
information the
researcher provides, including the context of the survey.
Respondents will
systematically make use of context information on some
questions more so
than others.
Dillman, Christian / SURVEY MODE AS SOURCE OF
INSTABILITY 39
at SAGE Publications on September 9, 2009
http://fmx.sagepub.comDownloaded from
http://fmx.sagepub.com
When respondents are asked an opinion question such as “How
satisfied
are you with your choice of careers?” they are being asked a
question for
which a ready-made answer may not exist. In addition,
surveyors are likely to
offer a set of vaguely quantified response categories from which
to choose
(e.g., “Completely satisfied, Mostly satisfied, Fairly satisfied,
Slightly satis-
fied, Not satisfied”). To answer these questions, the respondent
must think
about how to respond to the question, including trying to figure
out the mean-
ing of the response categories to determine the answer that
comes closest to
expressing their opinion. Thus, the stem of the question and the
response cat-
egories are important sources of information for respondents,
especially
when they are answering questions to which they may have not
previously
formed an answer.
In addition, for ordinal scales in which respondents must choose
where
they fit along an implied continuum, the response categories
become very
important cues in helping respondents decide how to answer the
question. In
these types of scalar questions, the meaning of the individual
categories (e.g.,
fairly satisfied) comes in part from the order in which the
choices are dis-
played or read to the respondent. Thus, respondents draw on
information
provided in the description of the category (verbal or numeric
labels) and its
position in relation to other categories.
CONTEXT AND ORDER EFFECTS
Since respondents are actively making sense of the survey or
interview,
they may also be affected by the order in which questions are
presented. In
panel studies, new questions are often added to follow-up
surveys to ask
respondents about change or differences from the last time they
were con-
tacted. Whether a question is located before or after certain
other questions
can affect how respondents answer. Depending on the situation,
respondents
may decide to include or exclude information when answering a
question
based on what information they have already provided to the
researcher in
previous questions (Schwarz 1996). If the previous question has
asked about
satisfaction with something related to the city or state in which
one lives,
one’s profession, or even one’s marriage, there may be some
carryover
effects that influence one’s answers (Schwarz, Strack, and Mai
1991;
Schwarz 1996). Thus, questions that use vague quantifiers and
require the
formulation of an answer on the spot seem more likely to be
influenced by
context and mode effects.
On the other hand, when respondents are asked questions about
things that
they know precisely, such as their age or date of birth, they hold
previously
40 FIELD METHODS
at SAGE Publications on September 9, 2009
http://fmx.sagepub.comDownloaded from
http://fmx.sagepub.com
formulated answers to these types of questions and do not need
the categories
to help prepare their answer. If categories are provided, the
respondents need
only to select the response choice that corresponds to their
preformulated
answer. For the most part, we do not expect that questions on
age, gender,
whether a home is rented or owned, or others for which
respondents carry
around obvious answers that they are willing to reveal to others
will produce
significant changes when asked by a different survey mode.
Other Contributors to Mode Differences
Researchers have identified many examples of mode
differences, as well
as many reasons for their occurrence. We provide a brief review
of some of
the most frequently observed differences (i.e., social
desirability, acquies-
cence, and primacy/recency effects).
Social desirability is the tendency for people to offer responses
that are
based on the perceived cultural expectations of others (de
Leeuw and Van
Der Zowen 1988). Such expectations are more likely to
influence answers in
interview surveys than in those that use self-administration
because of the
presence of an interviewer. One example is the frequently
observed tendency
for respondents to give more positive answers when asked to
rate their health.
In the classic study on this topic, Hochstim (1967) found that in
a face-to-face
interview, 43% of respondents ranked their health as excellent,
whereas 38%
did so over the telephone, and only 30% chose that category
when asked
using a mail survey. Paul Biemer (personal communication,
October 18,
2002) found that 15% of a national sample of people over sixty-
five ranked
their health as very good (the top choice) on a self-administered
question-
naire, but 27% did so in a follow-up face-to-face interview a
month later in
which an identically worded question was asked.
Since it is a cultural expectation that a person offers a casual
“fine” or
other positive answer when asked about one’s health, it should
not come as a
surprise that respondents in an interview survey give somewhat
more posi-
tive answers than they do in a self-administered questionnaire.
Similarly,
researchers have shown that respondents to interview surveys
are less likely
to admit to drug use or other socially undesirable behaviors
(DeLeeuw 1992;
Fowler, Roman, and Di 1998).
Acquiescence is the tendency to agree when interacting with
another per-
son because, in general, people find it easier to agree than
disagree. A limited
amount of research has suggested that people are more likely to
agree than
disagree with questionnaire items such as “Well-groomed
individuals make
better leaders” in interview surveys. To avoid possible
acquiescence, and
Dillman, Christian / SURVEY MODE AS SOURCE OF
INSTABILITY 41
at SAGE Publications on September 9, 2009
http://fmx.sagepub.comDownloaded from
http://fmx.sagepub.com
thus mode differences, it has been suggested that questions not
be formulated
using agree/disagree categories (Schuman and Presser 1981).
Recency is the tendency for respondents in interview surveys to
choose
from the last-offered answer choices, while primacy is the
tendency for respon-
dents in self-administered surveys to choose from among the
first-offered
categories. The primacy/recency phenomenon has been noted by
a number
of authors, notably Krosnick and Alwin (1987). Recency effects
were found
in telephone surveys conducted by Schuman and Presser (1981).
Other
authors have also presented evidence supporting the existence
of primacy/
recency effects, but their results have not always been
consistent. In eighty-
four experiments reported by Dillman et al. (1995) that used a
variety of
question structures, evidence for the existence of primacy on
mail surveys
and recency on telephone surveys was quite inconsistent.
Although the last word has certainly not been written about
mode differ-
ences, it is apparent that they occur frequently, and the reasons
for their
occurrences also differ. Much remains to be learned about how
mode influ-
ences answers to survey questions.
IN SEARCH OF SOLUTIONS
Just as mode differences do not flow from a single problem,
there is no
single solution that will facilitate switching modes when
conducting panel
studies. Rather, there are a set of issues that need to be
addressed, some sim-
ple, and some of which are much more complex and in need of
careful
research.
Unimode Construction and Its Limitations
One way of attempting to limit mode effects is to write survey
questions in
a manner that will work satisfactorily across different survey
modes and to
make sure that questions remain exactly the same in later data
collections,
regardless of modes. Procedures aimed at accomplishing the
same stimuli
across modes have been described elsewhere as unimode
construction
(Dillman 2000:ch. 6). An example of unimode construction is to
avoid using
“don’t know” as an available but unread category in the
telephone mode,
while preventing its use altogether in mail or Web surveys.
Instead, one
could make it explicitly available in all modes. Unimode
construction also
means resisting the temptation to change from an open-ended
question in an
interview to a close-ended question for a mail follow-up, simply
because
open-ended questions do not perform as well in such surveys.
And if one uses
42 FIELD METHODS
at SAGE Publications on September 9, 2009
http://fmx.sagepub.comDownloaded from
http://fmx.sagepub.com
yes/no formats for interviews, one needs to resist changing to a
check-all-
that-apply format for paper or Web self-administered surveys.
Further, if one
asks occupation through a series of mail questions, then one
needs to keep the
same format for telephone.
Unimode construction requires conductors of surveys to use
question
styles that are different from those generally accepted for the
various modes.
For example, if one wants to maintain the same stimulus on
telephone and
face-to-face, they should forego the use of so-called show cards
that are often
considered standard procedure for face-to-face interviews.
Accomplishing
unimode construction suggests the need to optimize
questionnaire design
across modes rather than to maximize for individual modes.
However, unimode construction is not a solution to some of the
issues
noted earlier, notably social desirability and acquiescence.
These effects
stem from the presence of an interviewer, and despite common
wording, tele-
phone and face-to-face interviews are likely to produce
different answers to
such questions than do self-administered questionnaires. In
addition, the fact
that recency effects have been associated with the verbal
presentation of
answer categories, while primacy effects are associated with the
visual
presentation of answers, presents a dilemma to questionnaire
designers.
It has sometimes been proposed that the answer categories be
rotated ran-
domly to deal with potential effects, and this may be
appropriate for some
cross-sectional surveys in which the main objective is to make
point esti-
mates. However, when applied to a panel survey in which the
objective is to
measure change between data collections, changing the category
order
threatens accurate measurement of that change. Thus, one must
balance the
potential benefits of randomly changing category order with
undesirable
consequences.
The adoption of unimode construction procedures suggest that
consider-
ation be given to such practices as reducing the length of scales
and perhaps
avoiding the use of verbal labels for each scale point. Switching
to scales
having verbal labels only for the endpoints would seem to
facilitate their
administration over the telephone, where interviewers often
struggle to read
scale points consistently. However, recent research on the
effects of visual
design and layout reveals that such attempts at finding
commonality in con-
struction across modes may be more difficult than it seems.
How Visual Design and Layout Affect Respondent Answers
It has long been recognized that question meaning in interview
surveys
does not come from words alone; voice and interviewer effects
act as a
paralanguage that give additional meaning to questions. These
influences
Dillman, Christian / SURVEY MODE AS SOURCE OF
INSTABILITY 43
at SAGE Publications on September 9, 2009
http://fmx.sagepub.comDownloaded from
http://fmx.sagepub.com
underlie the occurrence of social desirability and acquiescence
effects. Evi-
dence is now accumulating that self-administered
questionnaires, which
depend on visual as opposed to aural processing by the
respondent, may also
be subject to paralanguage affects.
Considerable research has suggested that when surveys are
administered
visually, respondents draw information from more than words.
To determine
question meaning, respondents may also draw information from
the visual
appearance and layout (Smith 1993; Schwarz 1996). It has been
proposed
that nonverbal languages such as numbers, symbols, and
graphical features
(such as variations in size, spacing, shapes, and brightness) act
as a para-
language that gives additional meaning to words (Redline and
Dillman
2002).
Recent experiments confirm that these nonverbal languages do
influence
how respondents interpret the meaning of questions and
instructions on
questionnaires in a wide variety of situations. Redline et al.
(2003) found in a
large-scale national experiment included in the 2000 Decennial
Census that
respondent errors in following mail survey branching
instructions, which
directed them to skip ahead, could be reduced by one-third,
from nearly 20%
to 13%. This was accomplished through the joint use of
additional symbols
(arrows), changes in the graphical appearance of the skip
instruction (larger,
darker font), and an additional word instruction placed at the
beginning of the
question to be skipped. The design of that experiment did not
allow the indi-
vidual effects of each change to be measured but did show that
combined
changes could produce a large reduction in errors.
Experimental research indicates that individual manipulations in
the
visual presentation or layout of questions can influence
respondent answers
similarly across mail and the Web. These experiments were
conducted using
random samples of undergraduate students at Washington State
University
in the spring of 2002 and 2003. The spring 2002 paper survey
was conducted
by mail using two different versions, and 1,042 students
completed the sur-
vey, for a response rate of 58%. A total of 1,591 students
completed one of
four versions of the Web survey conducted in spring 2003, for a
response rate
of 53%. A $2 incentive was mailed to all students sampled for
both the mail
and Web survey, and multiple contacts were sent to
nonresponders.
One set of experiments demonstrated that independent
manipulations of
symbols and graphics can change respondent answers to paper
question-
naires (Christian and Dillman 2004). For example, changing the
layout of
scales from a vertical linear display of categories to a nonlinear
display,
arranging the same categories so that the first two were in one
column, the
next two in a column to the right, and the fifth to the right of
that column, sig-
nificantly affected the response distributions. In addition,
changing the dis-
44 FIELD METHODS
at SAGE Publications on September 9, 2009
http://fmx.sagepub.comDownloaded from
http://fmx.sagepub.com
tance between answer spaces, placement of a large arrow (vs. no
arrow) that
would direct respondents to a subordinate question, and changes
in the size of
open-ended answer spaces all significantly influenced people’s
answers.
Another experiment in this study revealed the considerable
dependence of
respondents on graphical layout for providing meaning to
questions and
raises additional concerns about possible mode differences.
Respondents
were asked to answer using a five-point scale with polar point
labels that was
presented in one of two formats: (1) a linear layout with
numbers and boxes
for each category and (2) a layout that conveyed information
about the scale
in the query, but required respondents to put the number of their
choice in a
box (see Figures 1A and 1B). The latter version removed the
graphical and
symbolic languages that may have helped communicate the
continuum of the
scale. Respondents to the number box version gave consistently
more nega-
tive answers than did respondents to the linearly displayed
check box ver-
sion. These results are summarized here in Table 1A.
Examination of com-
pleted questionnaires revealed numerous erasures and answer
changes from
1 to 5 and 2 to 4 or vice versa, suggesting that respondents had
become con-
fused when interpreting the direction of the number box scale,
because of the
removal of the other supporting languages (Christian and
Dillman 2004).
Dillman, Christian / SURVEY MODE AS SOURCE OF
INSTABILITY 45
FIGURE 1A
Question Wording and Formats Compared in Paper and Web
Experiments
(Mail Experiment)
at SAGE Publications on September 9, 2009
http://fmx.sagepub.comDownloaded from
http://fmx.sagepub.com
A subsequent study repeated this experiment in a Web survey
using the
same three questions (Christian 2003). The test was also
expanded to include
a treatment in which the same questions were asked, using the
same catego-
ries with all five-scale points labeled. As shown in Table 1B,
the polar point
versus number box comparison results are quite similar to those
found for the
previous paper experiment. For all three questions in both
experiments, the
number box produced more negative answers than did the polar
point ver-
sion. The fully labeled versions produced even more positive
answers for
two of the three items than did the polar point scale (see Table
1C).
46 FIELD METHODS
FIGURE 1B
Question Wording and Formats Compared in Paper and Web
Experiments
(Web Experiment)
at SAGE Publications on September 9, 2009
http://fmx.sagepub.comDownloaded from
http://fmx.sagepub.com
These differences suggest clearly that variations in how a five-
point scale
is supported by words, numbers, symbols, and graphics can
influence
answers to scalar satisfaction questions that use visual
communication, and
Dillman, Christian / SURVEY MODE AS SOURCE OF
INSTABILITY 47
TABLE 1A
Percentage of Respondents Choosing Each Category
in Paper and Web Experiments for the Same Questions
(Paper Experiment: Polar Point versus Number Box
Comparisons)
Question 1 Question 2 Question 3
a
Polar Number Polar Number Polar Number
Response Point Box Point Box Point Box
1 Very satisfied 15.9 9.8 10.8 6.3 15.2 14.2
2 43.5 29.2 47.6 35.4 31.8 23.8
3 31.0 34.5 31.3 33.8 31.6 29.6
4 7.7 21.3 9.5 20.9 15.4 21.7
5 Very dissatisfied 1.9 5.3 0.8 3.7 5.9 10.7
Total 100 100 100 100 100 100
n 517 513 517 512 506 466
Mean 2.4 2.8 2.4 2.8 2.7 2.9
Difference of means t = 7.7 p = .000 t = 6.9 p = .000 t = 3.5 p =
.000
Chi square χ2 = 63.4 p = .000 χ2 = 48.1 p = .000 χ2 = 18.0 p =
.001
a. Response categories to this item were 1 (outstanding) to 5
(terrible).
TABLE 1B
Percentage of Respondents Choosing Each Category
in Paper and Web Experiments for the Same Questions
(Web Experiment: Polar Point versus Answer Box Comparisons)
Question 1 Question 2 Question 3
a
Polar Number Polar Number Polar Number
Response Point Box Point Box Point Box
1 Very satisfied 19.4 17.2 10.5 6.9 14.0 15.8
2 40.0 32.8 43.6 38.0 29.3 21.8
3 30.6 27.5 35.2 40.4 30.0 31.7
4 8.2 18.5 9.8 12.4 19.0 18.8
5 Very dissatisfied 1.8 4.0 0.9 2.3 7.8 11.9
Total 100 100 100 100 100 100
n 438 302 438 305 437 303
Mean 2.3 2.6 2.5 2.7 2.8 2.9
Difference of means t = 3.48 p = .000 t = 2.86 p = .002 t = 1.34
p = .091
Chi-square χ2 = 21.9 p = .000 χ2 = 8.72 p = .068 χ2 = 7.63 p =
.106
a. Response categories to this item were 1 (outstanding) to 5
(terrible).
at SAGE Publications on September 9, 2009
http://fmx.sagepub.comDownloaded from
http://fmx.sagepub.com
these features must be taken into account when using the same
visual mode
across data collections. Removing word support (shifting to a
polar point
scale) or graphical and symbolic support (shifting to a number
box) results in
different answers for self-administered visual surveys. These
results raise the
question of which of these formats may translate most
effectively across
visual and aural survey modes.
An earlier experiment conducted by the Gallup Organization
compared
answers to similar five-point satisfaction scales using polar
point word labels
for respondents surveyed by telephone, IVR, Web, and mail
(Dillman et al.
2001). In this survey, respondents to the aural modes (telephone
and IVR)
provided significantly more positive answers, as reflected in
greater use of
the extreme positive category, than did respondents to the visual
modes
(Web and mail). These results provide evidence that the polar
point scale did
not translate equivalently between visual and aural presentation.
Whether
better equivalency might be achieved between fully labeled
questions remains
to be seen.
SUMMARY AND CONCLUSIONS
Mode changes between the initial data-collection period and
follow-up
data collections for panel studies should be evaluated carefully.
There is a
48 FIELD METHODS
TABLE 1C
Percentage of Respondents Choosing Each Category
in Paper and Web Experiments for the Same Questions
(Web Experiment: Fully Labeled versus Polar Point
Comparisons)
Question 1 Question 2 Question 3
a
Fully Polar Fully Polar Fully Polar
Response Labeled Point Labeled Point Labeled Point
1 Very satisfied 29.3 19.4 14.3 10.5 16.2 14.0
2 50.2 40.0 63.1 43.6 26.3 29.3
3 9.5 30.6 13.4 35.2 26.1 30.0
4 9.2 8.2 8.8 9.8 20.3 19.0
5 Very dissatisfied 1.8 1.8 0.5 0.9 11.1 7.8
Total 100 100 100 100 100 100
n 434 438 434 438 433 437
Mean 2.0 2.3 2.2 2.5 2.8 2.8
Difference of means t = 4.5 p = .000 t = 5.2 p = .000 t = .80 p =
.211
Chi square χ2 = 62.6 p = .000 χ2 = 61.6 p = .000 χ2 = 5.27 p =
.260
a. Response categories to this item were 1 (outstanding) to 5
(terrible).
at SAGE Publications on September 9, 2009
http://fmx.sagepub.comDownloaded from
http://fmx.sagepub.com
considerable likelihood that such changes make it difficult to
accurately
measure change between survey waves. Nonetheless, mode
changes are
common in panel studies and are the result of many
considerations from
cost and budget concerns to personal and organizational
preferences. Fur-
thermore, cross-sectional studies that mix modes should also be
aware of
how the choice of mode may be influencing respondents’
answers to survey
questions.
Multiple factors may contribute to different measurements being
obtained
solely as a result of mode change. One of the most frequent
causes of change
is inadvertent revision in the structure of questions to follow
suggested
design procedures for one mode. Each mode favors the
construction of ques-
tions in ways that differ from those favored by each of the other
modes. When
data collection for panel studies is left to technical staff
associated with each
mode, it is likely that question structures will be changed.
Furthermore, the
insertion of new questions for follow-up studies between
questions from pre-
vious waves may produce unintended order or context effects.
A third set of factors that appear to contribute to measurement
differences
across modes—social desirability, acquiescence, and
primacy/recency—
present particularly difficult challenges because it may not be
possible to
completely eliminate these differences, leaving adjustment or
indexing as
the only solution.
The construction of questions to provide a more equivalent
stimulus
across modes (i.e., unimode construction) seems desirable when
conducting
mixed-mode surveys. However, to do this will likely require
writing ques-
tions in ways that optimize their use across all modes rather
than allowing
what is best (or traditional) for one mode. This may be quite
difficult to
accomplish in our complex survey world in which there are
many different
modes to use and established procedures for constructing
questions for each
mode exist.
Recent experimental evidence that the visual presentation of
questions
can significantly influence people’s answers raises important
questions that
remain to be answered. The results reported here show that
three differ-
ent versions of five-point satisfaction questions—polar point
labels using a
linear scale layout, a number box without visual layout support
for answer
categories, and a fully labeled scale with verbal labels for each
category—
produced significantly different answers for each of the layouts.
These
results suggest that differences in layout within visual modes
must also be
considered a possible source of measurement error and that
research is
needed on how various visual representations compare when
used in aural
modes of surveying.
Dillman, Christian / SURVEY MODE AS SOURCE OF
INSTABILITY 49
at SAGE Publications on September 9, 2009
http://fmx.sagepub.comDownloaded from
http://fmx.sagepub.com
Survey researchers face substantial challenges because of the
variety of
modes from which they can choose. However, the theoretical
and empirical
work that has been performed thus far offers a rich source of
ideas for finding
appropriate solutions and directions for future research. The
mistake would
be to ignore mode, and now visual design effects, as if they did
not really
matter.
REFERENCES
Bishop, G. H., H. -J. Hippler, N. Schwarz, and F. Strack. 1988.
A comparison of response effects
in self-administered and telephone surveys. In Telephone survey
methodology, edited by R. M.
Groves, P. P. Biemer, L. E. Lyberg, J. T. Massey, W. L.
Nicholls II, and J. Waksberg, 321–
40. New York: Wiley-Interscience.
Christian, L. M. 2003. The influence of visual layout on scalar
questions in web surveys. Mas-
ter’s thesis, Washington State University.
Christian, L. M., and D. A. Dillman. 2004. The influence of
graphical and symbolic language
manipulations on responses to self-administered surveys. Public
Opinion Quarterly 68 (1):
58–81.
de Leeuw, E. 1992. Data quality in mail, telephone, and face-to-
face surveys. Amsterdam: TT.
de Leeuw, E., and H. Van Der Zowen. 1988. Data quality in
telephone and face-to-face surveys:
A comparative analysis. In Telephone survey methodology,
edited by R. M. Groves, P. Biemer,
L. Lyberg, J. T. Massey, W. L. Nicholls II, and J. Waksberg,
283–99. New York: Wiley-
Interscience.
Dillman, D. A. 1978. Mail and telephone surveys: The total
design method. New York: John
Wiley.
method. New York: John Wiley.
ge: Some
observations on survey methodology in
the early twenty-first century. Public Opinion Quarterly
66:473–94.
Dillman, D. A., T. L. Brown, J. Carlson, E. H. Carpenter, F. O.
Lorenz, R. Mason, J. Saltiel, and
R. L. Sangster. 1995. Effects of category order on answers to
mail and telephone surveys.
Rural Sociology 60:674–87.
Dillman, D. A., G. Phelps, R. Tortora, K. Swift, J. Kohrell, and
J. Berck. 2001. Response rate and
measurement differences in mixed mode surveys using mail,
telephone, interactive voice
response and the Internet. Paper presented at the 56th Annual
Meeting of the American Asso-
ciation for Public Opinion Research, Montreal, May 18.
Dillman, D. A., R. Sangster, J. Tarnai, and T. Rockwood. 1996.
Understanding differences in
people’s answers to telephone and mail surveys. In Current
issues in survey research: New
directions for program evaluation series, edited by M. T.
Braverman and J. K. Slater, 45–62.
San Francisco: Jossey-Bass.
Dillman, D. A., J. Smyth, L. M. Christian, and M. Stern. 2003.
Multiple-answer questions in self-
administered surveys: The use of check-all-that-apply and
forced-choice question formats.
Paper presented at the annual meeting of the American
Statistical Association, San Fran-
cisco, August 3–7.
Fowler, F. J., Jr., A. M. Roman, and Z. X. Di. 1998. Mode
effects in a survey of Medicare prostate
surgery patients. Public Opinion Quarterly 62:29–46.
50 FIELD METHODS
at SAGE Publications on September 9, 2009
http://fmx.sagepub.comDownloaded from
http://fmx.sagepub.com
Hochstim, J. 1967. A critical comparison of thee strategies of
collecting data from households.
Journal of the American Statistical Association 62:976–89.
Krosnick, J., and D. F. Alwin. 1987. An evaluation of a
cognitive theory of response-order
effects in survey measurement. Public Opinion Quarterly
51:201–19.
Miller, P. 1984. Alternative question forms for attitude scale
questions in telephone interviews.
Public Opinion Quarterly 48:766–78.
Rasinski, K. A., D. Mingay, and N. M. Bradburn. 1994. Do
respondents really “mark all that
apply” on self-administered questions?” Public Opinion
Quarterly 58:400–8.
Redline, C. D., and D. A. Dillman. 2002. The influence of
alternative visual designs on respon-
dents’ performance with branching instructions in self-
administered questionnaires. In Sur-
vey nonresponse, edited by R. Groves, D. Dillman, J. Eltinge,
and R. Little, pp. 179–193.
New York: John Wiley.
Redline, C. D., D. A. Dillman, A. Dajani, and M. A. Scaggs.
2003. Improving navigational per-
formance in U.S. Census 2000 by altering the visually
administered languages of branching
instructions. Journal of Official Statistics 19 (4): 403–19.
Schwarz, N. 1996. Cognition and communication judgmental
biases, research methods, and the
logic of conversation. Mahwah, NJ: Lawrence Erlbaum.
Schwarz, N., F. Strack, and H.-P. Mai. 1991. Assimilation and
contrast effects in part-whole
question sequences: A conversational logic analysis. Public
Opinion Quarterly 55:3–23.
Schuman, H., and S. Presser. 1981. Questions and answers in
attitude surveys experiments on
question form, wording, and context. New York: Academic
Press.
Shettle, C., and G. Mooney. 1999. Monetary incentives in U.S.
government surveys. Journal of
Official Statistics 15 (2): 231–50.
Smith, T. W. 1993. Little things matter: A sampler of how
differences in questionnaire format
can affect survey responses. GSS Methodological Report. No.
78. Chicago: National Opin-
ion Research Center.
Stapleton, C. N., S. Norris, and S. Brady. 2003. Customer
satisfaction with Internet and IVR as
census data collection tools. Paper presented at the Joint
Statistical Meetings, San Francisco,
August 6.
Tourangeau, R., D. M. Steiger, and D. Wilson. 2002. Self-
administered questions by telephone:
Evaluating interactive voice response. Public Opinion Quarterly
66 (2): 265–78.
DON A. DILLMAN is the Thomas S. Foley Distinguished
Professor of Government and
Public Policy, Regents’ Professor in the Departments of
Sociology and Community and
Rural Sociology and deputy director for research of the Social
and Economic Sciences
Research Center, all at Washington State University. His
current research focuses on
understanding how alternative question structures and their
visual layouts influence
respondent answers. Recent publications include “Improving
Navigational Perfor-
mance in Census 2000 by Altering the Visually Administered
Languages of Branching
Instructions” (with C. Redline et al. in Journal of Official
Statistics, 2003) and an edited
book Survey Nonresponse (with R. Groves et al., Wiley-
Interscience, 2002).
LEAH MELANI CHRISTIAN is a graduate research assistant in
the Social and Eco-
nomic Sciences Research Center and a doctoral student in the
Department of Sociology
at Washington State University. Her research interests include
social theory and meth-
ods, political sociology, and inequality. Recent publications and
papers include “The
Dillman, Christian / SURVEY MODE AS SOURCE OF
INSTABILITY 51
at SAGE Publications on September 9, 2009
http://fmx.sagepub.comDownloaded from
http://fmx.sagepub.com
Influence of Graphical and Symbolic Language Manipulations
on Responses to Self-
Administered Surveys” (with D. A. Dillman in Public Opinion
Quarterly, 2004) and “The
Influence of Visual Layout on Scalar Questions in Web
Surveys” (paper presented at the
59th Annual Conference of the American Association for Public
Opinion Research,
Phoenix, May 15).
52 FIELD METHODS
at SAGE Publications on September 9, 2009
http://fmx.sagepub.comDownloaded from
http://fmx.sagepub.com
9/22/2019 SafeAssign Originality Report
https://ucumberlands.blackboard.com/webapps/mdb-sa-
BB5a31b16bb2c48/originalityReportPrint?course_id=_110648_
1&paperId=2143439390&&atte… 1/9
2326.202010 - FALL 2019 - CRYPTOGRAPHY (ISOL-535-22)
- FULL TERM
Assignment Week 4
Sai Krishna Kailasapu
on Sun, Sep 22 2019, 10:08 AM
97% highest match
Submission ID: b69529aa-aa8f-496b-abbd-61b74394a978
Attachments (1)
Publickeycryptography.docx
2
1 PUBLIC KEY ENCRYPTION PUBLIC-KEY
CRYPTOGRAPHY HAS TURNED
INTO A SIGNIFICANT METHOD FOR GUARANTEEING
CLASSIFICATION,
STRIKINGLY THROUGH ITS UTILIZATION OF KEY
CONVEYANCE, WHERE
CLIENTS LOOKING FOR PRIVATE CORRESPONDENCE
TRADE ENCRYPTION
KEYS. 2 IT LIKEWISE INCLUDES ADVANCED MARKS
WHICH ENABLE
CLIENTS TO SIGN KEYS TO CHECK THEIR CHARACTERS.
THESE
COMMITMENTS ACQUAINT NEW DEGREES OF SECURITY
WITH THE
SUBJECT WITH THOUGHTS TO A CYBERATTACKS
ATTACKS AND OTHER
HACKER SITUATIONS. PUBLIC-KEY ENCRYPTION WITH
COMPUTERIZED
SIGNATURES OFFERS BOTH SECURITY AND
INFORMATION
TRUSTWORTHINESS AGAINST GENERAL AGGRESSORS.
3 THE PUBLIC KEY TECHNIQUE COMPRISES OF
DISCRETE ENCRYPTION
AND UNSCRAMBLING KEYS, WITH CLIENTS POSSIBLY
HAVING THE OPTION
TO DECODE AN ENCODED MESSAGE ON THE OFF
CHANCE THAT THEY HAVE
THE FITTING UNSCRAMBLING KEY. 4 CLIENTS WILL
TRADE PUBLIC KEYS;
(http://safeassign.blackboard.com/)
Publickeycryptography.docx
Word Count: 588
Attachment ID: 2143439390
97%
dzwsdasdasdasasaas
http://safeassign.blackboard.com/
9/22/2019 SafeAssign Originality Report
https://ucumberlands.blackboard.com/webapps/mdb-sa-
BB5a31b16bb2c48/originalityReportPrint?course_id=_110648_
1&paperId=2143439390&&atte… 2/9
THIS EXCHANGE SHOULDN'T BE DONE IN A PROTECTED
WAY BECAUSE
THE ARRIVAL OF PUBLIC KEYS DOESN'T COMPROMISE
THE SECURITY OF
ANY PRIVATE DATA. 3 AFTER THIS SWAP, SOMEBODY
WHO WISHES TO
SEND PRIVATE DATA TO ANOTHER CLIENT WILL
SCRAMBLE THE
INFORMATION WITH THE EXPECTED BENEFICIARY'S
PUBLIC KEY AND
AFTERWARD GO ALONG THE ENCODED MESSAGE. THE
BENEFICIARY, WHO
WILL KEEP THEIR PRIVATE KEY SECURE UNDER ANY
SITUATION, CAN
UTILIZE THE PRIVATE KEY TO UNSCRAMBLE THE
ENCODED MESSAGE.
STRENGTHS THE UNBALANCED IDEA OF PUBLIC-KEY
CRYPTOGRAPHY
PERMITS IT A SIZABLE PREFERRED POSITION OVER
SYMMETRIC-KEY
ALGORITHMS. 5 THE SPECIAL PRIVATE AND PUBLIC
KEYS GAVE TO EVERY
CLIENT ENABLE THEM TO LEAD SECURE TRADES OF
DATA WITHOUT FIRST
EXPECTING TO DEVISE SOME APPROACH TO SUBTLY
SWAP KEYS. This glaring
shortcoming of mystery key cryptography turns into an essential
quality of public-key
encryption Weaknesses Keys in deviated cryptography are more
vulnerable against beast
power attacks than covertly key cryptography. 5 THERE
EXIST CALCULATIONS FOR
PUBLIC-KEY CRYPTOGRAPHY THAT ENABLE
ASSAILANTS TO BREAK
PRIVATE KEYS QUICKER THAN AN ANIMAL POWER
TECHNIQUE WOULD
REQUIRE. 3 THE BROADLY UTILIZED AND
SPEARHEADING RSA
ALGORITHM HAS SUCH A CALCULATION, THAT LEAVES
IT VULNERABLE TO
ATTACKS IN UNDER BEAST POWER TIME. 5 WHILE
PRODUCING LONGER
ENTERS IN DIFFERENT CALCULATIONS WILL, FOR THE
MOST PART, AVOID
AN ANIMAL POWER ATTACK FROM PREVAILING IN ANY
IMPORTANT TIME
ALLOTMENT, THESE CALCULATIONS BECOME ALL THE
MORE
COMPUTATIONALLY CONCENTRATED. THESE MORE
EXTENDED KEYS CAN,
IN ANY CASE, FLUCTUATE IN VIABILITY RELYING UPON
THE PROCESSING
POWER ACCESSIBLE TO AN ASSAILANT.
Public-key cryptography likewise has vulnerabilities to attacks,
for example, the man in the
centre attack. 3 IN THIS CIRCUMSTANCE, A MALIGNANT
OUTSIDER CATCHES
A PUBLIC KEY ON ITS APPROACH TO ONE OF THE
GATHERINGS IN
QUESTION. THE OUTSIDER CAN THEN RATHER GO
ALONG THEIR VERY
OWN PUBLIC KEY WITH A MESSAGE PROFESSING TO BE
FROM THE FIRST
SENDER. AN ASSAILANT CAN UTILIZE THIS PROCEDURE
AT EACH
9/22/2019 SafeAssign Originality Report
https://ucumberlands.blackboard.com/webapps/mdb-sa-
BB5a31b16bb2c48/originalityReportPrint?course_id=_110648_
1&paperId=2143439390&&atte… 3/9
PROGRESSION OF THE TRADE TO EFFECTIVELY IMITATE
EVERY
INDIVIDUAL FROM THE DISCUSSION WITH NO
DIFFERENT GATHERINGS
KNOWING ABOUT THIS DOUBLE-DEALING.
6 RECOMMENDATIONS HERZBERG, ET AL. understand the
issues introduced by the
need of keeping a private key utilized in public-key
cryptography mystery for quite a while,
and present proactive public key frameworks that require
increasingly effective programmer
attacks in a shorter timeframe to acquire the private key.
References
6 AMIR HERZBERG, MARKUS JAKOBSSON, STANISLŁAW
JARECKI, HUGO
KRAWCZYK, MOTI YUNG, (1997)"PROACTIVE PUBLIC
KEYS AND SIGNATURE
SYSTEMS," 7 CONFERENCE ON COMPUTER AND
COMMUNICATIONS
SECURITY, PP. 100-110
8 MAURIZIO KLIBAN BOYARSKY (1999), "PUBLIC-KEY
CRYPTOGRAPHY
AND PASSWORD PROTOCOLS: 9 THE MULTI-USER
CASE," 8 PROCEEDINGS
OF THE 6TH ACM CONFERENCE ON COMPUTER AND
COMMUNICATIONS
SECURITY CCS '99, NOVEMBER, PP. 63-72.
10 SHAI HALEVI AND HUGO KRAWCZYK (1999),
"PUBLIC-KEY
CRYPTOGRAPHY AND PASSWORD PROTOCOLS," 11 ACM
TRANSACTIONS ON
INFORMATION AND SYSTEM SECURITY, AUGUST, PP.
230-268.
Citations (11/11)
1 Another student's paper
2 Another student's paper
3 Another student's paper
4 Another student's paper
5 Another student's paper
6 Another student's paper
7 Another student's paper
9/22/2019 SafeAssign Originality Report
https://ucumberlands.blackboard.com/webapps/mdb-sa-
BB5a31b16bb2c48/originalityReportPrint?course_id=_110648_
1&paperId=2143439390&&atte… 4/9
Matched Text
8 Another student's paper
9 https://eprint.iacr.org/1999/
10 Another student's paper
11 Another student's paper
Suspected Entry: 86% match
Uploaded - Publickeycryptography.docx
PUBLIC KEY ENCRYPTION PUBLIC-KEY
CRYPTOGRAPHY HAS TURNED INTO A
SIGNIFICANT METHOD FOR GUARANTEEING
CLASSIFICATION, STRIKINGLY THROUGH ITS
UTILIZATION OF KEY CONVEYANCE, WHERE
CLIENTS LOOKING FOR PRIVATE
CORRESPONDENCE TRADE ENCRYPTION KEYS
Source - Another student's paper
Public key cryptography has turned into a significant
method for guaranteeing classification, outstandingly
through its utilization of key dispersion, where clients
looking for private correspondence trade encryption
keys
Suspected Entry: 83% match
Uploaded - Publickeycryptography.docx
IT LIKEWISE INCLUDES ADVANCED MARKS
WHICH ENABLE CLIENTS TO SIGN KEYS TO
CHECK THEIR CHARACTERS
Source - Another student's paper
It likewise includes advanced marks which enable
clients to sign keys to confirm their personalities
Suspected Entry: 66% match
Uploaded - Publickeycryptography.docx
THESE COMMITMENTS ACQUAINT NEW
DEGREES OF SECURITY WITH THE SUBJECT
WITH THOUGHTS TO A CYBERATTACKS
ATTACKS AND OTHER HACKER SITUATIONS
Source - Another student's paper
These commitments acquaint new levels of security
with the subject with thoughts to battle man in the
center assaults and other programmer situations
Suspected Entry: 63% match
Uploaded - Publickeycryptography.docx Source - Another
student's paper
9/22/2019 SafeAssign Originality Report
https://ucumberlands.blackboard.com/webapps/mdb-sa-
BB5a31b16bb2c48/originalityReportPrint?course_id=_110648_
1&paperId=2143439390&&atte… 5/9
PUBLIC-KEY ENCRYPTION WITH
COMPUTERIZED SIGNATURES OFFERS BOTH
SECURITY AND INFORMATION
TRUSTWORTHINESS AGAINST GENERAL
AGGRESSORS
Open key encryption with advanced marks offers both
security and information honesty against generally
aggressors
Suspected Entry: 81% match
Uploaded - Publickeycryptography.docx
THE PUBLIC KEY TECHNIQUE COMPRISES OF
DISCRETE ENCRYPTION AND UNSCRAMBLING
KEYS, WITH CLIENTS POSSIBLY HAVING THE
OPTION TO DECODE AN ENCODED MESSAGE
ON THE OFF CHANCE THAT THEY HAVE THE
FITTING UNSCRAMBLING KEY
Source - Another student's paper
The creator's open key strategy comprises of
independent encryption and unscrambling keys, with
clients possibly having the option to decode a
scrambled message on the off chance that they have
the fitting unscrambling key
Suspected Entry: 92% match
Uploaded - Publickeycryptography.docx
AFTER THIS SWAP, SOMEBODY WHO WISHES
TO SEND PRIVATE DATA TO ANOTHER CLIENT
WILL SCRAMBLE THE INFORMATION WITH THE
EXPECTED BENEFICIARY'S PUBLIC KEY AND
AFTERWARD GO ALONG THE ENCODED
MESSAGE
Source - Another student's paper
After this swap, somebody who wishes to send
private data to another client will scramble the
information with the planned beneficiary's open key
and afterward go along the encoded message
Suspected Entry: 94% match
Uploaded - Publickeycryptography.docx
THE BENEFICIARY, WHO WILL KEEP THEIR
PRIVATE KEY SECURE UNDER ANY SITUATION,
CAN UTILIZE THE PRIVATE KEY TO
UNSCRAMBLE THE ENCODED MESSAGE
Source - Another student's paper
The beneficiary, who will keep their private key secure
under any condition, can utilize the private key to
unscramble the encoded message
Suspected Entry: 72% match
Uploaded - Publickeycryptography.docx
STRENGTHS THE UNBALANCED IDEA OF
PUBLIC-KEY CRYPTOGRAPHY PERMITS IT A
SIZABLE PREFERRED POSITION OVER
SYMMETRIC-KEY ALGORITHMS
Source - Another student's paper
The nature of open key cryptography permits it a
sizable preferred position over symmetric-key
calculations
9/22/2019 SafeAssign Originality Report
https://ucumberlands.blackboard.com/webapps/mdb-sa-
BB5a31b16bb2c48/originalityReportPrint?course_id=_110648_
1&paperId=2143439390&&atte… 6/9
Suspected Entry: 69% match
Uploaded - Publickeycryptography.docx
THE BROADLY UTILIZED AND SPEARHEADING
RSA ALGORITHM HAS SUCH A CALCULATION,
THAT LEAVES IT VULNERABLE TO ATTACKS IN
UNDER BEAST POWER TIME
Source - Another student's paper
The generally utilized and spearheading RSA
calculation has such a calculation, that leaves it
powerless to assaults in under animal power time
Suspected Entry: 73% match
Uploaded - Publickeycryptography.docx
IN THIS CIRCUMSTANCE, A MALIGNANT
OUTSIDER CATCHES A PUBLIC KEY ON ITS
APPROACH TO ONE OF THE GATHERINGS IN
QUESTION
Source - Another student's paper
In this circumstance, a pernicious outsider blocks an
open key on its approach to one of the gatherings in
question
Suspected Entry: 94% match
Uploaded - Publickeycryptography.docx
THE OUTSIDER CAN THEN RATHER GO ALONG
THEIR VERY OWN PUBLIC KEY WITH A
MESSAGE PROFESSING TO BE FROM THE FIRST
SENDER
Source - Another student's paper
The outsider can then rather go along their very own
open key with a message professing to be from the
first sender
Suspected Entry: 80% match
Uploaded - Publickeycryptography.docx
AN ASSAILANT CAN UTILIZE THIS PROCEDURE
AT EACH PROGRESSION OF THE TRADE TO
EFFECTIVELY IMITATE EVERY INDIVIDUAL FROM
THE DISCUSSION WITH NO DIFFERENT
GATHERINGS KNOWING ABOUT THIS DOUBLE-
DEALING
Source - Another student's paper
An aggressor can utilize this procedure at each
progression of a trade so as to effectively mimic every
individual from the discussion with no different
gatherings knowing about this trickiness
Suspected Entry: 100% match
Uploaded - Publickeycryptography.docx
CLIENTS WILL TRADE PUBLIC KEYS
Source - Another student's paper
Clients will trade public keys
9/22/2019 SafeAssign Originality Report
https://ucumberlands.blackboard.com/webapps/mdb-sa-
BB5a31b16bb2c48/originalityReportPrint?course_id=_110648_
1&paperId=2143439390&&atte… 7/9
Suspected Entry: 74% match
Uploaded - Publickeycryptography.docx
THIS EXCHANGE SHOULDN'T BE DONE IN A
PROTECTED WAY BECAUSE THE ARRIVAL OF
PUBLIC KEYS DOESN'T COMPROMISE THE
SECURITY OF ANY PRIVATE DATA
Source - Another student's paper
this exchange shouldn't be done in a safe way on the
grounds that the arrival of open keys does not
compromise the security of any private data
Suspected Entry: 94% match
Uploaded - Publickeycryptography.docx
THE SPECIAL PRIVATE AND PUBLIC KEYS GAVE
TO EVERY CLIENT ENABLE THEM TO LEAD
SECURE TRADES OF DATA WITHOUT FIRST
EXPECTING TO DEVISE SOME APPROACH TO
SUBTLY SWAP KEYS
Source - Another student's paper
The one of a kind private and Public Keys gave to
every client enable them to lead secure trades of data
without first expecting to devise some approach to
subtly swap keys
Suspected Entry: 77% match
Uploaded - Publickeycryptography.docx
THERE EXIST CALCULATIONS FOR PUBLIC-KEY
CRYPTOGRAPHY THAT ENABLE ASSAILANTS
TO BREAK PRIVATE KEYS QUICKER THAN AN
ANIMAL POWER TECHNIQUE WOULD REQUIRE
Source - Another student's paper
There exist calculations for public-key cryptography
that enable attackers to break private keys quicker
than a brute force strategy would require
Suspected Entry: 67% match
Uploaded - Publickeycryptography.docx
WHILE PRODUCING LONGER ENTERS IN
DIFFERENT CALCULATIONS WILL, FOR THE
MOST PART, AVOID AN ANIMAL POWER ATTACK
FROM PREVAILING IN ANY IMPORTANT TIME
ALLOTMENT, THESE CALCULATIONS BECOME
ALL THE MORE COMPUTATIONALLY
CONCENTRATED
Source - Another student's paper
While creating longer keys in different calculations will
more often than not keep a brute force attack from
prevailing in any important time allotment, these
calculations turn out to be all the more
computationally concentrated
Suspected Entry: 62% match
Uploaded - Publickeycryptography.docx
THESE MORE EXTENDED KEYS CAN, IN ANY
CASE, FLUCTUATE IN VIABILITY RELYING UPON
Source - Another student's paper
These more drawn out keys can at present differ in
viability relying upon the registering power accessible
9/22/2019 SafeAssign Originality Report
https://ucumberlands.blackboard.com/webapps/mdb-sa-
BB5a31b16bb2c48/originalityReportPrint?course_id=_110648_
1&paperId=2143439390&&atte… 8/9
THE PROCESSING POWER ACCESSIBLE TO AN
ASSAILANT
to an attacker
Suspected Entry: 81% match
Uploaded - Publickeycryptography.docx
RECOMMENDATIONS HERZBERG, ET AL
Source - Another student's paper
Herzberg, et al
Suspected Entry: 74% match
Uploaded - Publickeycryptography.docx
AMIR HERZBERG, MARKUS JAKOBSSON,
STANISLŁAW JARECKI, HUGO KRAWCZYK, MOTI
YUNG, (1997)"PROACTIVE PUBLIC KEYS AND
SIGNATURE SYSTEMS,"
Source - Another student's paper
[5] Amir Herzberg, Markus Jakobsson, Stanislław
Jarecki, Hugo Krawczyk, Moti Yung, “Proactive public
keys and signature systems,” Conference on
Computer and Communications Security, pp
Suspected Entry: 68% match
Uploaded - Publickeycryptography.docx
CONFERENCE ON COMPUTER AND
COMMUNICATIONS SECURITY, PP
Source - Another student's paper
Proceedings of the 6th ACM Conference on
Computer and Communications Security, 1999, pp
Suspected Entry: 93% match
Uploaded - Publickeycryptography.docx
MAURIZIO KLIBAN BOYARSKY (1999), "PUBLIC-
KEY CRYPTOGRAPHY AND PASSWORD
PROTOCOLS
Source - Another student's paper
Maurizio Kliban Boyarsky, “Public-key cryptography
and password protocols
Suspected Entry: 85% match
Uploaded - Publickeycryptography.docx
PROCEEDINGS OF THE 6TH ACM CONFERENCE
ON COMPUTER AND COMMUNICATIONS
SECURITY CCS '99, NOVEMBER, PP
Source - Another student's paper
the multi-user case,” Proceedings of the 6th ACM
conference on Computer and communications
security CCS '99, November 1999, pp
Suspected Entry: 87% match
9/22/2019 SafeAssign Originality Report
https://ucumberlands.blackboard.com/webapps/mdb-sa-
BB5a31b16bb2c48/originalityReportPrint?course_id=_110648_
1&paperId=2143439390&&atte… 9/9
Uploaded - Publickeycryptography.docx
THE MULTI-USER CASE,"
Source - https://eprint.iacr.org/1999/
The Multi-User Case
Suspected Entry: 72% match
Uploaded - Publickeycryptography.docx
SHAI HALEVI AND HUGO KRAWCZYK (1999),
"PUBLIC-KEY CRYPTOGRAPHY AND PASSWORD
PROTOCOLS,"
Source - Another student's paper
[3] Shai Halevi and Hugo Krawczyk, “Public-key
cryptography and password protocols,” ACM
Transactions on Information and System Security,
August 1999, pp
Suspected Entry: 84% match
Uploaded - Publickeycryptography.docx
ACM TRANSACTIONS ON INFORMATION AND
SYSTEM SECURITY, AUGUST, PP
Source - Another student's paper
ACM Transactions on Information and System
Security
After you read the article, write a short paper (approximately 2-
3 pages, double spaced) that addresses the following questions
(please use the same structure, organization, and subheadings in
your paper):
Reference (APA style):
Citation (APA style):
1. What is the Research Question? What interesting and/or
important sociological issue is this study trying to solve?
2. What type of Background Information is provided (this will
usually appear in the Introduction or Literature Review)? You
can simply list the major topics that are discussed as part of the
background for this study.
3. What is the research Methodology? How were the data
collected? If appropriate, include a description of the subjects,
location/setting, procedures, and a description of any
instruments (such as a questionnaire) that were used. Also,
discuss any potential limitations to this study (there are
generally two types of limitations: some related to the validity
of the study (that is, are the researchers able to collect accurate
data? Are they measuring what they need to in order to answer
the research question? Are there any threats to the accuracy of
the study?) and some are related to the ability of the research to
be generalized to other settings (that is, if the study was
conducted in New York City, are the results likely to be
applicable to Los Angeles? Denver? Fresno?).
4. What are the most important findings/Results?
5. What are the most important Conclusions? What did the
authors learn?

More Related Content

Similar to httpfmx.sagepub.comField Methods DOI 10.117715258.docx

Advantages And Disadvantages Of Internet Research Surveys Evidence From The ...
Advantages And Disadvantages Of Internet Research Surveys  Evidence From The ...Advantages And Disadvantages Of Internet Research Surveys  Evidence From The ...
Advantages And Disadvantages Of Internet Research Surveys Evidence From The ...Charlie Congdon
 
11.the questionnaire allergy among business executives in ghana
11.the questionnaire allergy among business executives in ghana11.the questionnaire allergy among business executives in ghana
11.the questionnaire allergy among business executives in ghanaAlexander Decker
 
EAPP-Q2-Report (1).pdf
EAPP-Q2-Report (1).pdfEAPP-Q2-Report (1).pdf
EAPP-Q2-Report (1).pdfEuannMagtibay
 
Critical Analysis Survey Design
Critical Analysis Survey DesignCritical Analysis Survey Design
Critical Analysis Survey DesignNicole Brown
 
Running head THE ADVANTAGES AND DISADVANTAGES OF SURVEYS.docx
Running head THE ADVANTAGES AND DISADVANTAGES OF SURVEYS.docxRunning head THE ADVANTAGES AND DISADVANTAGES OF SURVEYS.docx
Running head THE ADVANTAGES AND DISADVANTAGES OF SURVEYS.docxtoltonkendal
 
1. short answer question(200 words) [required] roger s. pr
1. short answer question(200 words) [required] roger s. pr1. short answer question(200 words) [required] roger s. pr
1. short answer question(200 words) [required] roger s. prjasmin849794
 
What's Trending In Higher Ed Tracking
What's Trending In Higher Ed TrackingWhat's Trending In Higher Ed Tracking
What's Trending In Higher Ed TrackingMelissa Sullivan
 
Workshop session 10 - Alternatives to CATI (3) address-based sampling and pus...
Workshop session 10 - Alternatives to CATI (3) address-based sampling and pus...Workshop session 10 - Alternatives to CATI (3) address-based sampling and pus...
Workshop session 10 - Alternatives to CATI (3) address-based sampling and pus...The Social Research Centre
 
Improving inferences from poor quality samples
Improving inferences from poor quality samplesImproving inferences from poor quality samples
Improving inferences from poor quality samplesThe Social Research Centre
 
Influence of electronic word of mouth on Consumers Purchase Intention
Influence of electronic word of mouth on Consumers Purchase IntentionInfluence of electronic word of mouth on Consumers Purchase Intention
Influence of electronic word of mouth on Consumers Purchase IntentionNasif Chowdhury
 
Mitigating errors of representation: a practical case study of the University...
Mitigating errors of representation: a practical case study of the University...Mitigating errors of representation: a practical case study of the University...
Mitigating errors of representation: a practical case study of the University...Sonia Whiteley
 

Similar to httpfmx.sagepub.comField Methods DOI 10.117715258.docx (20)

Advantages And Disadvantages Of Internet Research Surveys Evidence From The ...
Advantages And Disadvantages Of Internet Research Surveys  Evidence From The ...Advantages And Disadvantages Of Internet Research Surveys  Evidence From The ...
Advantages And Disadvantages Of Internet Research Surveys Evidence From The ...
 
Mr1480.ch2
Mr1480.ch2Mr1480.ch2
Mr1480.ch2
 
Mr1480.appa
Mr1480.appaMr1480.appa
Mr1480.appa
 
Paper 3 (iftikhar alam)
Paper 3 (iftikhar alam)Paper 3 (iftikhar alam)
Paper 3 (iftikhar alam)
 
Purushoth 72 mr
Purushoth 72 mrPurushoth 72 mr
Purushoth 72 mr
 
11.the questionnaire allergy among business executives in ghana
11.the questionnaire allergy among business executives in ghana11.the questionnaire allergy among business executives in ghana
11.the questionnaire allergy among business executives in ghana
 
EAPP-Q2-Report (1).pdf
EAPP-Q2-Report (1).pdfEAPP-Q2-Report (1).pdf
EAPP-Q2-Report (1).pdf
 
Internet Pilot Paper2
Internet Pilot Paper2Internet Pilot Paper2
Internet Pilot Paper2
 
Mr1480.ch4
Mr1480.ch4Mr1480.ch4
Mr1480.ch4
 
Critical Analysis Survey Design
Critical Analysis Survey DesignCritical Analysis Survey Design
Critical Analysis Survey Design
 
Running head THE ADVANTAGES AND DISADVANTAGES OF SURVEYS.docx
Running head THE ADVANTAGES AND DISADVANTAGES OF SURVEYS.docxRunning head THE ADVANTAGES AND DISADVANTAGES OF SURVEYS.docx
Running head THE ADVANTAGES AND DISADVANTAGES OF SURVEYS.docx
 
Mr1480.ch4
Mr1480.ch4Mr1480.ch4
Mr1480.ch4
 
1. short answer question(200 words) [required] roger s. pr
1. short answer question(200 words) [required] roger s. pr1. short answer question(200 words) [required] roger s. pr
1. short answer question(200 words) [required] roger s. pr
 
What's Trending In Higher Ed Tracking
What's Trending In Higher Ed TrackingWhat's Trending In Higher Ed Tracking
What's Trending In Higher Ed Tracking
 
CRM task 2
CRM task 2CRM task 2
CRM task 2
 
Workshop session 10 - Alternatives to CATI (3) address-based sampling and pus...
Workshop session 10 - Alternatives to CATI (3) address-based sampling and pus...Workshop session 10 - Alternatives to CATI (3) address-based sampling and pus...
Workshop session 10 - Alternatives to CATI (3) address-based sampling and pus...
 
Improving inferences from poor quality samples
Improving inferences from poor quality samplesImproving inferences from poor quality samples
Improving inferences from poor quality samples
 
Influence of electronic word of mouth on Consumers Purchase Intention
Influence of electronic word of mouth on Consumers Purchase IntentionInfluence of electronic word of mouth on Consumers Purchase Intention
Influence of electronic word of mouth on Consumers Purchase Intention
 
Mitigating errors of representation: a practical case study of the University...
Mitigating errors of representation: a practical case study of the University...Mitigating errors of representation: a practical case study of the University...
Mitigating errors of representation: a practical case study of the University...
 
Using Technology for Adolescent Research
Using Technology for Adolescent Research Using Technology for Adolescent Research
Using Technology for Adolescent Research
 

More from pooleavelina

httpswww.azed.govoelaselpsUse this to see the English Lang.docx
httpswww.azed.govoelaselpsUse this to see the English Lang.docxhttpswww.azed.govoelaselpsUse this to see the English Lang.docx
httpswww.azed.govoelaselpsUse this to see the English Lang.docxpooleavelina
 
httpscdnapisec.kaltura.comindex.phpextwidgetpreviewpartner_.docx
httpscdnapisec.kaltura.comindex.phpextwidgetpreviewpartner_.docxhttpscdnapisec.kaltura.comindex.phpextwidgetpreviewpartner_.docx
httpscdnapisec.kaltura.comindex.phpextwidgetpreviewpartner_.docxpooleavelina
 
httpsifes.orgsitesdefaultfilesbrijuni18countryreport_fi.docx
httpsifes.orgsitesdefaultfilesbrijuni18countryreport_fi.docxhttpsifes.orgsitesdefaultfilesbrijuni18countryreport_fi.docx
httpsifes.orgsitesdefaultfilesbrijuni18countryreport_fi.docxpooleavelina
 
httpsiexaminer.orgfake-news-personal-responsibility-must-trump.docx
httpsiexaminer.orgfake-news-personal-responsibility-must-trump.docxhttpsiexaminer.orgfake-news-personal-responsibility-must-trump.docx
httpsiexaminer.orgfake-news-personal-responsibility-must-trump.docxpooleavelina
 
http1500cms.comBECAUSE THIS FORM IS USED BY VARIOUS .docx
http1500cms.comBECAUSE THIS FORM IS USED BY VARIOUS .docxhttp1500cms.comBECAUSE THIS FORM IS USED BY VARIOUS .docx
http1500cms.comBECAUSE THIS FORM IS USED BY VARIOUS .docxpooleavelina
 
httpswww.medicalnewstoday.comarticles323444.phphttpsasco.docx
httpswww.medicalnewstoday.comarticles323444.phphttpsasco.docxhttpswww.medicalnewstoday.comarticles323444.phphttpsasco.docx
httpswww.medicalnewstoday.comarticles323444.phphttpsasco.docxpooleavelina
 
httpstheater.nytimes.com mem theater treview.htmlres=9902e6.docx
httpstheater.nytimes.com mem theater treview.htmlres=9902e6.docxhttpstheater.nytimes.com mem theater treview.htmlres=9902e6.docx
httpstheater.nytimes.com mem theater treview.htmlres=9902e6.docxpooleavelina
 
httpsfitsmallbusiness.comemployee-compensation-planThe pu.docx
httpsfitsmallbusiness.comemployee-compensation-planThe pu.docxhttpsfitsmallbusiness.comemployee-compensation-planThe pu.docx
httpsfitsmallbusiness.comemployee-compensation-planThe pu.docxpooleavelina
 
httpsdoi.org10.11770002764219842624American Behaviora.docx
httpsdoi.org10.11770002764219842624American Behaviora.docxhttpsdoi.org10.11770002764219842624American Behaviora.docx
httpsdoi.org10.11770002764219842624American Behaviora.docxpooleavelina
 
httpsdoi.org10.11770896920516649418Critical Sociology.docx
httpsdoi.org10.11770896920516649418Critical Sociology.docxhttpsdoi.org10.11770896920516649418Critical Sociology.docx
httpsdoi.org10.11770896920516649418Critical Sociology.docxpooleavelina
 
httpsdoi.org10.11770894318420903495Nursing Science Qu.docx
httpsdoi.org10.11770894318420903495Nursing Science Qu.docxhttpsdoi.org10.11770894318420903495Nursing Science Qu.docx
httpsdoi.org10.11770894318420903495Nursing Science Qu.docxpooleavelina
 
httpswww.youtube.comwatchtime_continue=8&v=rFV0aes0vYAN.docx
httpswww.youtube.comwatchtime_continue=8&v=rFV0aes0vYAN.docxhttpswww.youtube.comwatchtime_continue=8&v=rFV0aes0vYAN.docx
httpswww.youtube.comwatchtime_continue=8&v=rFV0aes0vYAN.docxpooleavelina
 
httphps.orgdocumentspregnancy_fact_sheet.pdfhttpswww.docx
httphps.orgdocumentspregnancy_fact_sheet.pdfhttpswww.docxhttphps.orgdocumentspregnancy_fact_sheet.pdfhttpswww.docx
httphps.orgdocumentspregnancy_fact_sheet.pdfhttpswww.docxpooleavelina
 
httpswww.worldbank.orgencountryvietnamoverview---------.docx
httpswww.worldbank.orgencountryvietnamoverview---------.docxhttpswww.worldbank.orgencountryvietnamoverview---------.docx
httpswww.worldbank.orgencountryvietnamoverview---------.docxpooleavelina
 
HTML WEB Page solutionAbout.htmlQuantum PhysicsHomeServicesAbou.docx
HTML WEB Page solutionAbout.htmlQuantum PhysicsHomeServicesAbou.docxHTML WEB Page solutionAbout.htmlQuantum PhysicsHomeServicesAbou.docx
HTML WEB Page solutionAbout.htmlQuantum PhysicsHomeServicesAbou.docxpooleavelina
 
httpswww.huffpost.comentryonline-dating-vs-offline_b_4037867.docx
httpswww.huffpost.comentryonline-dating-vs-offline_b_4037867.docxhttpswww.huffpost.comentryonline-dating-vs-offline_b_4037867.docx
httpswww.huffpost.comentryonline-dating-vs-offline_b_4037867.docxpooleavelina
 
httpswww.vitalsource.comproductscomparative-criminal-justice-.docx
httpswww.vitalsource.comproductscomparative-criminal-justice-.docxhttpswww.vitalsource.comproductscomparative-criminal-justice-.docx
httpswww.vitalsource.comproductscomparative-criminal-justice-.docxpooleavelina
 
httpswww.nationaleatingdisorders.orglearnby-eating-disordera.docx
httpswww.nationaleatingdisorders.orglearnby-eating-disordera.docxhttpswww.nationaleatingdisorders.orglearnby-eating-disordera.docx
httpswww.nationaleatingdisorders.orglearnby-eating-disordera.docxpooleavelina
 
httpswww.youtube.comwatchtime_continue=59&v=Bh_oEYX1zNM&featu.docx
httpswww.youtube.comwatchtime_continue=59&v=Bh_oEYX1zNM&featu.docxhttpswww.youtube.comwatchtime_continue=59&v=Bh_oEYX1zNM&featu.docx
httpswww.youtube.comwatchtime_continue=59&v=Bh_oEYX1zNM&featu.docxpooleavelina
 
httpswww.fbi.govnewspressrelpress-releasesfbi-expects-a-ris.docx
httpswww.fbi.govnewspressrelpress-releasesfbi-expects-a-ris.docxhttpswww.fbi.govnewspressrelpress-releasesfbi-expects-a-ris.docx
httpswww.fbi.govnewspressrelpress-releasesfbi-expects-a-ris.docxpooleavelina
 

More from pooleavelina (20)

httpswww.azed.govoelaselpsUse this to see the English Lang.docx
httpswww.azed.govoelaselpsUse this to see the English Lang.docxhttpswww.azed.govoelaselpsUse this to see the English Lang.docx
httpswww.azed.govoelaselpsUse this to see the English Lang.docx
 
httpscdnapisec.kaltura.comindex.phpextwidgetpreviewpartner_.docx
httpscdnapisec.kaltura.comindex.phpextwidgetpreviewpartner_.docxhttpscdnapisec.kaltura.comindex.phpextwidgetpreviewpartner_.docx
httpscdnapisec.kaltura.comindex.phpextwidgetpreviewpartner_.docx
 
httpsifes.orgsitesdefaultfilesbrijuni18countryreport_fi.docx
httpsifes.orgsitesdefaultfilesbrijuni18countryreport_fi.docxhttpsifes.orgsitesdefaultfilesbrijuni18countryreport_fi.docx
httpsifes.orgsitesdefaultfilesbrijuni18countryreport_fi.docx
 
httpsiexaminer.orgfake-news-personal-responsibility-must-trump.docx
httpsiexaminer.orgfake-news-personal-responsibility-must-trump.docxhttpsiexaminer.orgfake-news-personal-responsibility-must-trump.docx
httpsiexaminer.orgfake-news-personal-responsibility-must-trump.docx
 
http1500cms.comBECAUSE THIS FORM IS USED BY VARIOUS .docx
http1500cms.comBECAUSE THIS FORM IS USED BY VARIOUS .docxhttp1500cms.comBECAUSE THIS FORM IS USED BY VARIOUS .docx
http1500cms.comBECAUSE THIS FORM IS USED BY VARIOUS .docx
 
httpswww.medicalnewstoday.comarticles323444.phphttpsasco.docx
httpswww.medicalnewstoday.comarticles323444.phphttpsasco.docxhttpswww.medicalnewstoday.comarticles323444.phphttpsasco.docx
httpswww.medicalnewstoday.comarticles323444.phphttpsasco.docx
 
httpstheater.nytimes.com mem theater treview.htmlres=9902e6.docx
httpstheater.nytimes.com mem theater treview.htmlres=9902e6.docxhttpstheater.nytimes.com mem theater treview.htmlres=9902e6.docx
httpstheater.nytimes.com mem theater treview.htmlres=9902e6.docx
 
httpsfitsmallbusiness.comemployee-compensation-planThe pu.docx
httpsfitsmallbusiness.comemployee-compensation-planThe pu.docxhttpsfitsmallbusiness.comemployee-compensation-planThe pu.docx
httpsfitsmallbusiness.comemployee-compensation-planThe pu.docx
 
httpsdoi.org10.11770002764219842624American Behaviora.docx
httpsdoi.org10.11770002764219842624American Behaviora.docxhttpsdoi.org10.11770002764219842624American Behaviora.docx
httpsdoi.org10.11770002764219842624American Behaviora.docx
 
httpsdoi.org10.11770896920516649418Critical Sociology.docx
httpsdoi.org10.11770896920516649418Critical Sociology.docxhttpsdoi.org10.11770896920516649418Critical Sociology.docx
httpsdoi.org10.11770896920516649418Critical Sociology.docx
 
httpsdoi.org10.11770894318420903495Nursing Science Qu.docx
httpsdoi.org10.11770894318420903495Nursing Science Qu.docxhttpsdoi.org10.11770894318420903495Nursing Science Qu.docx
httpsdoi.org10.11770894318420903495Nursing Science Qu.docx
 
httpswww.youtube.comwatchtime_continue=8&v=rFV0aes0vYAN.docx
httpswww.youtube.comwatchtime_continue=8&v=rFV0aes0vYAN.docxhttpswww.youtube.comwatchtime_continue=8&v=rFV0aes0vYAN.docx
httpswww.youtube.comwatchtime_continue=8&v=rFV0aes0vYAN.docx
 
httphps.orgdocumentspregnancy_fact_sheet.pdfhttpswww.docx
httphps.orgdocumentspregnancy_fact_sheet.pdfhttpswww.docxhttphps.orgdocumentspregnancy_fact_sheet.pdfhttpswww.docx
httphps.orgdocumentspregnancy_fact_sheet.pdfhttpswww.docx
 
httpswww.worldbank.orgencountryvietnamoverview---------.docx
httpswww.worldbank.orgencountryvietnamoverview---------.docxhttpswww.worldbank.orgencountryvietnamoverview---------.docx
httpswww.worldbank.orgencountryvietnamoverview---------.docx
 
HTML WEB Page solutionAbout.htmlQuantum PhysicsHomeServicesAbou.docx
HTML WEB Page solutionAbout.htmlQuantum PhysicsHomeServicesAbou.docxHTML WEB Page solutionAbout.htmlQuantum PhysicsHomeServicesAbou.docx
HTML WEB Page solutionAbout.htmlQuantum PhysicsHomeServicesAbou.docx
 
httpswww.huffpost.comentryonline-dating-vs-offline_b_4037867.docx
httpswww.huffpost.comentryonline-dating-vs-offline_b_4037867.docxhttpswww.huffpost.comentryonline-dating-vs-offline_b_4037867.docx
httpswww.huffpost.comentryonline-dating-vs-offline_b_4037867.docx
 
httpswww.vitalsource.comproductscomparative-criminal-justice-.docx
httpswww.vitalsource.comproductscomparative-criminal-justice-.docxhttpswww.vitalsource.comproductscomparative-criminal-justice-.docx
httpswww.vitalsource.comproductscomparative-criminal-justice-.docx
 
httpswww.nationaleatingdisorders.orglearnby-eating-disordera.docx
httpswww.nationaleatingdisorders.orglearnby-eating-disordera.docxhttpswww.nationaleatingdisorders.orglearnby-eating-disordera.docx
httpswww.nationaleatingdisorders.orglearnby-eating-disordera.docx
 
httpswww.youtube.comwatchtime_continue=59&v=Bh_oEYX1zNM&featu.docx
httpswww.youtube.comwatchtime_continue=59&v=Bh_oEYX1zNM&featu.docxhttpswww.youtube.comwatchtime_continue=59&v=Bh_oEYX1zNM&featu.docx
httpswww.youtube.comwatchtime_continue=59&v=Bh_oEYX1zNM&featu.docx
 
httpswww.fbi.govnewspressrelpress-releasesfbi-expects-a-ris.docx
httpswww.fbi.govnewspressrelpress-releasesfbi-expects-a-ris.docxhttpswww.fbi.govnewspressrelpress-releasesfbi-expects-a-ris.docx
httpswww.fbi.govnewspressrelpress-releasesfbi-expects-a-ris.docx
 

Recently uploaded

Introduction to ArtificiaI Intelligence in Higher Education
Introduction to ArtificiaI Intelligence in Higher EducationIntroduction to ArtificiaI Intelligence in Higher Education
Introduction to ArtificiaI Intelligence in Higher Educationpboyjonauth
 
MENTAL STATUS EXAMINATION format.docx
MENTAL     STATUS EXAMINATION format.docxMENTAL     STATUS EXAMINATION format.docx
MENTAL STATUS EXAMINATION format.docxPoojaSen20
 
call girls in Kamla Market (DELHI) 🔝 >༒9953330565🔝 genuine Escort Service 🔝✔️✔️
call girls in Kamla Market (DELHI) 🔝 >༒9953330565🔝 genuine Escort Service 🔝✔️✔️call girls in Kamla Market (DELHI) 🔝 >༒9953330565🔝 genuine Escort Service 🔝✔️✔️
call girls in Kamla Market (DELHI) 🔝 >༒9953330565🔝 genuine Escort Service 🔝✔️✔️9953056974 Low Rate Call Girls In Saket, Delhi NCR
 
18-04-UA_REPORT_MEDIALITERAСY_INDEX-DM_23-1-final-eng.pdf
18-04-UA_REPORT_MEDIALITERAСY_INDEX-DM_23-1-final-eng.pdf18-04-UA_REPORT_MEDIALITERAСY_INDEX-DM_23-1-final-eng.pdf
18-04-UA_REPORT_MEDIALITERAСY_INDEX-DM_23-1-final-eng.pdfssuser54595a
 
Interactive Powerpoint_How to Master effective communication
Interactive Powerpoint_How to Master effective communicationInteractive Powerpoint_How to Master effective communication
Interactive Powerpoint_How to Master effective communicationnomboosow
 
Class 11 Legal Studies Ch-1 Concept of State .pdf
Class 11 Legal Studies Ch-1 Concept of State .pdfClass 11 Legal Studies Ch-1 Concept of State .pdf
Class 11 Legal Studies Ch-1 Concept of State .pdfakmcokerachita
 
Presiding Officer Training module 2024 lok sabha elections
Presiding Officer Training module 2024 lok sabha electionsPresiding Officer Training module 2024 lok sabha elections
Presiding Officer Training module 2024 lok sabha electionsanshu789521
 
_Math 4-Q4 Week 5.pptx Steps in Collecting Data
_Math 4-Q4 Week 5.pptx Steps in Collecting Data_Math 4-Q4 Week 5.pptx Steps in Collecting Data
_Math 4-Q4 Week 5.pptx Steps in Collecting DataJhengPantaleon
 
Call Girls in Dwarka Mor Delhi Contact Us 9654467111
Call Girls in Dwarka Mor Delhi Contact Us 9654467111Call Girls in Dwarka Mor Delhi Contact Us 9654467111
Call Girls in Dwarka Mor Delhi Contact Us 9654467111Sapana Sha
 
Software Engineering Methodologies (overview)
Software Engineering Methodologies (overview)Software Engineering Methodologies (overview)
Software Engineering Methodologies (overview)eniolaolutunde
 
Paris 2024 Olympic Geographies - an activity
Paris 2024 Olympic Geographies - an activityParis 2024 Olympic Geographies - an activity
Paris 2024 Olympic Geographies - an activityGeoBlogs
 
KSHARA STURA .pptx---KSHARA KARMA THERAPY (CAUSTIC THERAPY)————IMP.OF KSHARA ...
KSHARA STURA .pptx---KSHARA KARMA THERAPY (CAUSTIC THERAPY)————IMP.OF KSHARA ...KSHARA STURA .pptx---KSHARA KARMA THERAPY (CAUSTIC THERAPY)————IMP.OF KSHARA ...
KSHARA STURA .pptx---KSHARA KARMA THERAPY (CAUSTIC THERAPY)————IMP.OF KSHARA ...M56BOOKSTORE PRODUCT/SERVICE
 
How to Make a Pirate ship Primary Education.pptx
How to Make a Pirate ship Primary Education.pptxHow to Make a Pirate ship Primary Education.pptx
How to Make a Pirate ship Primary Education.pptxmanuelaromero2013
 
Hybridoma Technology ( Production , Purification , and Application )
Hybridoma Technology  ( Production , Purification , and Application  ) Hybridoma Technology  ( Production , Purification , and Application  )
Hybridoma Technology ( Production , Purification , and Application ) Sakshi Ghasle
 
Incoming and Outgoing Shipments in 1 STEP Using Odoo 17
Incoming and Outgoing Shipments in 1 STEP Using Odoo 17Incoming and Outgoing Shipments in 1 STEP Using Odoo 17
Incoming and Outgoing Shipments in 1 STEP Using Odoo 17Celine George
 
Concept of Vouching. B.Com(Hons) /B.Compdf
Concept of Vouching. B.Com(Hons) /B.CompdfConcept of Vouching. B.Com(Hons) /B.Compdf
Concept of Vouching. B.Com(Hons) /B.CompdfUmakantAnnand
 
ECONOMIC CONTEXT - LONG FORM TV DRAMA - PPT
ECONOMIC CONTEXT - LONG FORM TV DRAMA - PPTECONOMIC CONTEXT - LONG FORM TV DRAMA - PPT
ECONOMIC CONTEXT - LONG FORM TV DRAMA - PPTiammrhaywood
 
Crayon Activity Handout For the Crayon A
Crayon Activity Handout For the Crayon ACrayon Activity Handout For the Crayon A
Crayon Activity Handout For the Crayon AUnboundStockton
 

Recently uploaded (20)

Introduction to ArtificiaI Intelligence in Higher Education
Introduction to ArtificiaI Intelligence in Higher EducationIntroduction to ArtificiaI Intelligence in Higher Education
Introduction to ArtificiaI Intelligence in Higher Education
 
MENTAL STATUS EXAMINATION format.docx
MENTAL     STATUS EXAMINATION format.docxMENTAL     STATUS EXAMINATION format.docx
MENTAL STATUS EXAMINATION format.docx
 
call girls in Kamla Market (DELHI) 🔝 >༒9953330565🔝 genuine Escort Service 🔝✔️✔️
call girls in Kamla Market (DELHI) 🔝 >༒9953330565🔝 genuine Escort Service 🔝✔️✔️call girls in Kamla Market (DELHI) 🔝 >༒9953330565🔝 genuine Escort Service 🔝✔️✔️
call girls in Kamla Market (DELHI) 🔝 >༒9953330565🔝 genuine Escort Service 🔝✔️✔️
 
18-04-UA_REPORT_MEDIALITERAСY_INDEX-DM_23-1-final-eng.pdf
18-04-UA_REPORT_MEDIALITERAСY_INDEX-DM_23-1-final-eng.pdf18-04-UA_REPORT_MEDIALITERAСY_INDEX-DM_23-1-final-eng.pdf
18-04-UA_REPORT_MEDIALITERAСY_INDEX-DM_23-1-final-eng.pdf
 
Interactive Powerpoint_How to Master effective communication
Interactive Powerpoint_How to Master effective communicationInteractive Powerpoint_How to Master effective communication
Interactive Powerpoint_How to Master effective communication
 
9953330565 Low Rate Call Girls In Rohini Delhi NCR
9953330565 Low Rate Call Girls In Rohini  Delhi NCR9953330565 Low Rate Call Girls In Rohini  Delhi NCR
9953330565 Low Rate Call Girls In Rohini Delhi NCR
 
Class 11 Legal Studies Ch-1 Concept of State .pdf
Class 11 Legal Studies Ch-1 Concept of State .pdfClass 11 Legal Studies Ch-1 Concept of State .pdf
Class 11 Legal Studies Ch-1 Concept of State .pdf
 
Presiding Officer Training module 2024 lok sabha elections
Presiding Officer Training module 2024 lok sabha electionsPresiding Officer Training module 2024 lok sabha elections
Presiding Officer Training module 2024 lok sabha elections
 
_Math 4-Q4 Week 5.pptx Steps in Collecting Data
_Math 4-Q4 Week 5.pptx Steps in Collecting Data_Math 4-Q4 Week 5.pptx Steps in Collecting Data
_Math 4-Q4 Week 5.pptx Steps in Collecting Data
 
Call Girls in Dwarka Mor Delhi Contact Us 9654467111
Call Girls in Dwarka Mor Delhi Contact Us 9654467111Call Girls in Dwarka Mor Delhi Contact Us 9654467111
Call Girls in Dwarka Mor Delhi Contact Us 9654467111
 
Software Engineering Methodologies (overview)
Software Engineering Methodologies (overview)Software Engineering Methodologies (overview)
Software Engineering Methodologies (overview)
 
Paris 2024 Olympic Geographies - an activity
Paris 2024 Olympic Geographies - an activityParis 2024 Olympic Geographies - an activity
Paris 2024 Olympic Geographies - an activity
 
KSHARA STURA .pptx---KSHARA KARMA THERAPY (CAUSTIC THERAPY)————IMP.OF KSHARA ...
KSHARA STURA .pptx---KSHARA KARMA THERAPY (CAUSTIC THERAPY)————IMP.OF KSHARA ...KSHARA STURA .pptx---KSHARA KARMA THERAPY (CAUSTIC THERAPY)————IMP.OF KSHARA ...
KSHARA STURA .pptx---KSHARA KARMA THERAPY (CAUSTIC THERAPY)————IMP.OF KSHARA ...
 
How to Make a Pirate ship Primary Education.pptx
How to Make a Pirate ship Primary Education.pptxHow to Make a Pirate ship Primary Education.pptx
How to Make a Pirate ship Primary Education.pptx
 
Hybridoma Technology ( Production , Purification , and Application )
Hybridoma Technology  ( Production , Purification , and Application  ) Hybridoma Technology  ( Production , Purification , and Application  )
Hybridoma Technology ( Production , Purification , and Application )
 
Incoming and Outgoing Shipments in 1 STEP Using Odoo 17
Incoming and Outgoing Shipments in 1 STEP Using Odoo 17Incoming and Outgoing Shipments in 1 STEP Using Odoo 17
Incoming and Outgoing Shipments in 1 STEP Using Odoo 17
 
TataKelola dan KamSiber Kecerdasan Buatan v022.pdf
TataKelola dan KamSiber Kecerdasan Buatan v022.pdfTataKelola dan KamSiber Kecerdasan Buatan v022.pdf
TataKelola dan KamSiber Kecerdasan Buatan v022.pdf
 
Concept of Vouching. B.Com(Hons) /B.Compdf
Concept of Vouching. B.Com(Hons) /B.CompdfConcept of Vouching. B.Com(Hons) /B.Compdf
Concept of Vouching. B.Com(Hons) /B.Compdf
 
ECONOMIC CONTEXT - LONG FORM TV DRAMA - PPT
ECONOMIC CONTEXT - LONG FORM TV DRAMA - PPTECONOMIC CONTEXT - LONG FORM TV DRAMA - PPT
ECONOMIC CONTEXT - LONG FORM TV DRAMA - PPT
 
Crayon Activity Handout For the Crayon A
Crayon Activity Handout For the Crayon ACrayon Activity Handout For the Crayon A
Crayon Activity Handout For the Crayon A
 

httpfmx.sagepub.comField Methods DOI 10.117715258.docx

  • 1. http://fmx.sagepub.com Field Methods DOI: 10.1177/1525822X04269550 2005; 17; 30 Field Methods Don A. Dillman and Leah Melani Christian Survey Mode as a Source of Instability in Responses across Surveys http://fmx.sagepub.com/cgi/content/abstract/17/1/30 The online version of this article can be found at: Published by: http://www.sagepublications.com can be found at:Field Methods Additional services and information for http://fmx.sagepub.com/cgi/alerts Email Alerts: http://fmx.sagepub.com/subscriptions Subscriptions: http://www.sagepub.com/journalsReprints.navReprints: http://www.sagepub.com/journalsPermissions.navPermissions: http://fmx.sagepub.com/cgi/content/refs/17/1/30 Citations at SAGE Publications on September 9, 2009
  • 2. http://fmx.sagepub.comDownloaded from http://fmx.sagepub.com/cgi/alerts http://fmx.sagepub.com/subscriptions http://www.sagepub.com/journalsReprints.nav http://www.sagepub.com/journalsPermissions.nav http://fmx.sagepub.com/cgi/content/refs/17/1/30 http://fmx.sagepub.com 10.1177/1525822X04269550FIELD METHODSDillman, Christian / SURVEY MODE AS SOURCE OF INSTABILITY Survey Mode as a Source of Instability in Responses across Surveys DON A. DILLMAN LEAH MELANI CHRISTIAN Washington State University Changes in survey mode for conducting panel surveys may contribute significantly to survey error. This article explores the causes and consequences of such changes in survey mode. The authors describe how and why the choice of survey mode often causes changes to be made to the wording of questions, as well as the reasons that identically worded questions often produce different answers when administered through different modes. The authors provide evidence that answers may change as a result of different visual layouts for otherwise identical questions and suggest ways to keep measurement the same despite changes in survey mode.
  • 3. Keywords: survey mode; questionnaire; panel survey; measurement; survey error Most panel studies require measurement of the same variables at different times. Often, participants are asked questions, several days, weeks, months, or years apart to measure change in some characteristics of interest to the investigation. These characteristics might include political attitudes, satis- faction with a health care provider, frequency of a behavior, ownership of financial resources, or level of educational attainment. Whatever the charac- teristic of interest, it is important that the question used to ascertain it perform the same across multiple data collections. In addition, declining survey response rates, particularly for telephone surveys, have encouraged researchers to use multiple modes of data collec- tion during the administration of a single cross-sectional survey. Encouraged by the availability of more survey modes than in the past and evidence that a change in modes produces higher response rates (Dillman 2002), surveyors This is a revision of a paper presented at the Workshop on Stability of Methods for Collecting, Analyzing and Managing Panel Data, American Academy of Arts and Sciences, Cambridge, Massachusetts, March 26–28, 2003. This research was financed in part by funds provided to
  • 4. Washington State University under a Cooperative Agreement with the USDA-National Agricul- tural Statistics Service supported by the National Science Foundation Division of Science Resource Statistics. Field Methods, Vol. 17, No. 1, February 2005 30–52 DOI: 10.1177/1525822X04269550 © 2005 Sage Publications 30 at SAGE Publications on September 9, 2009 http://fmx.sagepub.comDownloaded from http://fmx.sagepub.com are increasingly using mixed-mode methods to collect information from their respondents. Considerable evidence now exists that the choice of survey mode affects respondents’ answers to survey questions that are worded the same (e.g., de Leeuw and Van Der Zowen 1988; Dillman et al. 1996; Fowler, Roman, and Di 1998). This means that differences in answers to some survey questions between Time 1 and Time 2 may be the result of mode change rather than an actual difference in the behavior or opinion of interest. In addition, Internet and Interactive Voice Response (voice or touchtone data entry by telephone
  • 5. in response to prerecorded interview questions and instructions, hereafter IVR) modes of collecting data are now taking their places beside the traditional alternatives of mail, telephone, face-to-face, and group self- administration modes. Both of these new methodologies introduce the possibility of mode effects that are not yet well understood. Our purpose in this article is to discuss why mode changes are increas- ingly likely to occur in panel studies and the consequences of those changes. We review the nature of likely mode differences and the reasons for their occurrence and make suggestions for how differences in answers between modes might be reduced. In addition, we present evidence that suggests that within-mode differences may result from variations in the visual layout of questions used in both mail and Web surveys. Such changes may also have an impact on comparisons between visual and aural modes of surveying. WHY MODE OF DATA COLLECTION OFTEN CHANGES Mode change happens frequently in panel studies after the initial wave of data collection. Decisions to change mode are often made with little consid- eration of whether such changes might influence substantive answers to the
  • 6. survey questions. Several reasons may explain the desire to switch modes for subsequent data collections. First, the locations of panel respondents often change between data col- lections. Some panel surveys extend over many years, or even decades. For example, students who initially responded to a paper survey in a classroom cannot easily be reassembled several years later for follow-up contacts. Thus, the researchers may decide to survey those respondents by telephone at their new locations. Whereas group administration may be the most cost- effective procedure for the initial wave of data collection, the telephone is likely to be far more efficient for the follow-up. Also, when surveying young people, a face-to-face interview or classroom setting may be the most appro- Dillman, Christian / SURVEY MODE AS SOURCE OF INSTABILITY 31 at SAGE Publications on September 9, 2009 http://fmx.sagepub.comDownloaded from http://fmx.sagepub.com priate survey environment, but as people age they may be better surveyed using postal mail or the Internet.
  • 7. In addition, the introduction of new modes creates new possibilities for conducting surveys. Specifically, the emergence in the 1990s of Internet and IVR provide more ways of contacting and surveying respondents. In many cases, these modes offer substantial cost and speed advantages and may not have been available at the time of initial data collection. Furthermore, when follow-up studies are done, researchers may have either telephone numbers or mailing address information, but not both, so that the method of follow-up is influenced by the kind of contact information available. Traditional contact information (i.e., postal addresses and home telephones) has now expanded to include e-mail addresses and cell phone numbers. In recent years, response rates to traditional modes of surveying, in partic- ular the telephone, appear to be declining. As a result, surveyors have become interested in providing panel members choices so respondents can decide whether to respond by one mode or another. This possibility is encouraged by technological advances, which allow efficient transfer of questionnaire word files from one mode to another. Moreover, the particu- larly low marginal costs of collecting additional questionnaire responses
  • 8. over the Internet are encouraging surveyors to collect as many responses in this manner as possible, saving telephone interviews for those who do not respond. The mode choice for follow-up surveys can often be less restrictive. The coverage and/or sampling procedure constraints necessary for initial data collection may determine the mode of surveying. Household personal inter- view methods are often used for initial data collection because it is necessary to identify truly representative samples of general public populations. For example, the monthly U.S. Current Population Survey, which is relied on to estimate nationwide unemployment rates, depends on the use of face-to-face interviews to contact households and conduct the initial interviews. This sur- vey then switches to telephone interviews for households with telephones to reduce costs. And the influence of the personal preferences of researchers on choosing the follow-up survey mode often makes a difference. Researchers may have little experience with particular modes resulting in a higher comfort level for some survey modes than for others. Also, some organizations have a tradi- tion of doing telephone surveys, whereas other firms have a tradition of
  • 9. working with self-administered methods and choose modes based on their skills and infrastructure. Firm specialization is increasing as new firms emerge that only do Internet or IVR surveys. Some researchers, who desire to 32 FIELD METHODS at SAGE Publications on September 9, 2009 http://fmx.sagepub.comDownloaded from http://fmx.sagepub.com stay on the cutting-edge methodologically, may also choose a new mode in hopes of making a methodological contribution to panel research methods. In recent years, another kind of mode change has emerged, which may create even more complex mode comparison issues. Instead of only chang- ing modes between data collections, surveyors sometimes design individual data-collection efforts that use one mode for some respondents and others for the remaining respondents. An example of this strategy is the National Sur- vey of Earned Graduates, for which data-collection procedures were tested in 1992 (Shettle and Mooney 1999). It began with mail, switched to telephone, and finally relied on face-to-face interviews, each of which added a signifi-
  • 10. cant amount to response rates. Modes were similarly mixed in later data col- lections. Thus, not only do some respondents answer by different modes in the initial data collection period than in other periods, the potential also exists for respondents to answer using a variety of modes during later data collections. Intramode differences within data-collection periods may be increasing (Dillman 2002). One reason is the concern that the response rates are lower for some modes than in the past and offering a second mode may help improve them. Another contributor is the widely different costs associated with modes of data collection. For example, if respondents can now be induced to go directly to the Internet, the marginal costs for each additional interview completed in that way may be far less than for any of the other methods. Whereas the costs of providing the opportunity to respond by more than one mode was once substantial, computer software now makes such efforts much less difficult and costly. Thus, a variety of reasons, ranging from personal preferences and the changing nature of the available mode choices to cost considerations, may influence decisions by investigators to switch modes either between or
  • 11. within data collections periods. In addition, changing modes has often been viewed as a minor consideration for deciding how to collect data for panel studies. However, this position needs to be reevaluated. In some instances, changing modes may produce results that provide a false indication of change having occurred between waves of data collection. HOW SURVEY MODE AFFECTS THE WORDING OF QUESTIONS Surprisingly, one of the main reasons for differences in answers to ques- tions when the survey mode is changed is that each mode encourages survey- Dillman, Christian / SURVEY MODE AS SOURCE OF INSTABILITY 33 at SAGE Publications on September 9, 2009 http://fmx.sagepub.comDownloaded from http://fmx.sagepub.com ors to ask questions differently. There are various ways in which question wording is shaped by each survey mode. Face-to-Face Interviews The face-to-face interview is quite flexible, providing the potential to make full use of both visual and aural communication.
  • 12. Researchers who rely on face-to-face procedures are able to use long, complex scales, with word labels for each of the categories or scale points. To accommodate long ques- tions with many answer choices, show cards are typically used where respon- dents are handed a card with answer choices and asked to choose a category after the interviewer reads the question. Face-to-face interviews also encourage the use of longer questionnaires because once begun, it is often difficult for respondents to terminate the inter- view. The use of open-ended questions for which interviewers can follow-up with additional probes in order to gather more complete and interpretable answers is also encouraged for this survey mode. The presence of an inter- viewer who can read body language as well as respond to silences and incom- plete answers makes it possible to obtain long, complete answers. Telephone Interviews The advent of telephone interviewing in the 1970s produced significant changes in how researchers composed questions. To simplify the interview task, scales were shortened and the wording was frequently limited to anchored endpoints rather than providing a word description for each cate-
  • 13. gory. Thus, a question that might have been asked in a face-to- face interview using a fully labeled scale with response choices of not at all satisfied, slightly satisfied, somewhat satisfied, mostly satisfied, and completely satis- fied would be changed to a 1 to 5 scale, with “the endpoints of 1 being not at all satisfied and 5 being completed satisfied and you can also use any number in between” (Dillman et al. 2001). Complex questions with longer scales are sometimes divided into steps for telephone surveys (Miller 1984). For example, respondents were first asked if they were satisfied, dissatisfied, or somewhere in the middle. Then a follow-up probe for the satisfied and dissatisfied respondents asked whether they were completely, mostly, or somewhat satisfied (or dissatisfied). Those in the middle were asked whether they were closer to being satisfied, dissatis- fied, or right in the middle. Similarly, respondents might be asked whether their income was above or below a given amount, and then asked repeatedly with different amounts to allow the income level to be measured with reasonable precision. 34 FIELD METHODS at SAGE Publications on September 9, 2009 http://fmx.sagepub.comDownloaded from
  • 14. http://fmx.sagepub.com The need to simplify questions for the telephone also led to an increase in the use of screen questions from which the respondent branched different ways depending on their answer. This procedure allowed less information to be communicated in each interviewer utterance, and the respondent was unaware of the extensive and complex branching patterns that resulted. When telephone questionnaire programmers encounter questions with many words and/or answer choices, they often break them into smaller parts so respondents can skip past unnecessary information. The compelling reason for seeking question simplification on the telephone is the reliance entirely on aural communication. The use of telephone interviews also places pressure on researchers to shorten their interviews. Twenty minutes is deemed a long interview for most telephone studies but not for face-to-face interviews. For example, one national survey organization has a policy of not conducting telephone sur- veys that are more than eighteen minutes long. Telephone interviews are also quite similar to face-to-face interviews in
  • 15. certain respects. One important similarity is that both interview methods rely on aural communication. Open-ended questions can be asked in telephone interviews, just as in face-to-face interviews, with follow-up probes being used to get interpretable answers. Both the telephone and face- to-face meth- ods also tend to hide the possibility of certain answers (e.g., “no opinion” or “don’t know” categories) from respondents but instead allow the interviewer to record such answers only when offered by the respondent. Refusals to answer may also be recorded as a separate category. Interactive Voice Response Surveys IVR surveys may use voice technology to recognize spoken answers or require the respondent to enter data using numbers and/or symbols on the telephone’s touchtone keypad (Dillman 2000; Tourangeau, Steiger, and Wil- son 2002). This mode is used with increasing frequency for very brief routine surveys where respondents are highly motivated to respond (e.g., certain employee and customer satisfaction surveys). It has even been tested for pos- sible use as an alternative to the 2010 Decennial Census mail- back form (Stapleton, Norris, and Brady 2003). The early use of IVR surveys has witnessed efforts to make question
  • 16. wording brief, even shorter than in regular telephone surveys. Researchers also seem to be attempting to reduce the lengths of scales, and keep question- naires extremely short. In addition, prerecorded instructions on what the respondent should do if he or she wants to have an item reread, and to Dillman, Christian / SURVEY MODE AS SOURCE OF INSTABILITY 35 at SAGE Publications on September 9, 2009 http://fmx.sagepub.comDownloaded from http://fmx.sagepub.com solve other potential problems, must be developed along with a protocol for their use. Mail Surveys The use of mail surveys has encouraged respondents to write questions in ways that differ from the construction practices for both face- to-face and telephone interviews (Dillman 1978). Many users try to avoid as many branching questions as possible because respondents are prone to making errors when attempting to follow branching instructions (Redline et al. 2003). Thus, instead of asking a series of questions, such as “Do you own or
  • 17. rent a home?” followed by “Do you have a mortgage on this home, or is it owned free and clear?” a mail survey question is likely to ask the question in this manner: “Is the home in which you live: (1) owned free and clear, (2) owned with a mortgage, (3) rented, or (4) occupied under some other arrangement?” The self-administered nature of mail surveys also encourages researchers to use check-all-that-apply questions, rather than asking for a yes or no answer to each of many items on a list as done for interview surveys. Check- all formats are likely to produce fewer affirmative answers than are the yes/ no formats (Rasinski, Mingay, and Bradburn 1994; Dillman et al. 2003). Mail surveys also remove the pressures to shorten questions that are com- mon in telephone surveying. Fully labeled scales with many categories, simi- lar to those used in face-to-face interviews and displayed as show cards, can be used with equal ease in self-administered mail surveys. In addition, users of mail surveys are often discouraged from asking open- ended questions because of the inability to encourage more complete answers by probing or asking additional follow-up questions. This concern often leads to breaking individual open-ended questions into multiple
  • 18. parts. For example, an interviewer can ask for one’s occupation and then probe for enough details to allow for coding. On mail questionnaires, designers may feel compelled to ask a series of questions (e.g., “What is your occupation? What kind of work do you do? Is there a minimal educational requirement? What is the name of the company for which you work?”). Thus, the mail ver- sion tends to explicitly seek information that may or may not have been offered as responses in the open-ended version. Similarly, the use of mail questionnaires also requires that researchers decide what to do with the typically hidden interview categories (i.e., Refused, Don’t Know, No Opinion, or Does Not Apply that are available for use by telephone interview but are not offered to the respondent as part of the question stimulus). Frequently, such categories are left off the mail question- 36 FIELD METHODS at SAGE Publications on September 9, 2009 http://fmx.sagepub.comDownloaded from http://fmx.sagepub.com naire, resulting in respondents skipping the question or leaving it blank in the
  • 19. self-administered survey mode. Alternatively, they may be explicitly listed. Either method changes the stimulus from what is typically provided in telephone or face-to-face interviews. The reliance of mail surveys on visual communication provides a means by which respondents can interpret context and review previously read ques- tions while formulating an answer to later questions. Thus, in certain ways self-administered questionnaires make possible the communication of greater complexity than telephone surveys. At the same time, order effects fre- quently observed in telephone surveys may be reduced (Bishop et al. 1988). Internet Surveys Internet surveys also rely on the use of visual instead of aural communica- tion used in interview surveys. Some similarities exist in how questions are constructed for mail and Internet, but important differences also exist. One difference is that Internet surveys allow the use of audio, video, color, and other dynamic features, which are generally not used in other types of surveys. Internet surveys can be programmed using a page-by-page construction whereby each question is displayed on a different screen or a
  • 20. scrollable dis- play where respondents can scroll through all the questions at once. One of the potential difficulties of using separate screens for each question is a loss of context that is provided in mail surveys because respondents cannot review previous answers and survey designers may wish to keep respondents from being able to go back and change answers to previous questions. How- ever, the inability to go backward may result in respondents getting mentally lost in a closely related series of items (e.g., a series of questions asking about each job held since graduating from college). Check-all-that-apply questions are also used frequently in Internet sur- veys. HTML programming that is employed to construct Internet surveys allows two types of answer category formats to be specified: a set of radio buttons that lets only one choice be marked or HTML boxes that let more than one answer from each group be marked. Check-all-that- apply formats are awkward to ask in an interview and, as noted earlier, are not used in tele- phone surveys. Instead, they are converted to a series of yes/no items, which are likely to result in an increase in the selection of individual items over the check-all-that-apply format (Dillman et al. 2003). Furthermore, Internet sur- veys also allow the use of longer scales with full labeling, as is
  • 21. normally done in mail and face-to-face surveys. Dillman, Christian / SURVEY MODE AS SOURCE OF INSTABILITY 37 at SAGE Publications on September 9, 2009 http://fmx.sagepub.comDownloaded from http://fmx.sagepub.com Branching instructions do not present a significant problem for Web sur- veys inasmuch as when page-by-page construction is used, branching becomes transparent to respondents, much as it is on interview surveys. Internet surveys are also similar to telephone surveys in that longer surveys are typically discouraged and not likely to be tolerated by many respondents. Another similarity to telephone interviews is that item nonresponse, which represents a major concern in mail surveys, can be overcome by program- ming that requires each question to be answered. However, a consequence of this programming may be that it produces respondent frustration and fewer completions (Dillman 2000). WHY RESEARCHERS OFTEN CHANGE QUESTION STRUCTURES FOR FOLLOW-UP MEASUREMENT BY A DIFFERENT MODE
  • 22. It is desirable to keep question wording the same across modes. Yet, changes are often made. Some of them are quite simple, even accidental. For example, an open-ended question was asked in a large-scale national tele- phone survey, “What is your current marital status?” where interviewers were instructed to check the appropriate category based on the response pro- vided. This question was changed for a Web survey so that respondents chose either: “single, married, separated, divorced, or widowed.” The result was to significantly decrease the number of single and married respondents while increasing the percentage that were separated, divorced, and widowed Robert Tortora, personal communication, May 9, 2002). The simple expla- nation is that some respondents may fit appropriately into more than one cat- egory but tend to simplify their response (single or married) unless the addi- tional detail of separated, divorced, or widowed is explicitly offered. Survey designers may change question structure between rounds of data collection in panel studies simply because of a mode change. These changes may occur because of the belief that a different question format will work better for the new survey mode. For example, check-all-that- apply formats
  • 23. used in self-administered questionnaires are frequently converted to a series of yes/no items in telephone interviews because the check-all format is awk- ward if not impossible to ask over the telephone. However, as we discussed earlier, these two formats produce quite different response distributions when asked in self-administered questionnaires. These changes in question structure may happen because a preferred mode of constructing survey questions has evolved for each of the different modes and tends to be shared across organizations. Thus, when questions are 38 FIELD METHODS at SAGE Publications on September 9, 2009 http://fmx.sagepub.comDownloaded from http://fmx.sagepub.com designed, especially in large organizations in which there are specialized units for telephone, face-to-face, Web, mail, and IVR data collection, each unit may have developed a style of question design that they feel is best for their mode. Telephone questionnaire designers are especially sensitive to the problems of length and verbal comprehension. Mail questionnaire designers are especially sensitive to the problems of getting respondents
  • 24. to follow branching instructions. And those who implement particular modes tend to want to avoid situations in which their mode does not perform well. When designing questions for single mode studies, possible differences across mode are rarely discussed. Surveyors who have learned over the years to design for one mode may find it difficult to accept the need to optimize across modes, rather than to maximize efficacy for their own mode. The argument that “this is how telephone (or mail or face-to-face) questions are usually written” often becomes a powerful force when designing survey instruments, and sponsors of panel surveys are often unaware of these consequences. WHY IDENTICALLY WORDED QUESTIONS OFTEN PRODUCE DIFFERENT ANSWERS ACROSS MODES Even if one succeeds in maintaining the same questionnaire stimulus across survey modes, differences in answers may occur. However, mode dif- ferences for identically worded questions are more likely to occur for some types of questions than others. In addition, there are a number of likely causes for these mode differences. Some Questions Are More Subject to Instability
  • 25. across Modes than Are Others Schwarz (1996) argued that the survey process is governed by the conduct of conversation that is used in everyday life and as such respondents act as cooperative communicators trying to make sense of the information pro- vided to them. The interview or questionnaire exhibits many of the same characteristics as a conversation in which the meaning assigned to later items is based on earlier information being transmitted between the respondent and questionnaire sponsor (Schwarz 1996). Thus, respondents actively try to make sense of the survey questions by drawing on all the information the researcher provides, including the context of the survey. Respondents will systematically make use of context information on some questions more so than others. Dillman, Christian / SURVEY MODE AS SOURCE OF INSTABILITY 39 at SAGE Publications on September 9, 2009 http://fmx.sagepub.comDownloaded from http://fmx.sagepub.com When respondents are asked an opinion question such as “How satisfied are you with your choice of careers?” they are being asked a
  • 26. question for which a ready-made answer may not exist. In addition, surveyors are likely to offer a set of vaguely quantified response categories from which to choose (e.g., “Completely satisfied, Mostly satisfied, Fairly satisfied, Slightly satis- fied, Not satisfied”). To answer these questions, the respondent must think about how to respond to the question, including trying to figure out the mean- ing of the response categories to determine the answer that comes closest to expressing their opinion. Thus, the stem of the question and the response cat- egories are important sources of information for respondents, especially when they are answering questions to which they may have not previously formed an answer. In addition, for ordinal scales in which respondents must choose where they fit along an implied continuum, the response categories become very important cues in helping respondents decide how to answer the question. In these types of scalar questions, the meaning of the individual categories (e.g., fairly satisfied) comes in part from the order in which the choices are dis- played or read to the respondent. Thus, respondents draw on information provided in the description of the category (verbal or numeric labels) and its position in relation to other categories.
  • 27. CONTEXT AND ORDER EFFECTS Since respondents are actively making sense of the survey or interview, they may also be affected by the order in which questions are presented. In panel studies, new questions are often added to follow-up surveys to ask respondents about change or differences from the last time they were con- tacted. Whether a question is located before or after certain other questions can affect how respondents answer. Depending on the situation, respondents may decide to include or exclude information when answering a question based on what information they have already provided to the researcher in previous questions (Schwarz 1996). If the previous question has asked about satisfaction with something related to the city or state in which one lives, one’s profession, or even one’s marriage, there may be some carryover effects that influence one’s answers (Schwarz, Strack, and Mai 1991; Schwarz 1996). Thus, questions that use vague quantifiers and require the formulation of an answer on the spot seem more likely to be influenced by context and mode effects. On the other hand, when respondents are asked questions about things that they know precisely, such as their age or date of birth, they hold
  • 28. previously 40 FIELD METHODS at SAGE Publications on September 9, 2009 http://fmx.sagepub.comDownloaded from http://fmx.sagepub.com formulated answers to these types of questions and do not need the categories to help prepare their answer. If categories are provided, the respondents need only to select the response choice that corresponds to their preformulated answer. For the most part, we do not expect that questions on age, gender, whether a home is rented or owned, or others for which respondents carry around obvious answers that they are willing to reveal to others will produce significant changes when asked by a different survey mode. Other Contributors to Mode Differences Researchers have identified many examples of mode differences, as well as many reasons for their occurrence. We provide a brief review of some of the most frequently observed differences (i.e., social desirability, acquies- cence, and primacy/recency effects). Social desirability is the tendency for people to offer responses that are
  • 29. based on the perceived cultural expectations of others (de Leeuw and Van Der Zowen 1988). Such expectations are more likely to influence answers in interview surveys than in those that use self-administration because of the presence of an interviewer. One example is the frequently observed tendency for respondents to give more positive answers when asked to rate their health. In the classic study on this topic, Hochstim (1967) found that in a face-to-face interview, 43% of respondents ranked their health as excellent, whereas 38% did so over the telephone, and only 30% chose that category when asked using a mail survey. Paul Biemer (personal communication, October 18, 2002) found that 15% of a national sample of people over sixty- five ranked their health as very good (the top choice) on a self-administered question- naire, but 27% did so in a follow-up face-to-face interview a month later in which an identically worded question was asked. Since it is a cultural expectation that a person offers a casual “fine” or other positive answer when asked about one’s health, it should not come as a surprise that respondents in an interview survey give somewhat more posi- tive answers than they do in a self-administered questionnaire. Similarly, researchers have shown that respondents to interview surveys are less likely
  • 30. to admit to drug use or other socially undesirable behaviors (DeLeeuw 1992; Fowler, Roman, and Di 1998). Acquiescence is the tendency to agree when interacting with another per- son because, in general, people find it easier to agree than disagree. A limited amount of research has suggested that people are more likely to agree than disagree with questionnaire items such as “Well-groomed individuals make better leaders” in interview surveys. To avoid possible acquiescence, and Dillman, Christian / SURVEY MODE AS SOURCE OF INSTABILITY 41 at SAGE Publications on September 9, 2009 http://fmx.sagepub.comDownloaded from http://fmx.sagepub.com thus mode differences, it has been suggested that questions not be formulated using agree/disagree categories (Schuman and Presser 1981). Recency is the tendency for respondents in interview surveys to choose from the last-offered answer choices, while primacy is the tendency for respon- dents in self-administered surveys to choose from among the first-offered categories. The primacy/recency phenomenon has been noted by a number
  • 31. of authors, notably Krosnick and Alwin (1987). Recency effects were found in telephone surveys conducted by Schuman and Presser (1981). Other authors have also presented evidence supporting the existence of primacy/ recency effects, but their results have not always been consistent. In eighty- four experiments reported by Dillman et al. (1995) that used a variety of question structures, evidence for the existence of primacy on mail surveys and recency on telephone surveys was quite inconsistent. Although the last word has certainly not been written about mode differ- ences, it is apparent that they occur frequently, and the reasons for their occurrences also differ. Much remains to be learned about how mode influ- ences answers to survey questions. IN SEARCH OF SOLUTIONS Just as mode differences do not flow from a single problem, there is no single solution that will facilitate switching modes when conducting panel studies. Rather, there are a set of issues that need to be addressed, some sim- ple, and some of which are much more complex and in need of careful research. Unimode Construction and Its Limitations
  • 32. One way of attempting to limit mode effects is to write survey questions in a manner that will work satisfactorily across different survey modes and to make sure that questions remain exactly the same in later data collections, regardless of modes. Procedures aimed at accomplishing the same stimuli across modes have been described elsewhere as unimode construction (Dillman 2000:ch. 6). An example of unimode construction is to avoid using “don’t know” as an available but unread category in the telephone mode, while preventing its use altogether in mail or Web surveys. Instead, one could make it explicitly available in all modes. Unimode construction also means resisting the temptation to change from an open-ended question in an interview to a close-ended question for a mail follow-up, simply because open-ended questions do not perform as well in such surveys. And if one uses 42 FIELD METHODS at SAGE Publications on September 9, 2009 http://fmx.sagepub.comDownloaded from http://fmx.sagepub.com yes/no formats for interviews, one needs to resist changing to a check-all- that-apply format for paper or Web self-administered surveys.
  • 33. Further, if one asks occupation through a series of mail questions, then one needs to keep the same format for telephone. Unimode construction requires conductors of surveys to use question styles that are different from those generally accepted for the various modes. For example, if one wants to maintain the same stimulus on telephone and face-to-face, they should forego the use of so-called show cards that are often considered standard procedure for face-to-face interviews. Accomplishing unimode construction suggests the need to optimize questionnaire design across modes rather than to maximize for individual modes. However, unimode construction is not a solution to some of the issues noted earlier, notably social desirability and acquiescence. These effects stem from the presence of an interviewer, and despite common wording, tele- phone and face-to-face interviews are likely to produce different answers to such questions than do self-administered questionnaires. In addition, the fact that recency effects have been associated with the verbal presentation of answer categories, while primacy effects are associated with the visual presentation of answers, presents a dilemma to questionnaire designers. It has sometimes been proposed that the answer categories be
  • 34. rotated ran- domly to deal with potential effects, and this may be appropriate for some cross-sectional surveys in which the main objective is to make point esti- mates. However, when applied to a panel survey in which the objective is to measure change between data collections, changing the category order threatens accurate measurement of that change. Thus, one must balance the potential benefits of randomly changing category order with undesirable consequences. The adoption of unimode construction procedures suggest that consider- ation be given to such practices as reducing the length of scales and perhaps avoiding the use of verbal labels for each scale point. Switching to scales having verbal labels only for the endpoints would seem to facilitate their administration over the telephone, where interviewers often struggle to read scale points consistently. However, recent research on the effects of visual design and layout reveals that such attempts at finding commonality in con- struction across modes may be more difficult than it seems. How Visual Design and Layout Affect Respondent Answers It has long been recognized that question meaning in interview surveys does not come from words alone; voice and interviewer effects
  • 35. act as a paralanguage that give additional meaning to questions. These influences Dillman, Christian / SURVEY MODE AS SOURCE OF INSTABILITY 43 at SAGE Publications on September 9, 2009 http://fmx.sagepub.comDownloaded from http://fmx.sagepub.com underlie the occurrence of social desirability and acquiescence effects. Evi- dence is now accumulating that self-administered questionnaires, which depend on visual as opposed to aural processing by the respondent, may also be subject to paralanguage affects. Considerable research has suggested that when surveys are administered visually, respondents draw information from more than words. To determine question meaning, respondents may also draw information from the visual appearance and layout (Smith 1993; Schwarz 1996). It has been proposed that nonverbal languages such as numbers, symbols, and graphical features (such as variations in size, spacing, shapes, and brightness) act as a para- language that gives additional meaning to words (Redline and Dillman 2002).
  • 36. Recent experiments confirm that these nonverbal languages do influence how respondents interpret the meaning of questions and instructions on questionnaires in a wide variety of situations. Redline et al. (2003) found in a large-scale national experiment included in the 2000 Decennial Census that respondent errors in following mail survey branching instructions, which directed them to skip ahead, could be reduced by one-third, from nearly 20% to 13%. This was accomplished through the joint use of additional symbols (arrows), changes in the graphical appearance of the skip instruction (larger, darker font), and an additional word instruction placed at the beginning of the question to be skipped. The design of that experiment did not allow the indi- vidual effects of each change to be measured but did show that combined changes could produce a large reduction in errors. Experimental research indicates that individual manipulations in the visual presentation or layout of questions can influence respondent answers similarly across mail and the Web. These experiments were conducted using random samples of undergraduate students at Washington State University in the spring of 2002 and 2003. The spring 2002 paper survey was conducted by mail using two different versions, and 1,042 students
  • 37. completed the sur- vey, for a response rate of 58%. A total of 1,591 students completed one of four versions of the Web survey conducted in spring 2003, for a response rate of 53%. A $2 incentive was mailed to all students sampled for both the mail and Web survey, and multiple contacts were sent to nonresponders. One set of experiments demonstrated that independent manipulations of symbols and graphics can change respondent answers to paper question- naires (Christian and Dillman 2004). For example, changing the layout of scales from a vertical linear display of categories to a nonlinear display, arranging the same categories so that the first two were in one column, the next two in a column to the right, and the fifth to the right of that column, sig- nificantly affected the response distributions. In addition, changing the dis- 44 FIELD METHODS at SAGE Publications on September 9, 2009 http://fmx.sagepub.comDownloaded from http://fmx.sagepub.com tance between answer spaces, placement of a large arrow (vs. no arrow) that would direct respondents to a subordinate question, and changes
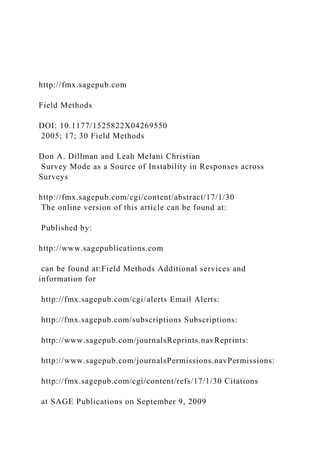
  • 38. in the size of open-ended answer spaces all significantly influenced people’s answers. Another experiment in this study revealed the considerable dependence of respondents on graphical layout for providing meaning to questions and raises additional concerns about possible mode differences. Respondents were asked to answer using a five-point scale with polar point labels that was presented in one of two formats: (1) a linear layout with numbers and boxes for each category and (2) a layout that conveyed information about the scale in the query, but required respondents to put the number of their choice in a box (see Figures 1A and 1B). The latter version removed the graphical and symbolic languages that may have helped communicate the continuum of the scale. Respondents to the number box version gave consistently more nega- tive answers than did respondents to the linearly displayed check box ver- sion. These results are summarized here in Table 1A. Examination of com- pleted questionnaires revealed numerous erasures and answer changes from 1 to 5 and 2 to 4 or vice versa, suggesting that respondents had become con- fused when interpreting the direction of the number box scale, because of the removal of the other supporting languages (Christian and Dillman 2004).
  • 39. Dillman, Christian / SURVEY MODE AS SOURCE OF INSTABILITY 45 FIGURE 1A Question Wording and Formats Compared in Paper and Web Experiments (Mail Experiment) at SAGE Publications on September 9, 2009 http://fmx.sagepub.comDownloaded from http://fmx.sagepub.com A subsequent study repeated this experiment in a Web survey using the same three questions (Christian 2003). The test was also expanded to include a treatment in which the same questions were asked, using the same catego- ries with all five-scale points labeled. As shown in Table 1B, the polar point versus number box comparison results are quite similar to those found for the previous paper experiment. For all three questions in both experiments, the number box produced more negative answers than did the polar point ver- sion. The fully labeled versions produced even more positive answers for two of the three items than did the polar point scale (see Table 1C). 46 FIELD METHODS
  • 40. FIGURE 1B Question Wording and Formats Compared in Paper and Web Experiments (Web Experiment) at SAGE Publications on September 9, 2009 http://fmx.sagepub.comDownloaded from http://fmx.sagepub.com These differences suggest clearly that variations in how a five- point scale is supported by words, numbers, symbols, and graphics can influence answers to scalar satisfaction questions that use visual communication, and Dillman, Christian / SURVEY MODE AS SOURCE OF INSTABILITY 47 TABLE 1A Percentage of Respondents Choosing Each Category in Paper and Web Experiments for the Same Questions (Paper Experiment: Polar Point versus Number Box Comparisons) Question 1 Question 2 Question 3 a Polar Number Polar Number Polar Number Response Point Box Point Box Point Box
  • 41. 1 Very satisfied 15.9 9.8 10.8 6.3 15.2 14.2 2 43.5 29.2 47.6 35.4 31.8 23.8 3 31.0 34.5 31.3 33.8 31.6 29.6 4 7.7 21.3 9.5 20.9 15.4 21.7 5 Very dissatisfied 1.9 5.3 0.8 3.7 5.9 10.7 Total 100 100 100 100 100 100 n 517 513 517 512 506 466 Mean 2.4 2.8 2.4 2.8 2.7 2.9 Difference of means t = 7.7 p = .000 t = 6.9 p = .000 t = 3.5 p = .000 Chi square χ2 = 63.4 p = .000 χ2 = 48.1 p = .000 χ2 = 18.0 p = .001 a. Response categories to this item were 1 (outstanding) to 5 (terrible). TABLE 1B Percentage of Respondents Choosing Each Category in Paper and Web Experiments for the Same Questions (Web Experiment: Polar Point versus Answer Box Comparisons) Question 1 Question 2 Question 3 a Polar Number Polar Number Polar Number Response Point Box Point Box Point Box 1 Very satisfied 19.4 17.2 10.5 6.9 14.0 15.8 2 40.0 32.8 43.6 38.0 29.3 21.8 3 30.6 27.5 35.2 40.4 30.0 31.7 4 8.2 18.5 9.8 12.4 19.0 18.8 5 Very dissatisfied 1.8 4.0 0.9 2.3 7.8 11.9 Total 100 100 100 100 100 100 n 438 302 438 305 437 303 Mean 2.3 2.6 2.5 2.7 2.8 2.9
  • 42. Difference of means t = 3.48 p = .000 t = 2.86 p = .002 t = 1.34 p = .091 Chi-square χ2 = 21.9 p = .000 χ2 = 8.72 p = .068 χ2 = 7.63 p = .106 a. Response categories to this item were 1 (outstanding) to 5 (terrible). at SAGE Publications on September 9, 2009 http://fmx.sagepub.comDownloaded from http://fmx.sagepub.com these features must be taken into account when using the same visual mode across data collections. Removing word support (shifting to a polar point scale) or graphical and symbolic support (shifting to a number box) results in different answers for self-administered visual surveys. These results raise the question of which of these formats may translate most effectively across visual and aural survey modes. An earlier experiment conducted by the Gallup Organization compared answers to similar five-point satisfaction scales using polar point word labels for respondents surveyed by telephone, IVR, Web, and mail (Dillman et al. 2001). In this survey, respondents to the aural modes (telephone and IVR) provided significantly more positive answers, as reflected in greater use of
  • 43. the extreme positive category, than did respondents to the visual modes (Web and mail). These results provide evidence that the polar point scale did not translate equivalently between visual and aural presentation. Whether better equivalency might be achieved between fully labeled questions remains to be seen. SUMMARY AND CONCLUSIONS Mode changes between the initial data-collection period and follow-up data collections for panel studies should be evaluated carefully. There is a 48 FIELD METHODS TABLE 1C Percentage of Respondents Choosing Each Category in Paper and Web Experiments for the Same Questions (Web Experiment: Fully Labeled versus Polar Point Comparisons) Question 1 Question 2 Question 3 a Fully Polar Fully Polar Fully Polar Response Labeled Point Labeled Point Labeled Point 1 Very satisfied 29.3 19.4 14.3 10.5 16.2 14.0 2 50.2 40.0 63.1 43.6 26.3 29.3 3 9.5 30.6 13.4 35.2 26.1 30.0 4 9.2 8.2 8.8 9.8 20.3 19.0
  • 44. 5 Very dissatisfied 1.8 1.8 0.5 0.9 11.1 7.8 Total 100 100 100 100 100 100 n 434 438 434 438 433 437 Mean 2.0 2.3 2.2 2.5 2.8 2.8 Difference of means t = 4.5 p = .000 t = 5.2 p = .000 t = .80 p = .211 Chi square χ2 = 62.6 p = .000 χ2 = 61.6 p = .000 χ2 = 5.27 p = .260 a. Response categories to this item were 1 (outstanding) to 5 (terrible). at SAGE Publications on September 9, 2009 http://fmx.sagepub.comDownloaded from http://fmx.sagepub.com considerable likelihood that such changes make it difficult to accurately measure change between survey waves. Nonetheless, mode changes are common in panel studies and are the result of many considerations from cost and budget concerns to personal and organizational preferences. Fur- thermore, cross-sectional studies that mix modes should also be aware of how the choice of mode may be influencing respondents’ answers to survey questions. Multiple factors may contribute to different measurements being obtained solely as a result of mode change. One of the most frequent causes of change
  • 45. is inadvertent revision in the structure of questions to follow suggested design procedures for one mode. Each mode favors the construction of ques- tions in ways that differ from those favored by each of the other modes. When data collection for panel studies is left to technical staff associated with each mode, it is likely that question structures will be changed. Furthermore, the insertion of new questions for follow-up studies between questions from pre- vious waves may produce unintended order or context effects. A third set of factors that appear to contribute to measurement differences across modes—social desirability, acquiescence, and primacy/recency— present particularly difficult challenges because it may not be possible to completely eliminate these differences, leaving adjustment or indexing as the only solution. The construction of questions to provide a more equivalent stimulus across modes (i.e., unimode construction) seems desirable when conducting mixed-mode surveys. However, to do this will likely require writing ques- tions in ways that optimize their use across all modes rather than allowing what is best (or traditional) for one mode. This may be quite difficult to accomplish in our complex survey world in which there are many different
  • 46. modes to use and established procedures for constructing questions for each mode exist. Recent experimental evidence that the visual presentation of questions can significantly influence people’s answers raises important questions that remain to be answered. The results reported here show that three differ- ent versions of five-point satisfaction questions—polar point labels using a linear scale layout, a number box without visual layout support for answer categories, and a fully labeled scale with verbal labels for each category— produced significantly different answers for each of the layouts. These results suggest that differences in layout within visual modes must also be considered a possible source of measurement error and that research is needed on how various visual representations compare when used in aural modes of surveying. Dillman, Christian / SURVEY MODE AS SOURCE OF INSTABILITY 49 at SAGE Publications on September 9, 2009 http://fmx.sagepub.comDownloaded from http://fmx.sagepub.com Survey researchers face substantial challenges because of the
  • 47. variety of modes from which they can choose. However, the theoretical and empirical work that has been performed thus far offers a rich source of ideas for finding appropriate solutions and directions for future research. The mistake would be to ignore mode, and now visual design effects, as if they did not really matter. REFERENCES Bishop, G. H., H. -J. Hippler, N. Schwarz, and F. Strack. 1988. A comparison of response effects in self-administered and telephone surveys. In Telephone survey methodology, edited by R. M. Groves, P. P. Biemer, L. E. Lyberg, J. T. Massey, W. L. Nicholls II, and J. Waksberg, 321– 40. New York: Wiley-Interscience. Christian, L. M. 2003. The influence of visual layout on scalar questions in web surveys. Mas- ter’s thesis, Washington State University. Christian, L. M., and D. A. Dillman. 2004. The influence of graphical and symbolic language manipulations on responses to self-administered surveys. Public Opinion Quarterly 68 (1): 58–81. de Leeuw, E. 1992. Data quality in mail, telephone, and face-to- face surveys. Amsterdam: TT. de Leeuw, E., and H. Van Der Zowen. 1988. Data quality in telephone and face-to-face surveys:
  • 48. A comparative analysis. In Telephone survey methodology, edited by R. M. Groves, P. Biemer, L. Lyberg, J. T. Massey, W. L. Nicholls II, and J. Waksberg, 283–99. New York: Wiley- Interscience. Dillman, D. A. 1978. Mail and telephone surveys: The total design method. New York: John Wiley. method. New York: John Wiley. ge: Some observations on survey methodology in the early twenty-first century. Public Opinion Quarterly 66:473–94. Dillman, D. A., T. L. Brown, J. Carlson, E. H. Carpenter, F. O. Lorenz, R. Mason, J. Saltiel, and R. L. Sangster. 1995. Effects of category order on answers to mail and telephone surveys. Rural Sociology 60:674–87. Dillman, D. A., G. Phelps, R. Tortora, K. Swift, J. Kohrell, and J. Berck. 2001. Response rate and measurement differences in mixed mode surveys using mail, telephone, interactive voice response and the Internet. Paper presented at the 56th Annual Meeting of the American Asso- ciation for Public Opinion Research, Montreal, May 18. Dillman, D. A., R. Sangster, J. Tarnai, and T. Rockwood. 1996. Understanding differences in people’s answers to telephone and mail surveys. In Current issues in survey research: New
  • 49. directions for program evaluation series, edited by M. T. Braverman and J. K. Slater, 45–62. San Francisco: Jossey-Bass. Dillman, D. A., J. Smyth, L. M. Christian, and M. Stern. 2003. Multiple-answer questions in self- administered surveys: The use of check-all-that-apply and forced-choice question formats. Paper presented at the annual meeting of the American Statistical Association, San Fran- cisco, August 3–7. Fowler, F. J., Jr., A. M. Roman, and Z. X. Di. 1998. Mode effects in a survey of Medicare prostate surgery patients. Public Opinion Quarterly 62:29–46. 50 FIELD METHODS at SAGE Publications on September 9, 2009 http://fmx.sagepub.comDownloaded from http://fmx.sagepub.com Hochstim, J. 1967. A critical comparison of thee strategies of collecting data from households. Journal of the American Statistical Association 62:976–89. Krosnick, J., and D. F. Alwin. 1987. An evaluation of a cognitive theory of response-order effects in survey measurement. Public Opinion Quarterly 51:201–19. Miller, P. 1984. Alternative question forms for attitude scale questions in telephone interviews. Public Opinion Quarterly 48:766–78.
  • 50. Rasinski, K. A., D. Mingay, and N. M. Bradburn. 1994. Do respondents really “mark all that apply” on self-administered questions?” Public Opinion Quarterly 58:400–8. Redline, C. D., and D. A. Dillman. 2002. The influence of alternative visual designs on respon- dents’ performance with branching instructions in self- administered questionnaires. In Sur- vey nonresponse, edited by R. Groves, D. Dillman, J. Eltinge, and R. Little, pp. 179–193. New York: John Wiley. Redline, C. D., D. A. Dillman, A. Dajani, and M. A. Scaggs. 2003. Improving navigational per- formance in U.S. Census 2000 by altering the visually administered languages of branching instructions. Journal of Official Statistics 19 (4): 403–19. Schwarz, N. 1996. Cognition and communication judgmental biases, research methods, and the logic of conversation. Mahwah, NJ: Lawrence Erlbaum. Schwarz, N., F. Strack, and H.-P. Mai. 1991. Assimilation and contrast effects in part-whole question sequences: A conversational logic analysis. Public Opinion Quarterly 55:3–23. Schuman, H., and S. Presser. 1981. Questions and answers in attitude surveys experiments on question form, wording, and context. New York: Academic Press. Shettle, C., and G. Mooney. 1999. Monetary incentives in U.S. government surveys. Journal of
  • 51. Official Statistics 15 (2): 231–50. Smith, T. W. 1993. Little things matter: A sampler of how differences in questionnaire format can affect survey responses. GSS Methodological Report. No. 78. Chicago: National Opin- ion Research Center. Stapleton, C. N., S. Norris, and S. Brady. 2003. Customer satisfaction with Internet and IVR as census data collection tools. Paper presented at the Joint Statistical Meetings, San Francisco, August 6. Tourangeau, R., D. M. Steiger, and D. Wilson. 2002. Self- administered questions by telephone: Evaluating interactive voice response. Public Opinion Quarterly 66 (2): 265–78. DON A. DILLMAN is the Thomas S. Foley Distinguished Professor of Government and Public Policy, Regents’ Professor in the Departments of Sociology and Community and Rural Sociology and deputy director for research of the Social and Economic Sciences Research Center, all at Washington State University. His current research focuses on understanding how alternative question structures and their visual layouts influence respondent answers. Recent publications include “Improving Navigational Perfor- mance in Census 2000 by Altering the Visually Administered Languages of Branching Instructions” (with C. Redline et al. in Journal of Official Statistics, 2003) and an edited book Survey Nonresponse (with R. Groves et al., Wiley-
  • 52. Interscience, 2002). LEAH MELANI CHRISTIAN is a graduate research assistant in the Social and Eco- nomic Sciences Research Center and a doctoral student in the Department of Sociology at Washington State University. Her research interests include social theory and meth- ods, political sociology, and inequality. Recent publications and papers include “The Dillman, Christian / SURVEY MODE AS SOURCE OF INSTABILITY 51 at SAGE Publications on September 9, 2009 http://fmx.sagepub.comDownloaded from http://fmx.sagepub.com Influence of Graphical and Symbolic Language Manipulations on Responses to Self- Administered Surveys” (with D. A. Dillman in Public Opinion Quarterly, 2004) and “The Influence of Visual Layout on Scalar Questions in Web Surveys” (paper presented at the 59th Annual Conference of the American Association for Public Opinion Research, Phoenix, May 15). 52 FIELD METHODS at SAGE Publications on September 9, 2009 http://fmx.sagepub.comDownloaded from http://fmx.sagepub.com
  • 53. 9/22/2019 SafeAssign Originality Report https://ucumberlands.blackboard.com/webapps/mdb-sa- BB5a31b16bb2c48/originalityReportPrint?course_id=_110648_ 1&paperId=2143439390&&atte… 1/9 2326.202010 - FALL 2019 - CRYPTOGRAPHY (ISOL-535-22) - FULL TERM Assignment Week 4 Sai Krishna Kailasapu on Sun, Sep 22 2019, 10:08 AM 97% highest match Submission ID: b69529aa-aa8f-496b-abbd-61b74394a978 Attachments (1) Publickeycryptography.docx 2 1 PUBLIC KEY ENCRYPTION PUBLIC-KEY CRYPTOGRAPHY HAS TURNED INTO A SIGNIFICANT METHOD FOR GUARANTEEING CLASSIFICATION, STRIKINGLY THROUGH ITS UTILIZATION OF KEY CONVEYANCE, WHERE CLIENTS LOOKING FOR PRIVATE CORRESPONDENCE TRADE ENCRYPTION
  • 54. KEYS. 2 IT LIKEWISE INCLUDES ADVANCED MARKS WHICH ENABLE CLIENTS TO SIGN KEYS TO CHECK THEIR CHARACTERS. THESE COMMITMENTS ACQUAINT NEW DEGREES OF SECURITY WITH THE SUBJECT WITH THOUGHTS TO A CYBERATTACKS ATTACKS AND OTHER HACKER SITUATIONS. PUBLIC-KEY ENCRYPTION WITH COMPUTERIZED SIGNATURES OFFERS BOTH SECURITY AND INFORMATION TRUSTWORTHINESS AGAINST GENERAL AGGRESSORS. 3 THE PUBLIC KEY TECHNIQUE COMPRISES OF DISCRETE ENCRYPTION AND UNSCRAMBLING KEYS, WITH CLIENTS POSSIBLY HAVING THE OPTION TO DECODE AN ENCODED MESSAGE ON THE OFF CHANCE THAT THEY HAVE THE FITTING UNSCRAMBLING KEY. 4 CLIENTS WILL TRADE PUBLIC KEYS; (http://safeassign.blackboard.com/) Publickeycryptography.docx
  • 55. Word Count: 588 Attachment ID: 2143439390 97% dzwsdasdasdasasaas http://safeassign.blackboard.com/ 9/22/2019 SafeAssign Originality Report https://ucumberlands.blackboard.com/webapps/mdb-sa- BB5a31b16bb2c48/originalityReportPrint?course_id=_110648_ 1&paperId=2143439390&&atte… 2/9 THIS EXCHANGE SHOULDN'T BE DONE IN A PROTECTED WAY BECAUSE THE ARRIVAL OF PUBLIC KEYS DOESN'T COMPROMISE THE SECURITY OF ANY PRIVATE DATA. 3 AFTER THIS SWAP, SOMEBODY WHO WISHES TO SEND PRIVATE DATA TO ANOTHER CLIENT WILL SCRAMBLE THE INFORMATION WITH THE EXPECTED BENEFICIARY'S PUBLIC KEY AND AFTERWARD GO ALONG THE ENCODED MESSAGE. THE BENEFICIARY, WHO WILL KEEP THEIR PRIVATE KEY SECURE UNDER ANY SITUATION, CAN
  • 56. UTILIZE THE PRIVATE KEY TO UNSCRAMBLE THE ENCODED MESSAGE. STRENGTHS THE UNBALANCED IDEA OF PUBLIC-KEY CRYPTOGRAPHY PERMITS IT A SIZABLE PREFERRED POSITION OVER SYMMETRIC-KEY ALGORITHMS. 5 THE SPECIAL PRIVATE AND PUBLIC KEYS GAVE TO EVERY CLIENT ENABLE THEM TO LEAD SECURE TRADES OF DATA WITHOUT FIRST EXPECTING TO DEVISE SOME APPROACH TO SUBTLY SWAP KEYS. This glaring shortcoming of mystery key cryptography turns into an essential quality of public-key encryption Weaknesses Keys in deviated cryptography are more vulnerable against beast power attacks than covertly key cryptography. 5 THERE EXIST CALCULATIONS FOR PUBLIC-KEY CRYPTOGRAPHY THAT ENABLE ASSAILANTS TO BREAK PRIVATE KEYS QUICKER THAN AN ANIMAL POWER TECHNIQUE WOULD REQUIRE. 3 THE BROADLY UTILIZED AND SPEARHEADING RSA
  • 57. ALGORITHM HAS SUCH A CALCULATION, THAT LEAVES IT VULNERABLE TO ATTACKS IN UNDER BEAST POWER TIME. 5 WHILE PRODUCING LONGER ENTERS IN DIFFERENT CALCULATIONS WILL, FOR THE MOST PART, AVOID AN ANIMAL POWER ATTACK FROM PREVAILING IN ANY IMPORTANT TIME ALLOTMENT, THESE CALCULATIONS BECOME ALL THE MORE COMPUTATIONALLY CONCENTRATED. THESE MORE EXTENDED KEYS CAN, IN ANY CASE, FLUCTUATE IN VIABILITY RELYING UPON THE PROCESSING POWER ACCESSIBLE TO AN ASSAILANT. Public-key cryptography likewise has vulnerabilities to attacks, for example, the man in the centre attack. 3 IN THIS CIRCUMSTANCE, A MALIGNANT OUTSIDER CATCHES A PUBLIC KEY ON ITS APPROACH TO ONE OF THE GATHERINGS IN QUESTION. THE OUTSIDER CAN THEN RATHER GO ALONG THEIR VERY
  • 58. OWN PUBLIC KEY WITH A MESSAGE PROFESSING TO BE FROM THE FIRST SENDER. AN ASSAILANT CAN UTILIZE THIS PROCEDURE AT EACH 9/22/2019 SafeAssign Originality Report https://ucumberlands.blackboard.com/webapps/mdb-sa- BB5a31b16bb2c48/originalityReportPrint?course_id=_110648_ 1&paperId=2143439390&&atte… 3/9 PROGRESSION OF THE TRADE TO EFFECTIVELY IMITATE EVERY INDIVIDUAL FROM THE DISCUSSION WITH NO DIFFERENT GATHERINGS KNOWING ABOUT THIS DOUBLE-DEALING. 6 RECOMMENDATIONS HERZBERG, ET AL. understand the issues introduced by the need of keeping a private key utilized in public-key cryptography mystery for quite a while, and present proactive public key frameworks that require increasingly effective programmer attacks in a shorter timeframe to acquire the private key. References 6 AMIR HERZBERG, MARKUS JAKOBSSON, STANISLŁAW
  • 59. JARECKI, HUGO KRAWCZYK, MOTI YUNG, (1997)"PROACTIVE PUBLIC KEYS AND SIGNATURE SYSTEMS," 7 CONFERENCE ON COMPUTER AND COMMUNICATIONS SECURITY, PP. 100-110 8 MAURIZIO KLIBAN BOYARSKY (1999), "PUBLIC-KEY CRYPTOGRAPHY AND PASSWORD PROTOCOLS: 9 THE MULTI-USER CASE," 8 PROCEEDINGS OF THE 6TH ACM CONFERENCE ON COMPUTER AND COMMUNICATIONS SECURITY CCS '99, NOVEMBER, PP. 63-72. 10 SHAI HALEVI AND HUGO KRAWCZYK (1999), "PUBLIC-KEY CRYPTOGRAPHY AND PASSWORD PROTOCOLS," 11 ACM TRANSACTIONS ON INFORMATION AND SYSTEM SECURITY, AUGUST, PP. 230-268. Citations (11/11) 1 Another student's paper 2 Another student's paper 3 Another student's paper
  • 60. 4 Another student's paper 5 Another student's paper 6 Another student's paper 7 Another student's paper 9/22/2019 SafeAssign Originality Report https://ucumberlands.blackboard.com/webapps/mdb-sa- BB5a31b16bb2c48/originalityReportPrint?course_id=_110648_ 1&paperId=2143439390&&atte… 4/9 Matched Text 8 Another student's paper 9 https://eprint.iacr.org/1999/ 10 Another student's paper 11 Another student's paper Suspected Entry: 86% match Uploaded - Publickeycryptography.docx PUBLIC KEY ENCRYPTION PUBLIC-KEY CRYPTOGRAPHY HAS TURNED INTO A SIGNIFICANT METHOD FOR GUARANTEEING CLASSIFICATION, STRIKINGLY THROUGH ITS UTILIZATION OF KEY CONVEYANCE, WHERE CLIENTS LOOKING FOR PRIVATE
  • 61. CORRESPONDENCE TRADE ENCRYPTION KEYS Source - Another student's paper Public key cryptography has turned into a significant method for guaranteeing classification, outstandingly through its utilization of key dispersion, where clients looking for private correspondence trade encryption keys Suspected Entry: 83% match Uploaded - Publickeycryptography.docx IT LIKEWISE INCLUDES ADVANCED MARKS WHICH ENABLE CLIENTS TO SIGN KEYS TO CHECK THEIR CHARACTERS Source - Another student's paper It likewise includes advanced marks which enable clients to sign keys to confirm their personalities Suspected Entry: 66% match Uploaded - Publickeycryptography.docx THESE COMMITMENTS ACQUAINT NEW DEGREES OF SECURITY WITH THE SUBJECT WITH THOUGHTS TO A CYBERATTACKS ATTACKS AND OTHER HACKER SITUATIONS Source - Another student's paper These commitments acquaint new levels of security with the subject with thoughts to battle man in the center assaults and other programmer situations Suspected Entry: 63% match Uploaded - Publickeycryptography.docx Source - Another
  • 62. student's paper 9/22/2019 SafeAssign Originality Report https://ucumberlands.blackboard.com/webapps/mdb-sa- BB5a31b16bb2c48/originalityReportPrint?course_id=_110648_ 1&paperId=2143439390&&atte… 5/9 PUBLIC-KEY ENCRYPTION WITH COMPUTERIZED SIGNATURES OFFERS BOTH SECURITY AND INFORMATION TRUSTWORTHINESS AGAINST GENERAL AGGRESSORS Open key encryption with advanced marks offers both security and information honesty against generally aggressors Suspected Entry: 81% match Uploaded - Publickeycryptography.docx THE PUBLIC KEY TECHNIQUE COMPRISES OF DISCRETE ENCRYPTION AND UNSCRAMBLING KEYS, WITH CLIENTS POSSIBLY HAVING THE OPTION TO DECODE AN ENCODED MESSAGE ON THE OFF CHANCE THAT THEY HAVE THE FITTING UNSCRAMBLING KEY Source - Another student's paper The creator's open key strategy comprises of independent encryption and unscrambling keys, with clients possibly having the option to decode a scrambled message on the off chance that they have the fitting unscrambling key
  • 63. Suspected Entry: 92% match Uploaded - Publickeycryptography.docx AFTER THIS SWAP, SOMEBODY WHO WISHES TO SEND PRIVATE DATA TO ANOTHER CLIENT WILL SCRAMBLE THE INFORMATION WITH THE EXPECTED BENEFICIARY'S PUBLIC KEY AND AFTERWARD GO ALONG THE ENCODED MESSAGE Source - Another student's paper After this swap, somebody who wishes to send private data to another client will scramble the information with the planned beneficiary's open key and afterward go along the encoded message Suspected Entry: 94% match Uploaded - Publickeycryptography.docx THE BENEFICIARY, WHO WILL KEEP THEIR PRIVATE KEY SECURE UNDER ANY SITUATION, CAN UTILIZE THE PRIVATE KEY TO UNSCRAMBLE THE ENCODED MESSAGE Source - Another student's paper The beneficiary, who will keep their private key secure under any condition, can utilize the private key to unscramble the encoded message Suspected Entry: 72% match Uploaded - Publickeycryptography.docx STRENGTHS THE UNBALANCED IDEA OF PUBLIC-KEY CRYPTOGRAPHY PERMITS IT A SIZABLE PREFERRED POSITION OVER
  • 64. SYMMETRIC-KEY ALGORITHMS Source - Another student's paper The nature of open key cryptography permits it a sizable preferred position over symmetric-key calculations 9/22/2019 SafeAssign Originality Report https://ucumberlands.blackboard.com/webapps/mdb-sa- BB5a31b16bb2c48/originalityReportPrint?course_id=_110648_ 1&paperId=2143439390&&atte… 6/9 Suspected Entry: 69% match Uploaded - Publickeycryptography.docx THE BROADLY UTILIZED AND SPEARHEADING RSA ALGORITHM HAS SUCH A CALCULATION, THAT LEAVES IT VULNERABLE TO ATTACKS IN UNDER BEAST POWER TIME Source - Another student's paper The generally utilized and spearheading RSA calculation has such a calculation, that leaves it powerless to assaults in under animal power time Suspected Entry: 73% match Uploaded - Publickeycryptography.docx IN THIS CIRCUMSTANCE, A MALIGNANT OUTSIDER CATCHES A PUBLIC KEY ON ITS APPROACH TO ONE OF THE GATHERINGS IN QUESTION
  • 65. Source - Another student's paper In this circumstance, a pernicious outsider blocks an open key on its approach to one of the gatherings in question Suspected Entry: 94% match Uploaded - Publickeycryptography.docx THE OUTSIDER CAN THEN RATHER GO ALONG THEIR VERY OWN PUBLIC KEY WITH A MESSAGE PROFESSING TO BE FROM THE FIRST SENDER Source - Another student's paper The outsider can then rather go along their very own open key with a message professing to be from the first sender Suspected Entry: 80% match Uploaded - Publickeycryptography.docx AN ASSAILANT CAN UTILIZE THIS PROCEDURE AT EACH PROGRESSION OF THE TRADE TO EFFECTIVELY IMITATE EVERY INDIVIDUAL FROM THE DISCUSSION WITH NO DIFFERENT GATHERINGS KNOWING ABOUT THIS DOUBLE- DEALING Source - Another student's paper An aggressor can utilize this procedure at each progression of a trade so as to effectively mimic every individual from the discussion with no different gatherings knowing about this trickiness Suspected Entry: 100% match
  • 66. Uploaded - Publickeycryptography.docx CLIENTS WILL TRADE PUBLIC KEYS Source - Another student's paper Clients will trade public keys 9/22/2019 SafeAssign Originality Report https://ucumberlands.blackboard.com/webapps/mdb-sa- BB5a31b16bb2c48/originalityReportPrint?course_id=_110648_ 1&paperId=2143439390&&atte… 7/9 Suspected Entry: 74% match Uploaded - Publickeycryptography.docx THIS EXCHANGE SHOULDN'T BE DONE IN A PROTECTED WAY BECAUSE THE ARRIVAL OF PUBLIC KEYS DOESN'T COMPROMISE THE SECURITY OF ANY PRIVATE DATA Source - Another student's paper this exchange shouldn't be done in a safe way on the grounds that the arrival of open keys does not compromise the security of any private data Suspected Entry: 94% match Uploaded - Publickeycryptography.docx THE SPECIAL PRIVATE AND PUBLIC KEYS GAVE TO EVERY CLIENT ENABLE THEM TO LEAD SECURE TRADES OF DATA WITHOUT FIRST EXPECTING TO DEVISE SOME APPROACH TO SUBTLY SWAP KEYS
  • 67. Source - Another student's paper The one of a kind private and Public Keys gave to every client enable them to lead secure trades of data without first expecting to devise some approach to subtly swap keys Suspected Entry: 77% match Uploaded - Publickeycryptography.docx THERE EXIST CALCULATIONS FOR PUBLIC-KEY CRYPTOGRAPHY THAT ENABLE ASSAILANTS TO BREAK PRIVATE KEYS QUICKER THAN AN ANIMAL POWER TECHNIQUE WOULD REQUIRE Source - Another student's paper There exist calculations for public-key cryptography that enable attackers to break private keys quicker than a brute force strategy would require Suspected Entry: 67% match Uploaded - Publickeycryptography.docx WHILE PRODUCING LONGER ENTERS IN DIFFERENT CALCULATIONS WILL, FOR THE MOST PART, AVOID AN ANIMAL POWER ATTACK FROM PREVAILING IN ANY IMPORTANT TIME ALLOTMENT, THESE CALCULATIONS BECOME ALL THE MORE COMPUTATIONALLY CONCENTRATED Source - Another student's paper While creating longer keys in different calculations will more often than not keep a brute force attack from prevailing in any important time allotment, these calculations turn out to be all the more computationally concentrated
  • 68. Suspected Entry: 62% match Uploaded - Publickeycryptography.docx THESE MORE EXTENDED KEYS CAN, IN ANY CASE, FLUCTUATE IN VIABILITY RELYING UPON Source - Another student's paper These more drawn out keys can at present differ in viability relying upon the registering power accessible 9/22/2019 SafeAssign Originality Report https://ucumberlands.blackboard.com/webapps/mdb-sa- BB5a31b16bb2c48/originalityReportPrint?course_id=_110648_ 1&paperId=2143439390&&atte… 8/9 THE PROCESSING POWER ACCESSIBLE TO AN ASSAILANT to an attacker Suspected Entry: 81% match Uploaded - Publickeycryptography.docx RECOMMENDATIONS HERZBERG, ET AL Source - Another student's paper Herzberg, et al Suspected Entry: 74% match Uploaded - Publickeycryptography.docx AMIR HERZBERG, MARKUS JAKOBSSON,
  • 69. STANISLŁAW JARECKI, HUGO KRAWCZYK, MOTI YUNG, (1997)"PROACTIVE PUBLIC KEYS AND SIGNATURE SYSTEMS," Source - Another student's paper [5] Amir Herzberg, Markus Jakobsson, StanislÅ‚aw Jarecki, Hugo Krawczyk, Moti Yung, “Proactive public keys and signature systems,” Conference on Computer and Communications Security, pp Suspected Entry: 68% match Uploaded - Publickeycryptography.docx CONFERENCE ON COMPUTER AND COMMUNICATIONS SECURITY, PP Source - Another student's paper Proceedings of the 6th ACM Conference on Computer and Communications Security, 1999, pp Suspected Entry: 93% match Uploaded - Publickeycryptography.docx MAURIZIO KLIBAN BOYARSKY (1999), "PUBLIC- KEY CRYPTOGRAPHY AND PASSWORD PROTOCOLS Source - Another student's paper Maurizio Kliban Boyarsky, “Public-key cryptography and password protocols Suspected Entry: 85% match Uploaded - Publickeycryptography.docx PROCEEDINGS OF THE 6TH ACM CONFERENCE ON COMPUTER AND COMMUNICATIONS
  • 70. SECURITY CCS '99, NOVEMBER, PP Source - Another student's paper the multi-user case,” Proceedings of the 6th ACM conference on Computer and communications security CCS '99, November 1999, pp Suspected Entry: 87% match 9/22/2019 SafeAssign Originality Report https://ucumberlands.blackboard.com/webapps/mdb-sa- BB5a31b16bb2c48/originalityReportPrint?course_id=_110648_ 1&paperId=2143439390&&atte… 9/9 Uploaded - Publickeycryptography.docx THE MULTI-USER CASE," Source - https://eprint.iacr.org/1999/ The Multi-User Case Suspected Entry: 72% match Uploaded - Publickeycryptography.docx SHAI HALEVI AND HUGO KRAWCZYK (1999), "PUBLIC-KEY CRYPTOGRAPHY AND PASSWORD PROTOCOLS," Source - Another student's paper [3] Shai Halevi and Hugo Krawczyk, “Public-key cryptography and password protocols,” ACM Transactions on Information and System Security, August 1999, pp
  • 71. Suspected Entry: 84% match Uploaded - Publickeycryptography.docx ACM TRANSACTIONS ON INFORMATION AND SYSTEM SECURITY, AUGUST, PP Source - Another student's paper ACM Transactions on Information and System Security After you read the article, write a short paper (approximately 2- 3 pages, double spaced) that addresses the following questions (please use the same structure, organization, and subheadings in your paper): Reference (APA style): Citation (APA style): 1. What is the Research Question? What interesting and/or important sociological issue is this study trying to solve? 2. What type of Background Information is provided (this will usually appear in the Introduction or Literature Review)? You can simply list the major topics that are discussed as part of the background for this study. 3. What is the research Methodology? How were the data collected? If appropriate, include a description of the subjects, location/setting, procedures, and a description of any instruments (such as a questionnaire) that were used. Also, discuss any potential limitations to this study (there are generally two types of limitations: some related to the validity of the study (that is, are the researchers able to collect accurate data? Are they measuring what they need to in order to answer the research question? Are there any threats to the accuracy of the study?) and some are related to the ability of the research to
  • 72. be generalized to other settings (that is, if the study was conducted in New York City, are the results likely to be applicable to Los Angeles? Denver? Fresno?). 4. What are the most important findings/Results? 5. What are the most important Conclusions? What did the authors learn?