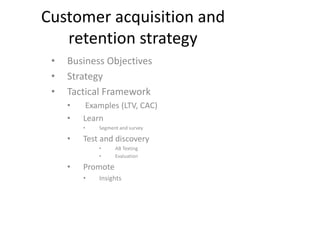
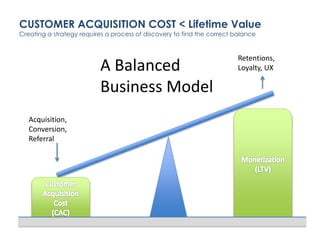
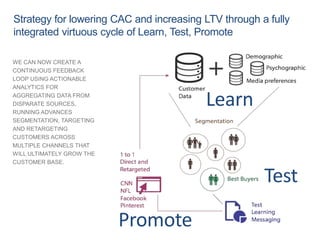
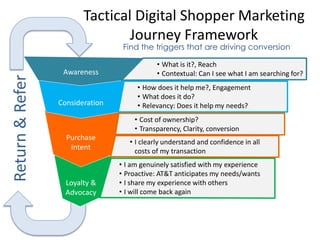
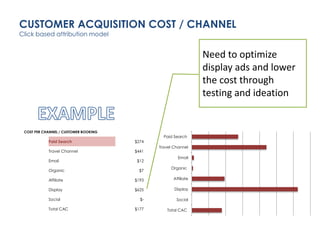
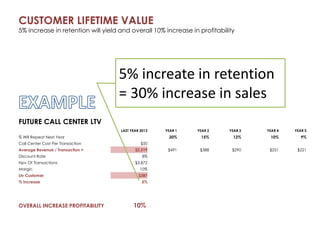
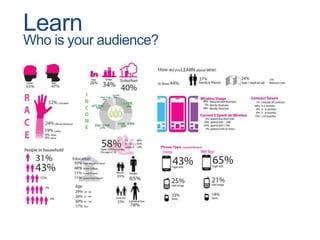
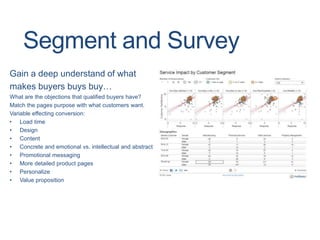
Customer acquisition and 
retention strategy 
• Business Objectives 
• Strategy 
• Tactical Framework 
• Examples (LTV, CAC) 
• Learn 
• Segment and survey 
• Test and discovery 
• AB Texting 
• Evaluation 
• Promote 
• Insights
CUSTOMER ACQUISITION COST < Lifetime Value 
Creating a strategy requires a process of discovery to find the correct balance 
Acquisition, 
Conversion, 
Referral 
Retentions, 
Loyalty, UX 
A Balanced 
Business Model
Strategy for lowering CAC and increasing LTV through a fully 
integrated virtuous cycle of Learn, Test, Promote 
WE CAN NOW CREATE A 
CONTINUOUS FEEDBACK 
LOOP USING ACTIONABLE 
ANALYTICS FOR 
AGGREGATING DATA FROM 
DISPARATE SOURCES, 
RUNNING ADVANCES 
SEGMENTATION, TARGETING 
AND RETARGETING 
CUSTOMERS ACROSS 
MULTIPLE CHANNELS THAT 
WILL ULTIMATELY GROW THE 
CUSTOMER BASE. 
Learn 
Test 
Promote
Return & Refer 
Tactical Digital Shopper Marketing 
Journey Framework 
Awareness 
Consideration 
Purchase 
Intent 
Loyalty & 
Advocacy 
Find the triggers that are driving conversion 
• What is it?, Reach 
• Contextual: Can I see what I am searching for? 
• How does it help me?, Engagement 
• What does it do? 
• Relevancy: Does it help my needs? 
• Cost of ownership? 
• Transparency, Clarity, conversion 
• I clearly understand and confidence in all 
costs of my transaction 
• I am genuinely satisfied with my experience 
• Proactive: AT&T anticipates my needs/wants 
• I share my experience with others 
• I will come back again
CUSTOMER ACQUISITION COST / CHANNEL 
Click based attribution model 
COST PER CHANNEL / CUSTOMER BOOKING 
Paid Search $274 
Travel Channel $441 
Email $12 
Organic $7 
Affiliate $193 
Display $625 
Social $- 
Total CAC $177 
Paid Search 
Travel Channel 
Email 
Organic 
Affiliate 
Display 
Social 
Total CAC 
Need to optimize 
display ads and lower 
the cost through 
testing and ideation
CUSTOMER LIFETIME VALUE 
5% increase in retention will yield and overall 10% increase in profitability 
FUTURE CALL CENTER LTV 
5% increate in retention 
= 30% increase in sales 
LAST YEAR 2013 YEAR 1 YEAR 2 YEAR 3 YEAR 4 YEAR 5 
% Will Repeat Next Year 20% 15% 12% 10% 9% 
Call Center Cost Per Transaction $50 
Average Revenue / Transaction = $2,519 $491 $388 $290 $251 $221 
Discount Rate 8% 
Npv Of Transactions $3,872 
Margin 10% 
Ltv Customer $387 
% Increase 5% 
OVERALL INCREASE PROFITABILITY 10%
Learn 
Who is your audience?
Segment and Survey 
Gain a deep understand of what 
makes buyers buys buy… 
What are the objections that qualified buyers have? 
Match the pages purpose with what customers want. 
Variable effecting conversion: 
• Load time 
• Design 
• Content 
• Concrete and emotional vs. intellectual and abstract 
• Promotional messaging 
• More detailed product pages 
• Personalize 
• Value proposition
9 
Test your messaging strategy against cohorts and segments
Ideate using AB testing and customer feedback: 
A virtuous feedback cycle, test for discovery not just validation 
A – Control 
B – Test - No Hero 
95% 
visitors 
5% 
visitors 
10 © 2014 AT&T Intellectual Property. All rights reserved. AT&T and the AT&T logo are trademarks of AT&T Intellectual Property. 
AT&T Proprietary (Internal Use Only) Not for use or disclosure outside the AT&T companies except under written agreement. 
20% 
conversion 
Goal 
50% 
conversion 
Wireless/home 
Wireless/home 
AB 
Engine
Design the AB Test 
20%Increase in 
34% conversion rate 54% conversion rate 
Control Test 
11 © 2014 AT&T Intellectual Property. All rights reserved. AT&T and the AT&T logo are trademarks of AT&T Intellectual Property. 
AT&T Proprietary (Internal Use Only) Not for use or disclosure outside the AT&T companies except under written agreement. 
conversion rate 
Sometimes making small 
incremental changes can result 
in a big impact on conversion
The value in A/B Testing is learning 
• The Obama campaign used simple multi-variant testing on their donor pages 
which tested many different images, CTAs, and headlines. 
This combination saw an increase of 40% in sign-ups that resulted in 
$60M in incremental donations. 
12 © 2014 AT&T Intellectual Property. All rights reserved. AT&T and the AT&T logo are trademarks of AT&T Intellectual Property. 
AT&T Proprietary (Internal Use Only) Not for use or disclosure outside the AT&T companies except under written agreement.
Digital Marketing and Messaging need to be integrated! 
Strategy drives both marketing ads and landing pages 
Promote
Engagement = Sales
KEY INSIGHTS 
• Seasonal spikes occur in January and August time frame however 
purchasing does occur rear round. 
• People are browsing midday during the middle of the week on a work 
computer, mobile, or table device. 
• Purchasing is occurring in the evening on home computer presumably 
after talking to husband or partner. 
• Purchase consideration may take 2 weeks to one day. However research 
and planning may start 2 or more months prior to purchase. (more 
research required) 
• Consumer skews towards educated females between 25 and 35. 
• Customers are looking for: 
• Ease of use 
• Transparency in Pricing 
• Product focused messaging around needs of the customer
Thank 
You
INDEX
Integration and Tracking 
Track users across all properties and aggregate that behavior tie it back directly 
to the consumer database. 
mobile web offline
CUSTOMER LIFETIME VALUE 
And increase in repeat customers over time from 16% to 20% for call center and from 
6% to 11% for online will yield and overall 10% increase in profitability 
FUTURE CALL CENTER LTV 
LAST YEAR 2013 YEAR 1 YEAR 2 YEAR 3 YEAR 4 YEAR 5 
% Will Repeat Next Year 20% 15% 12% 10% 9% 
Call Center Cost Per Transaction $50 
Average Revenue / Transaction = $2,519 $491 $388 $290 $251 $221 
Discount Rate 8% 
Npv Of Transactions $3,872 
Margin 10% 
Ltv Customer $387 
% Increase 6% 
FUTURE ONLINE LTV 
LAST YEAR 2013 YEAR 1 YEAR 2 YEAR 3 YEAR 4 YEAR 5 
% Will Repeat Next Year 11% 9% 7% 6% 5% 
Average Revenue / Transaction = $2,511 $284 $225 $168 $145 $128 
Discount Rate 8% 
NPV Of Transactions $3,294 
Margin 10% 
LTV Customer $329 
% Increase 12% 
OVERALL INCREASE PROFITABILITY 10%
CURRENT CAC 
New Customer Booking 166,243 
Repeat Customer Booking 26,567 
% total Repeat customers 16% 
Total 192,810 
Total Cost of Acquiring new customers $29,455,647 
Customer Acquisition Cost $177 
FUTURE CAC WITH HIGH REFER 
% New Referral Bookings 5% 
New Referral Customers 8,312 
174,555 
Repeat Customer Booking 30,813 
% Total Repeat Customers 16% 
Total 205,368 
Total Cost Of Acquiring New Customers $29,455,647 
Customer Acquisition Cost $169 
Increase Profitability For Refer 5% 
Total Increase In Profitability Return And 
Refer 
15% 
CUSTOMER ACQUISITION COST 
By increasing referral traffic by 5% we can add more then 8k new customers
EXAMPLES OF AN IMPRESSION BASED ATTRIBUTION 
MODEL (Not CC Data) 
CAC for display 
goes from $320 
to $134
CUSTOMER LIFETIME VALUE 
On average the present value of all customer transitions based on the probability of 
returning 
CALL CENTER LTV 
LAST YEAR 2013 YEAR 1 YEAR 2 YEAR 3 YEAR 4 YEAR 5 
% Will Repeat Next Year 16% 13% 10% 8% 7% 
Call Center Cost Per Transaction $50 
Average Revenue / Transaction = $2,519 $409 $323 $242 $209 $184 
Discount Rate 8% 
NPV of transactions $3,646 
Margin 10% 
LTV Customer $365 
ONLINE LTV 
LAST YEAR 2013 YEAR 1 YEAR 2 YEAR 3 YEAR 4 YEAR 5 
% Will Repeat Next Year 6% 5% 4% 3% 3% 
Average Revenue / Transaction $2,511 $158 $125 $93 $81 $71 
Discount Rate 8% 
NPV Of Transactions $2,946 
Margin 10% 
LTV Customer $295
REVENUE / BOOKING FOR ONLINE AND CALL CENTER 
Online represents about 60% of all revenue vs. 40% for call center. 
Repeat customers are 10% for online and 27% for call center. 
BOTH ONLINE AND CALL CENTER ONLINE ONLY CALL CENTER ONLY 
REVENUE % OF TOTAL % OF TOTAL 
new $419,644,107 $263,374,428 63% $156,269,678 37% 
Repeat $69,023,612 $27,243,472 39% $41,780,140 61% 
Total $488,667,718 $290,617,900 59% $198,049,818 41% 
% repeat 16% 10% 27% 
CUSTOMER BOOKINGS 
new 166,243 105,303 63% 60,940 37% 
Repeat 26,567 10,419 39% 16,148 61% 
Total 192,810 115,722 60% 77,088 40% 
% repeat 16% 10% 26% 
REVENUE / BOOKING 
new $2,524 $2,501 $2,564 
Repeat $2,598 $2,615 $2,587 
Total $2,534 $2,511 $2,569 
% increase $ for repeat 3% 5% 1%
OVERALL COST AND BOOKINGS / CHANNEL 
CLICK BASED ATTRIBUTION MODEL 
Paid Search and Travel represent over 90% of cost. However they account for only 50% 
of bookings. 
COST BY CHANNEL TOTAL 2013 % TOTAL 
Paid Search $14,359,266 49% 
Travel Channel $12,624,935 43% 
Email $428,929 1% 
Organic $265,998 1% 
Affiliate $1,268,523 4% 
Display $507,996 2% 
Social $- 0% 
Total $29,455,647 100% 
WITHOUT DIRECT AND REFERRAL 
TOTAL NEW BOOKING 
Paid Search 52,479 32% 
Travel Channel 28,647 17% 
Email 34,679 21% 
Organic 38,968 23% 
Affiliate 6,564 4% 
Display 813 0% 
Social 4,094 2% 
REPEAT TRANSACTIONS 26,567 
TOTAL NEW 166,243 100% 
Paid Search 
Travel Channel 
Email 
Organic 
Affiliate 
Display 
Social 
Paid Search 
Travel Channel 
Email 
Organic 
Affiliate 
Display 
Social 
Repeat transactions

Customer aquisitionandretentionstrategy v3

  • 1.
    Customer acquisition and retention strategy • Business Objectives • Strategy • Tactical Framework • Examples (LTV, CAC) • Learn • Segment and survey • Test and discovery • AB Texting • Evaluation • Promote • Insights
  • 2.
    CUSTOMER ACQUISITION COST< Lifetime Value Creating a strategy requires a process of discovery to find the correct balance Acquisition, Conversion, Referral Retentions, Loyalty, UX A Balanced Business Model
  • 3.
    Strategy for loweringCAC and increasing LTV through a fully integrated virtuous cycle of Learn, Test, Promote WE CAN NOW CREATE A CONTINUOUS FEEDBACK LOOP USING ACTIONABLE ANALYTICS FOR AGGREGATING DATA FROM DISPARATE SOURCES, RUNNING ADVANCES SEGMENTATION, TARGETING AND RETARGETING CUSTOMERS ACROSS MULTIPLE CHANNELS THAT WILL ULTIMATELY GROW THE CUSTOMER BASE. Learn Test Promote
  • 4.
    Return & Refer Tactical Digital Shopper Marketing Journey Framework Awareness Consideration Purchase Intent Loyalty & Advocacy Find the triggers that are driving conversion • What is it?, Reach • Contextual: Can I see what I am searching for? • How does it help me?, Engagement • What does it do? • Relevancy: Does it help my needs? • Cost of ownership? • Transparency, Clarity, conversion • I clearly understand and confidence in all costs of my transaction • I am genuinely satisfied with my experience • Proactive: AT&T anticipates my needs/wants • I share my experience with others • I will come back again
  • 5.
    CUSTOMER ACQUISITION COST/ CHANNEL Click based attribution model COST PER CHANNEL / CUSTOMER BOOKING Paid Search $274 Travel Channel $441 Email $12 Organic $7 Affiliate $193 Display $625 Social $- Total CAC $177 Paid Search Travel Channel Email Organic Affiliate Display Social Total CAC Need to optimize display ads and lower the cost through testing and ideation
  • 6.
    CUSTOMER LIFETIME VALUE 5% increase in retention will yield and overall 10% increase in profitability FUTURE CALL CENTER LTV 5% increate in retention = 30% increase in sales LAST YEAR 2013 YEAR 1 YEAR 2 YEAR 3 YEAR 4 YEAR 5 % Will Repeat Next Year 20% 15% 12% 10% 9% Call Center Cost Per Transaction $50 Average Revenue / Transaction = $2,519 $491 $388 $290 $251 $221 Discount Rate 8% Npv Of Transactions $3,872 Margin 10% Ltv Customer $387 % Increase 5% OVERALL INCREASE PROFITABILITY 10%
  • 7.
    Learn Who isyour audience?
  • 8.
    Segment and Survey Gain a deep understand of what makes buyers buys buy… What are the objections that qualified buyers have? Match the pages purpose with what customers want. Variable effecting conversion: • Load time • Design • Content • Concrete and emotional vs. intellectual and abstract • Promotional messaging • More detailed product pages • Personalize • Value proposition
  • 9.
    9 Test yourmessaging strategy against cohorts and segments
  • 10.
    Ideate using ABtesting and customer feedback: A virtuous feedback cycle, test for discovery not just validation A – Control B – Test - No Hero 95% visitors 5% visitors 10 © 2014 AT&T Intellectual Property. All rights reserved. AT&T and the AT&T logo are trademarks of AT&T Intellectual Property. AT&T Proprietary (Internal Use Only) Not for use or disclosure outside the AT&T companies except under written agreement. 20% conversion Goal 50% conversion Wireless/home Wireless/home AB Engine
  • 11.
    Design the ABTest 20%Increase in 34% conversion rate 54% conversion rate Control Test 11 © 2014 AT&T Intellectual Property. All rights reserved. AT&T and the AT&T logo are trademarks of AT&T Intellectual Property. AT&T Proprietary (Internal Use Only) Not for use or disclosure outside the AT&T companies except under written agreement. conversion rate Sometimes making small incremental changes can result in a big impact on conversion
  • 12.
    The value inA/B Testing is learning • The Obama campaign used simple multi-variant testing on their donor pages which tested many different images, CTAs, and headlines. This combination saw an increase of 40% in sign-ups that resulted in $60M in incremental donations. 12 © 2014 AT&T Intellectual Property. All rights reserved. AT&T and the AT&T logo are trademarks of AT&T Intellectual Property. AT&T Proprietary (Internal Use Only) Not for use or disclosure outside the AT&T companies except under written agreement.
  • 13.
    Digital Marketing andMessaging need to be integrated! Strategy drives both marketing ads and landing pages Promote
  • 14.
  • 15.
    KEY INSIGHTS •Seasonal spikes occur in January and August time frame however purchasing does occur rear round. • People are browsing midday during the middle of the week on a work computer, mobile, or table device. • Purchasing is occurring in the evening on home computer presumably after talking to husband or partner. • Purchase consideration may take 2 weeks to one day. However research and planning may start 2 or more months prior to purchase. (more research required) • Consumer skews towards educated females between 25 and 35. • Customers are looking for: • Ease of use • Transparency in Pricing • Product focused messaging around needs of the customer
  • 16.
  • 17.
  • 18.
    Integration and Tracking Track users across all properties and aggregate that behavior tie it back directly to the consumer database. mobile web offline
  • 19.
    CUSTOMER LIFETIME VALUE And increase in repeat customers over time from 16% to 20% for call center and from 6% to 11% for online will yield and overall 10% increase in profitability FUTURE CALL CENTER LTV LAST YEAR 2013 YEAR 1 YEAR 2 YEAR 3 YEAR 4 YEAR 5 % Will Repeat Next Year 20% 15% 12% 10% 9% Call Center Cost Per Transaction $50 Average Revenue / Transaction = $2,519 $491 $388 $290 $251 $221 Discount Rate 8% Npv Of Transactions $3,872 Margin 10% Ltv Customer $387 % Increase 6% FUTURE ONLINE LTV LAST YEAR 2013 YEAR 1 YEAR 2 YEAR 3 YEAR 4 YEAR 5 % Will Repeat Next Year 11% 9% 7% 6% 5% Average Revenue / Transaction = $2,511 $284 $225 $168 $145 $128 Discount Rate 8% NPV Of Transactions $3,294 Margin 10% LTV Customer $329 % Increase 12% OVERALL INCREASE PROFITABILITY 10%
  • 20.
    CURRENT CAC NewCustomer Booking 166,243 Repeat Customer Booking 26,567 % total Repeat customers 16% Total 192,810 Total Cost of Acquiring new customers $29,455,647 Customer Acquisition Cost $177 FUTURE CAC WITH HIGH REFER % New Referral Bookings 5% New Referral Customers 8,312 174,555 Repeat Customer Booking 30,813 % Total Repeat Customers 16% Total 205,368 Total Cost Of Acquiring New Customers $29,455,647 Customer Acquisition Cost $169 Increase Profitability For Refer 5% Total Increase In Profitability Return And Refer 15% CUSTOMER ACQUISITION COST By increasing referral traffic by 5% we can add more then 8k new customers
  • 21.
    EXAMPLES OF ANIMPRESSION BASED ATTRIBUTION MODEL (Not CC Data) CAC for display goes from $320 to $134
  • 22.
    CUSTOMER LIFETIME VALUE On average the present value of all customer transitions based on the probability of returning CALL CENTER LTV LAST YEAR 2013 YEAR 1 YEAR 2 YEAR 3 YEAR 4 YEAR 5 % Will Repeat Next Year 16% 13% 10% 8% 7% Call Center Cost Per Transaction $50 Average Revenue / Transaction = $2,519 $409 $323 $242 $209 $184 Discount Rate 8% NPV of transactions $3,646 Margin 10% LTV Customer $365 ONLINE LTV LAST YEAR 2013 YEAR 1 YEAR 2 YEAR 3 YEAR 4 YEAR 5 % Will Repeat Next Year 6% 5% 4% 3% 3% Average Revenue / Transaction $2,511 $158 $125 $93 $81 $71 Discount Rate 8% NPV Of Transactions $2,946 Margin 10% LTV Customer $295
  • 23.
    REVENUE / BOOKINGFOR ONLINE AND CALL CENTER Online represents about 60% of all revenue vs. 40% for call center. Repeat customers are 10% for online and 27% for call center. BOTH ONLINE AND CALL CENTER ONLINE ONLY CALL CENTER ONLY REVENUE % OF TOTAL % OF TOTAL new $419,644,107 $263,374,428 63% $156,269,678 37% Repeat $69,023,612 $27,243,472 39% $41,780,140 61% Total $488,667,718 $290,617,900 59% $198,049,818 41% % repeat 16% 10% 27% CUSTOMER BOOKINGS new 166,243 105,303 63% 60,940 37% Repeat 26,567 10,419 39% 16,148 61% Total 192,810 115,722 60% 77,088 40% % repeat 16% 10% 26% REVENUE / BOOKING new $2,524 $2,501 $2,564 Repeat $2,598 $2,615 $2,587 Total $2,534 $2,511 $2,569 % increase $ for repeat 3% 5% 1%
  • 24.
    OVERALL COST ANDBOOKINGS / CHANNEL CLICK BASED ATTRIBUTION MODEL Paid Search and Travel represent over 90% of cost. However they account for only 50% of bookings. COST BY CHANNEL TOTAL 2013 % TOTAL Paid Search $14,359,266 49% Travel Channel $12,624,935 43% Email $428,929 1% Organic $265,998 1% Affiliate $1,268,523 4% Display $507,996 2% Social $- 0% Total $29,455,647 100% WITHOUT DIRECT AND REFERRAL TOTAL NEW BOOKING Paid Search 52,479 32% Travel Channel 28,647 17% Email 34,679 21% Organic 38,968 23% Affiliate 6,564 4% Display 813 0% Social 4,094 2% REPEAT TRANSACTIONS 26,567 TOTAL NEW 166,243 100% Paid Search Travel Channel Email Organic Affiliate Display Social Paid Search Travel Channel Email Organic Affiliate Display Social Repeat transactions

Editor's Notes

  • #11 Use good ux flow See placement of content between pages 4 and 5
  • #12 Top 5 "Actionable“ Items to Drive CSAT Usability: Ease of Use, Learnability, and Delightful NPS (Net Promoter Score) Minimal Touch Simplicity Empowerment
  • #13 Use good ux flow See placement of content between pages 4 and 5