Downloaded 2,788 times


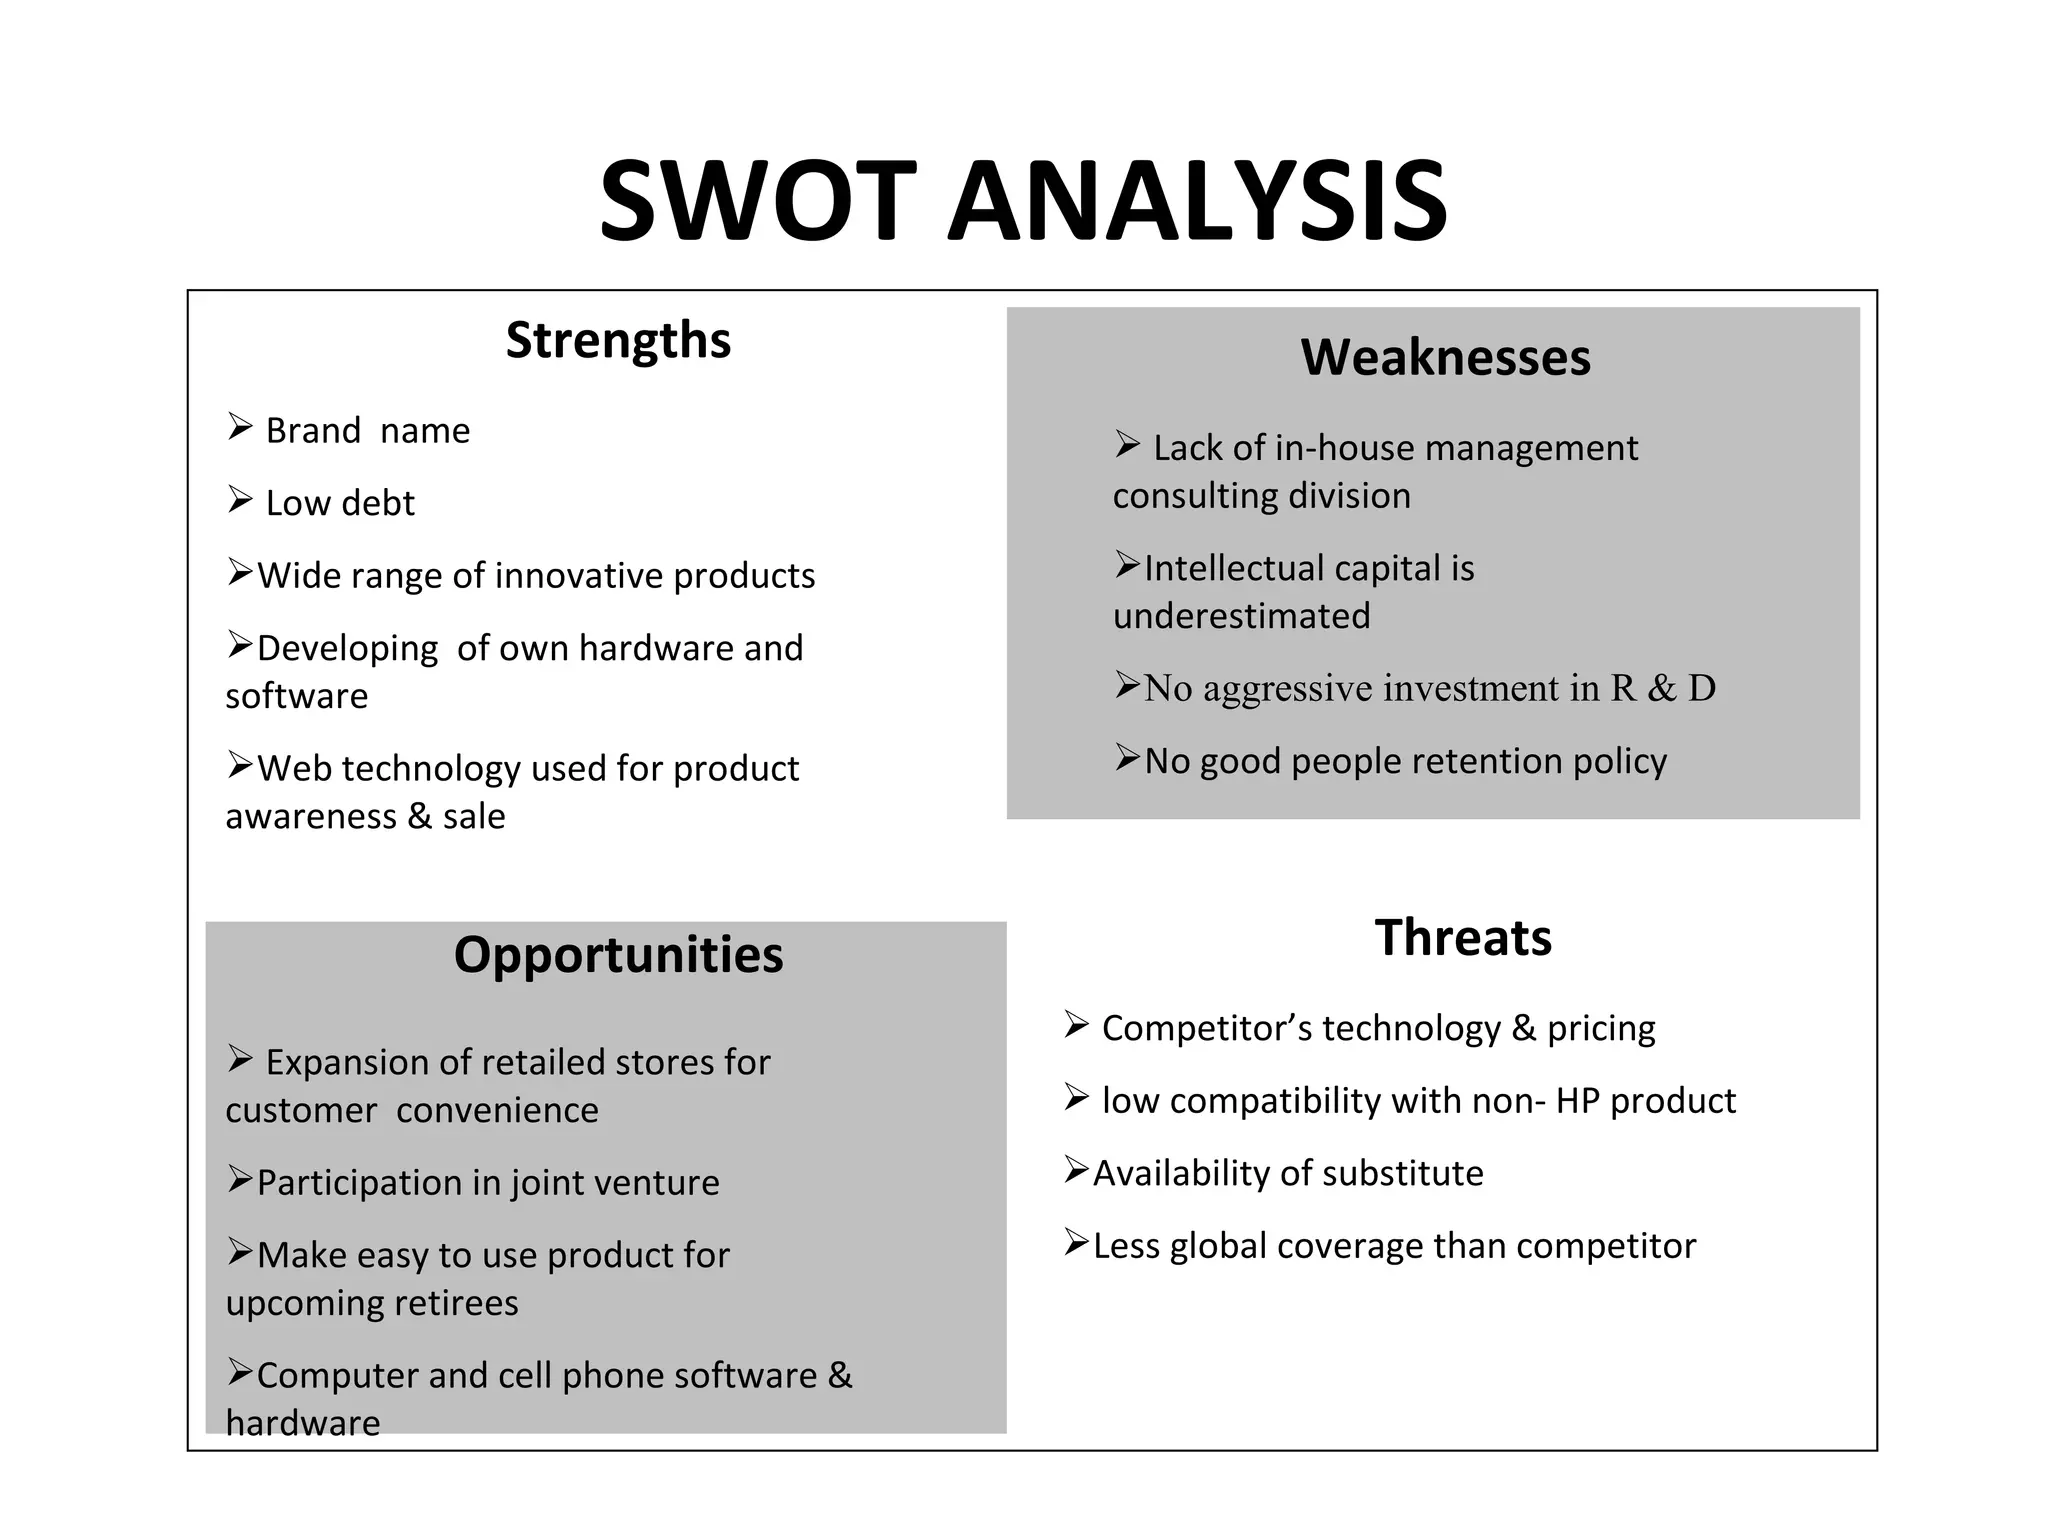


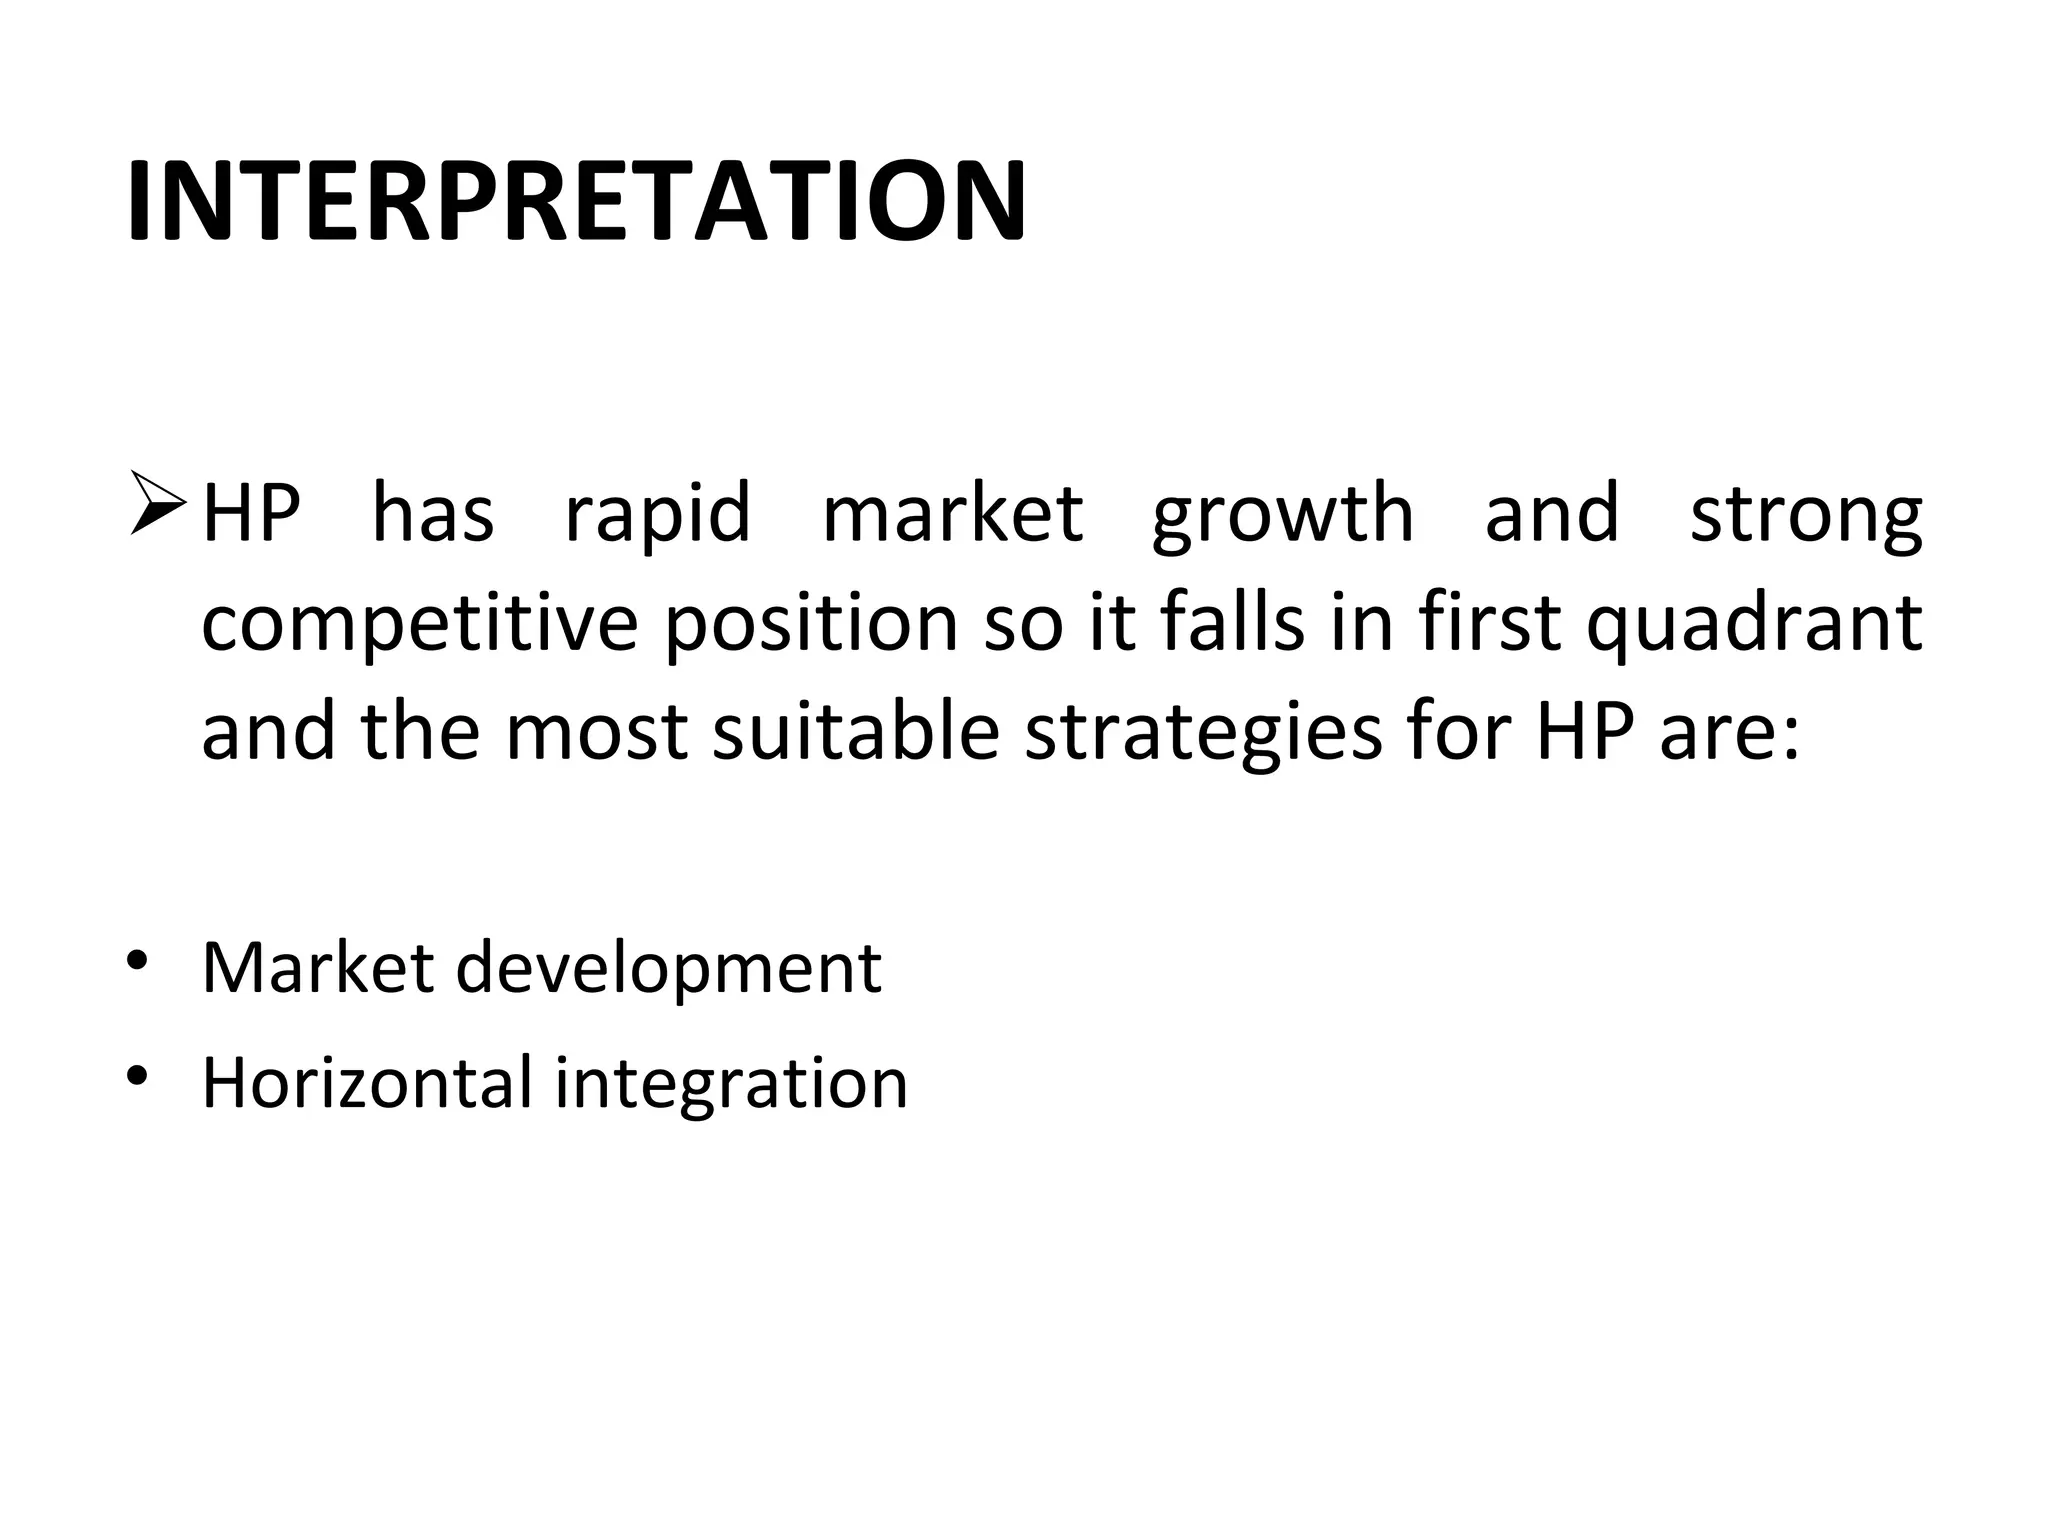


Hewlett Packard Corporation was founded in 1939 by Bill Hewlett and Dave Packard in a garage in Palo Alto, California. HP produces personal computing devices, enterprise servers, storage devices, and printers and imaging products. The document analyzes HP's strategy using various frameworks including SWOT analysis, BCG matrix, IE matrix, and QSPM to recommend the strategic option of horizontal integration for HP to pursue based on its strengths in a rapidly growing market.


