Downloaded 14 times
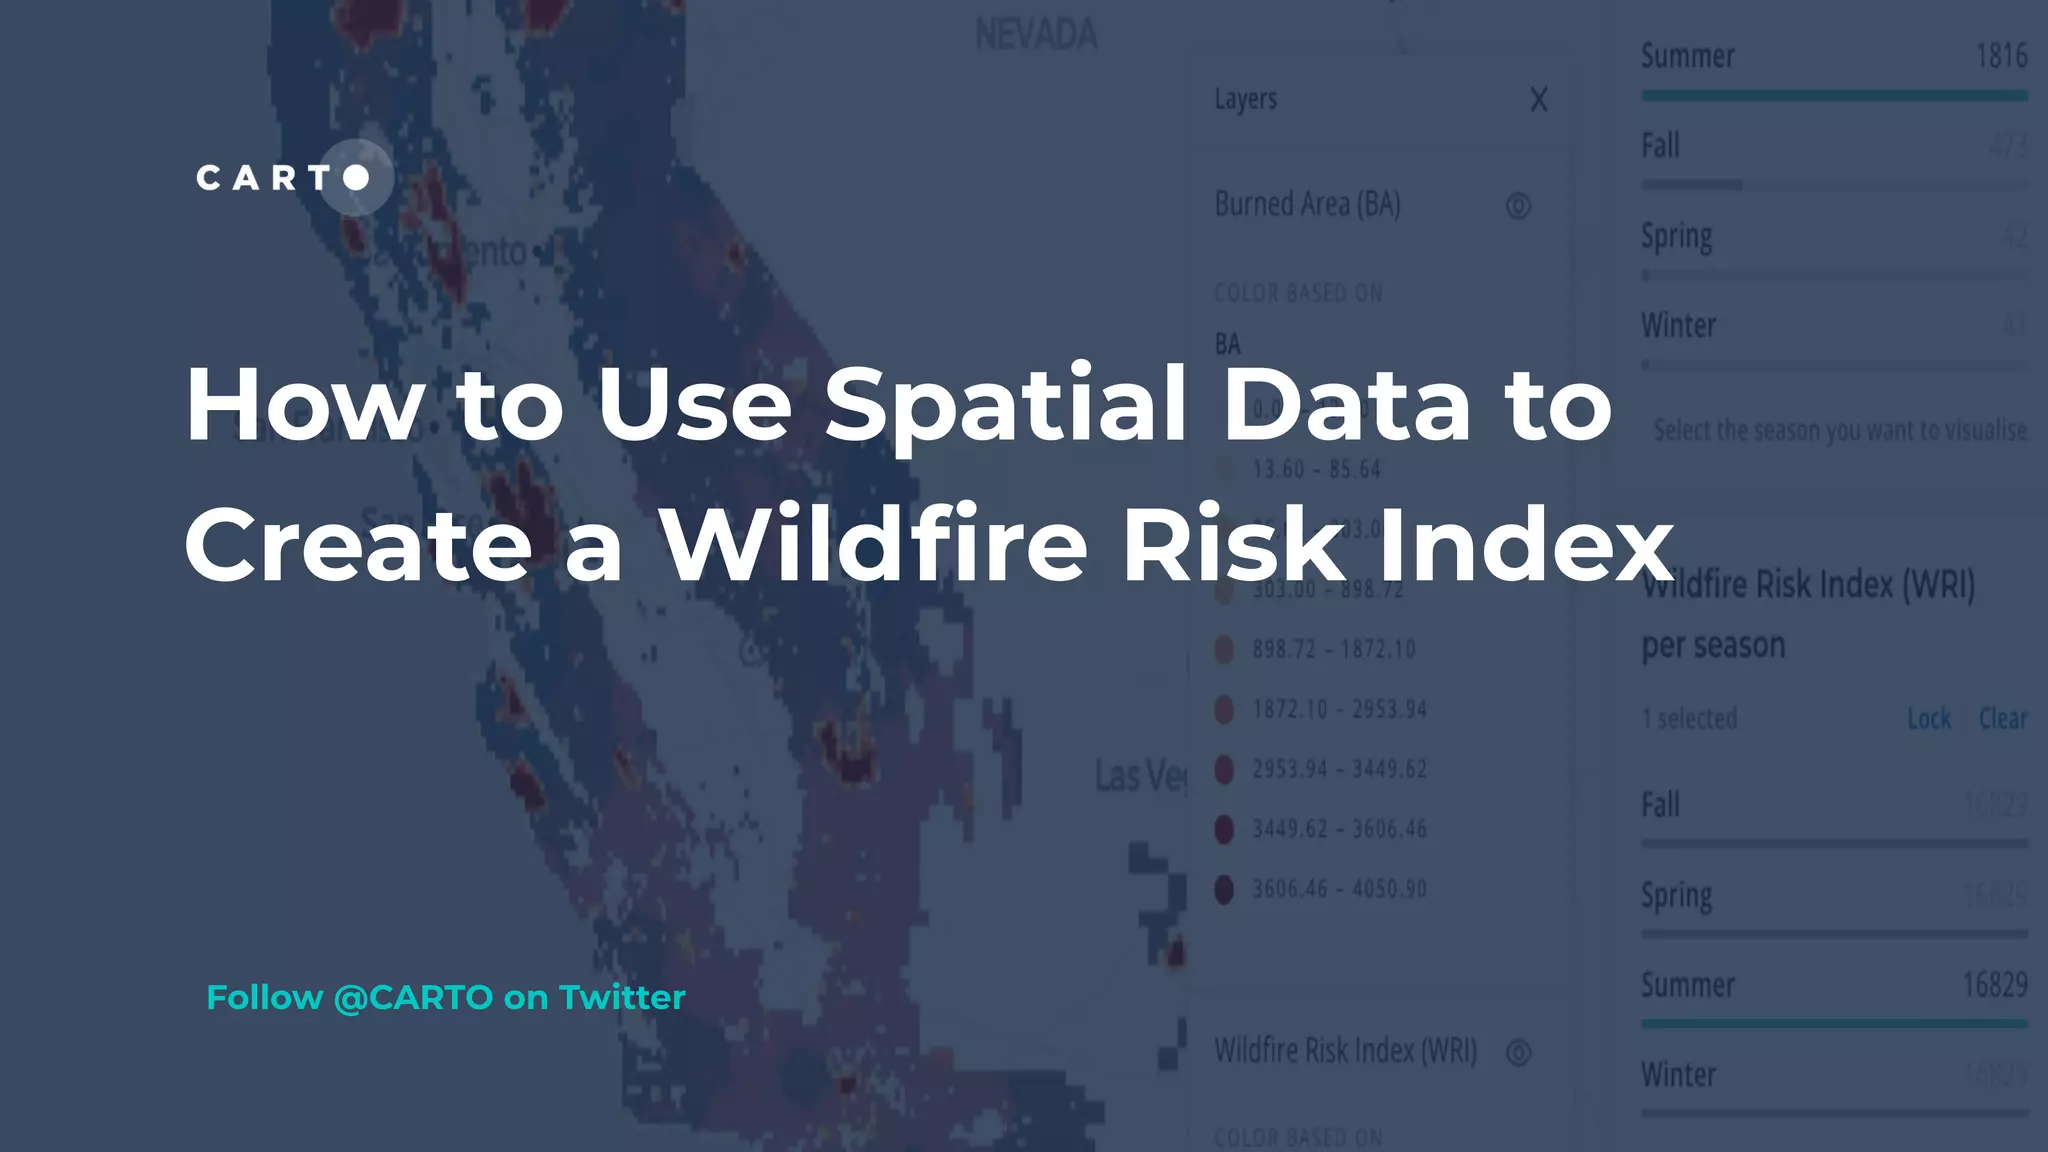


This document discusses how to create a wildfire risk index using spatial data and analysis. It describes using data on past wildfires, climate/weather, land cover, demographics and more to build annual and seasonal wildfire risk indexes for California. Different variables are analyzed for their relationship to burned areas to select predictors for the index. The indexes can help various groups like insurers better understand risk and mitigate losses from wildfires.
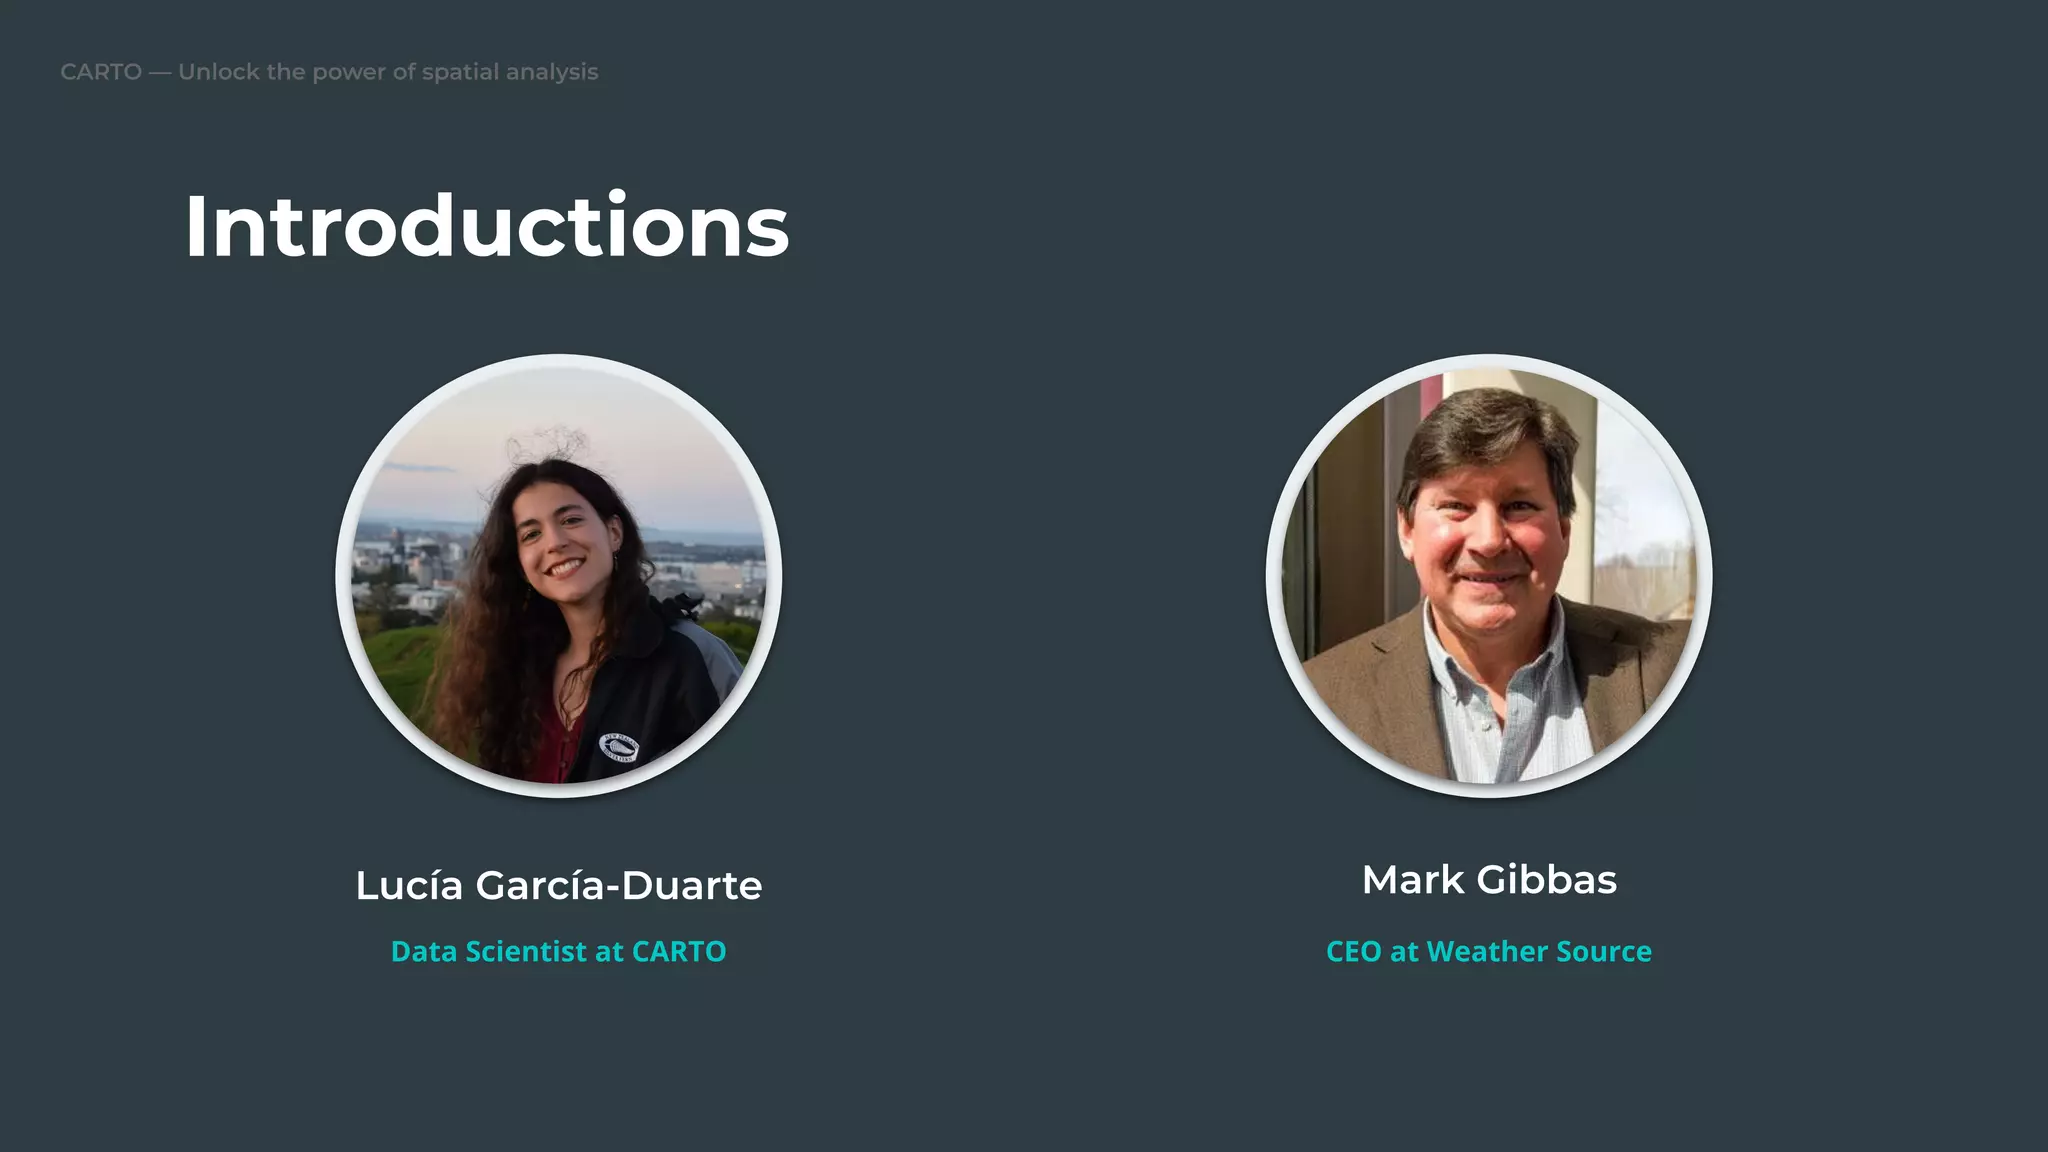
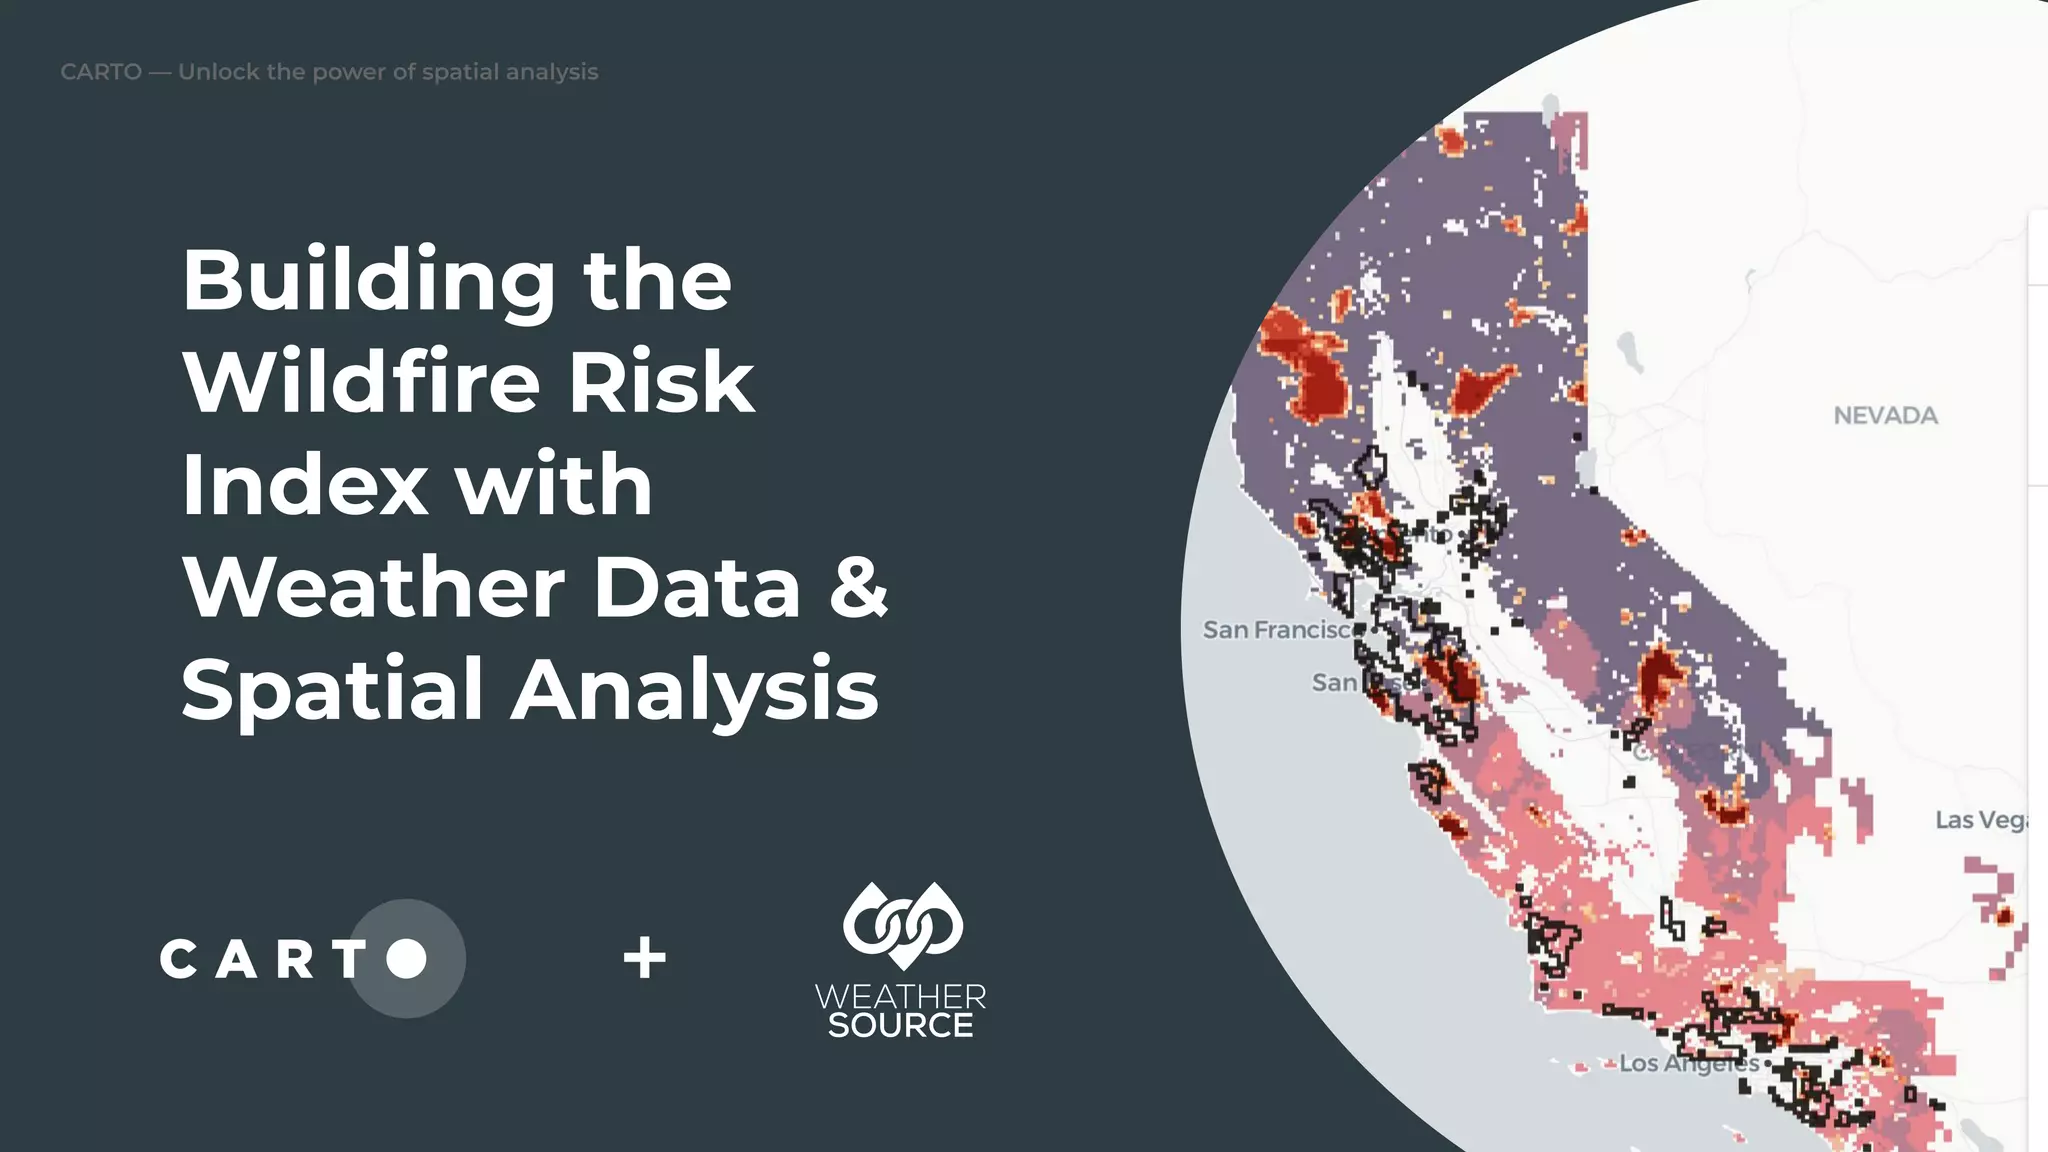
Introduction to CARTO's presentation on creating a Wildfire Risk Index using spatial data.
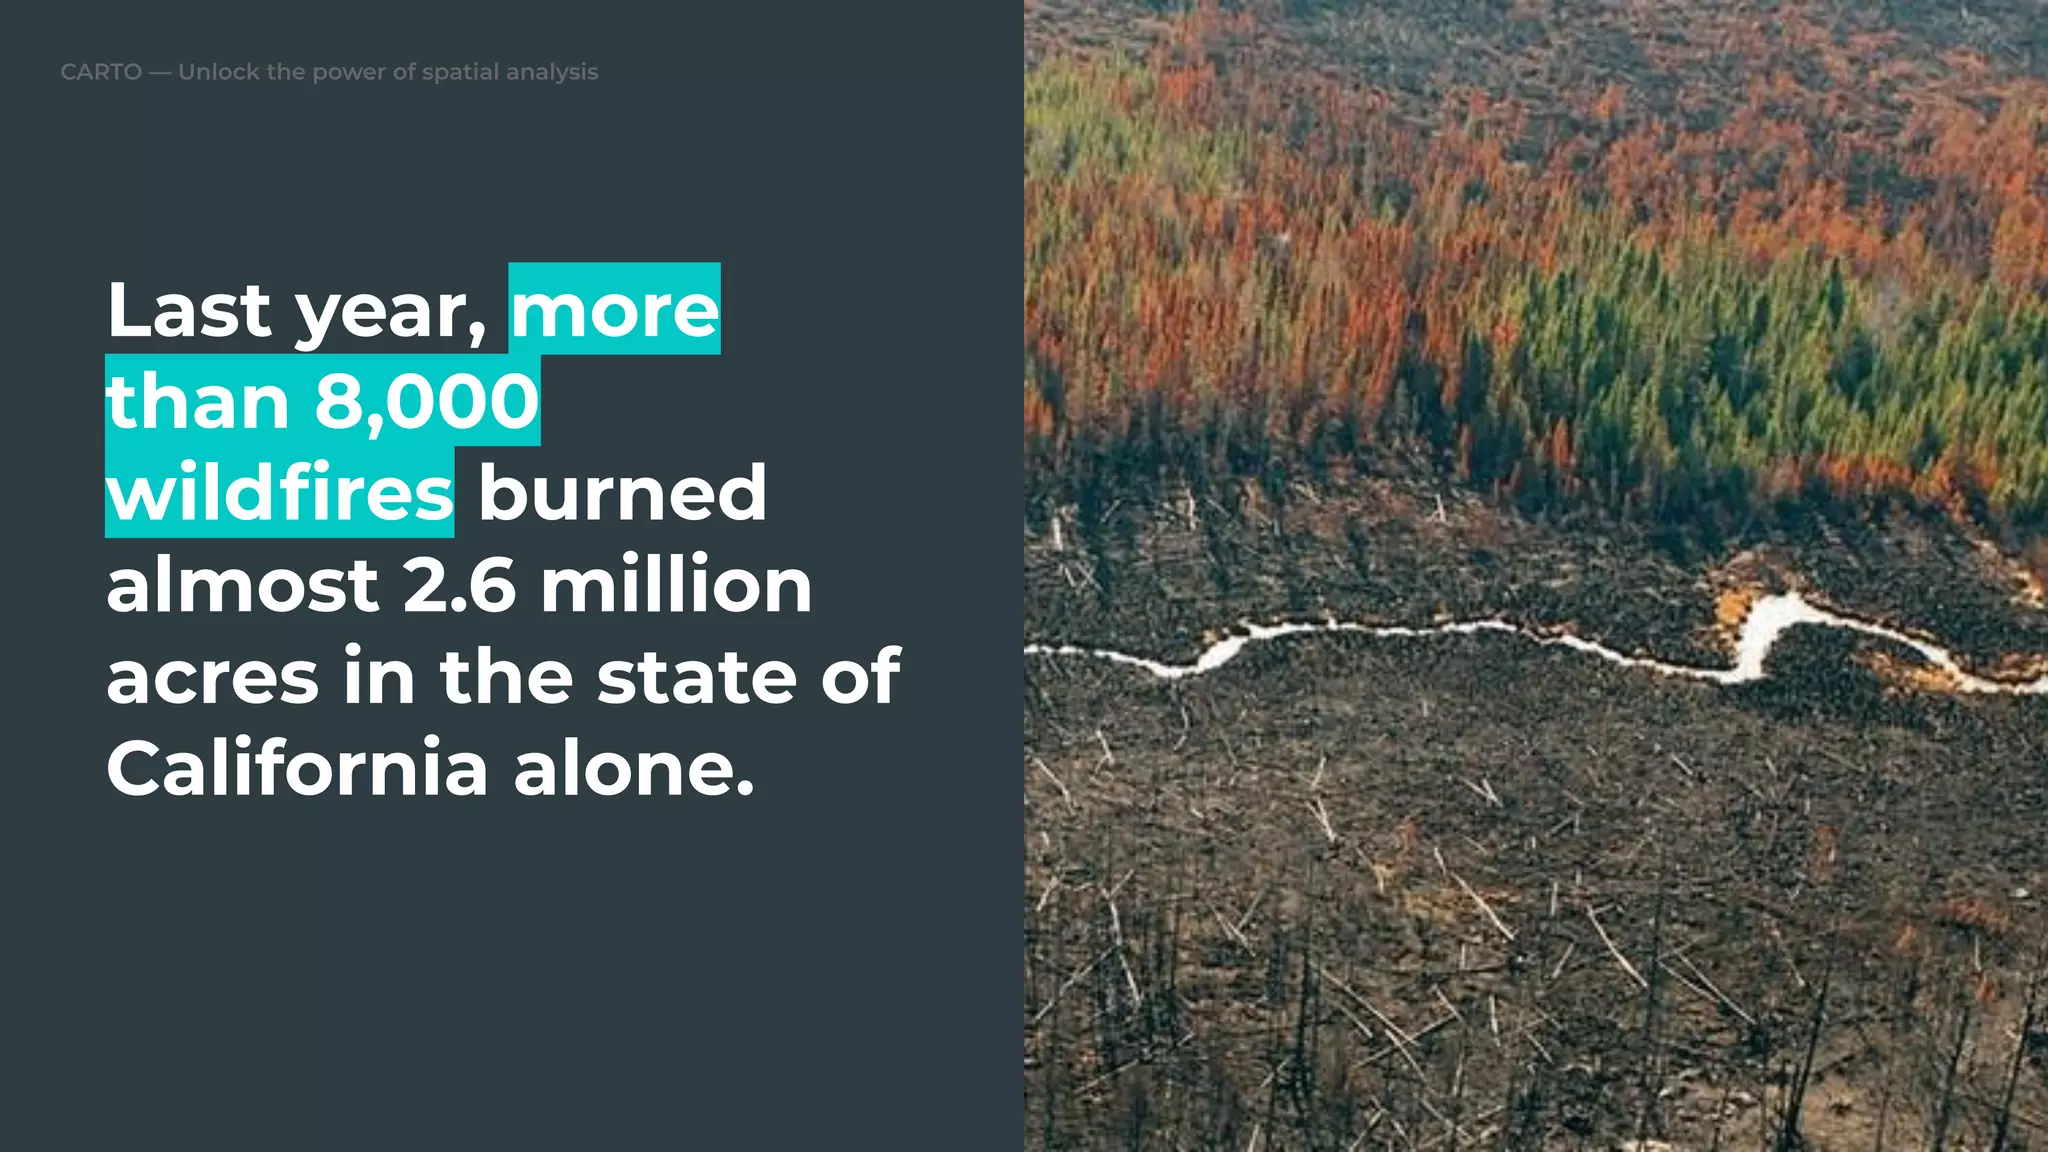
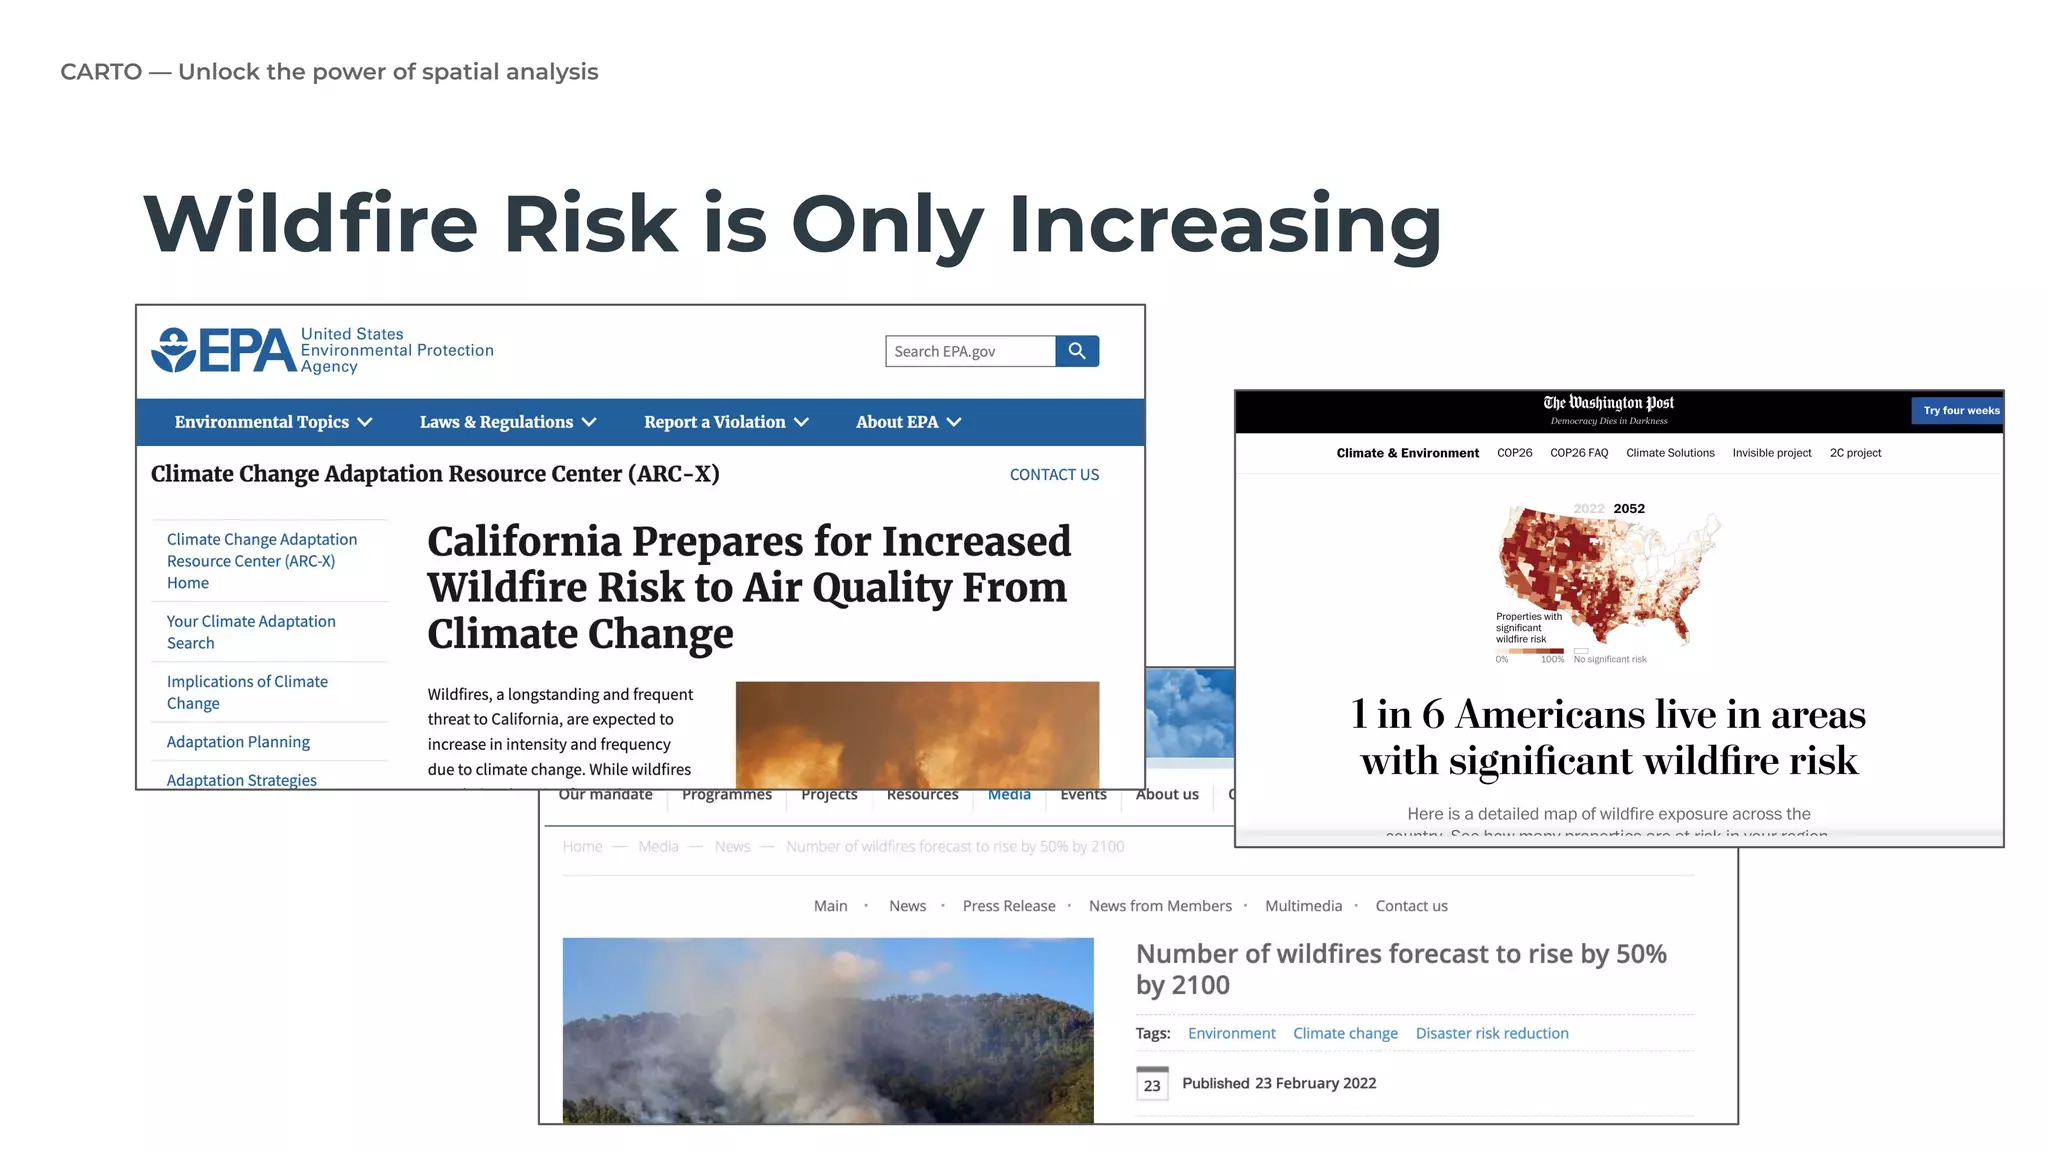
More than 8,000 wildfires burned 2.6 million acres in California last year; wildfire risk continues to increase.
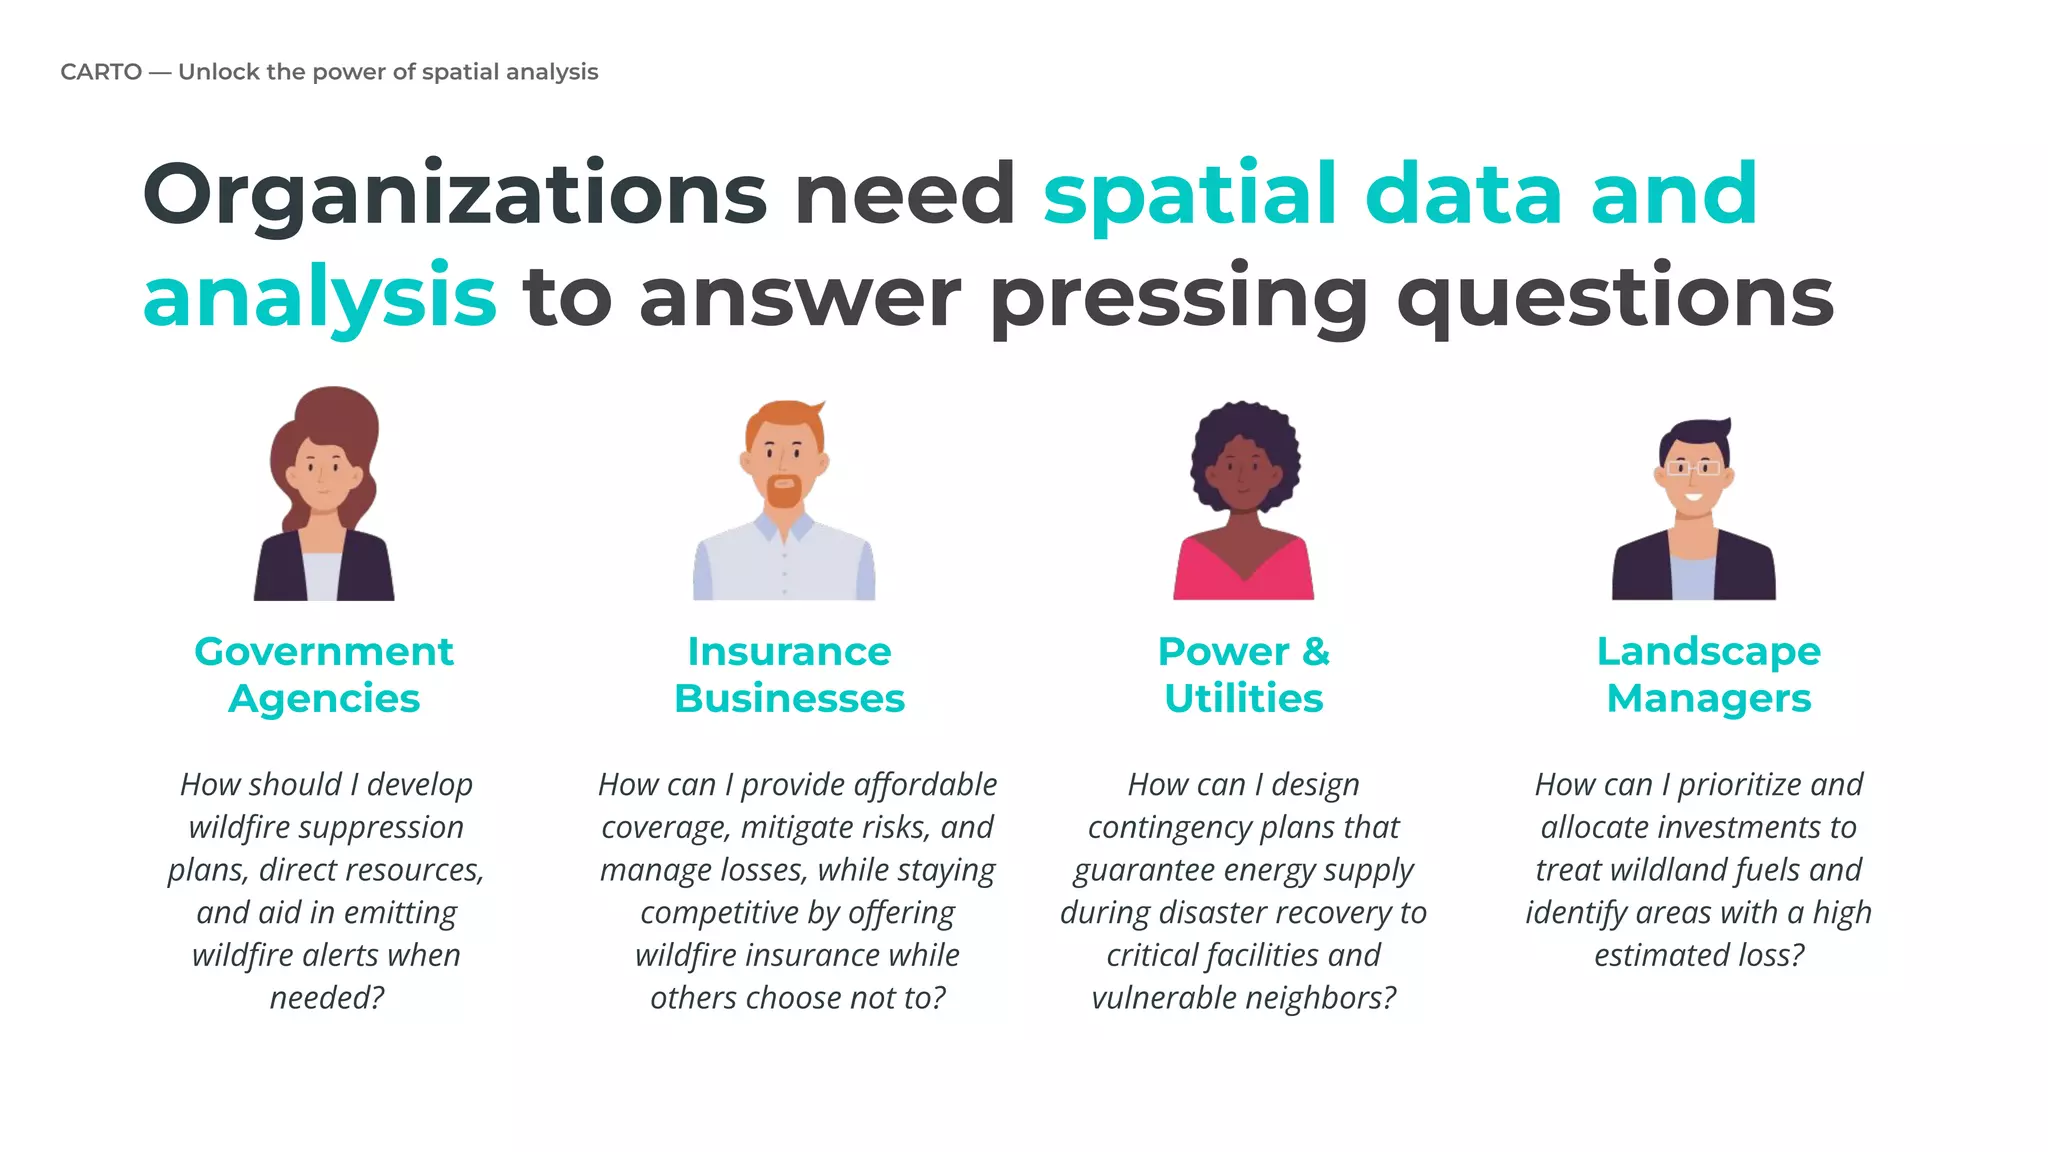
Organizations require spatial analysis for effective wildfire management, as gauged by audience polling.
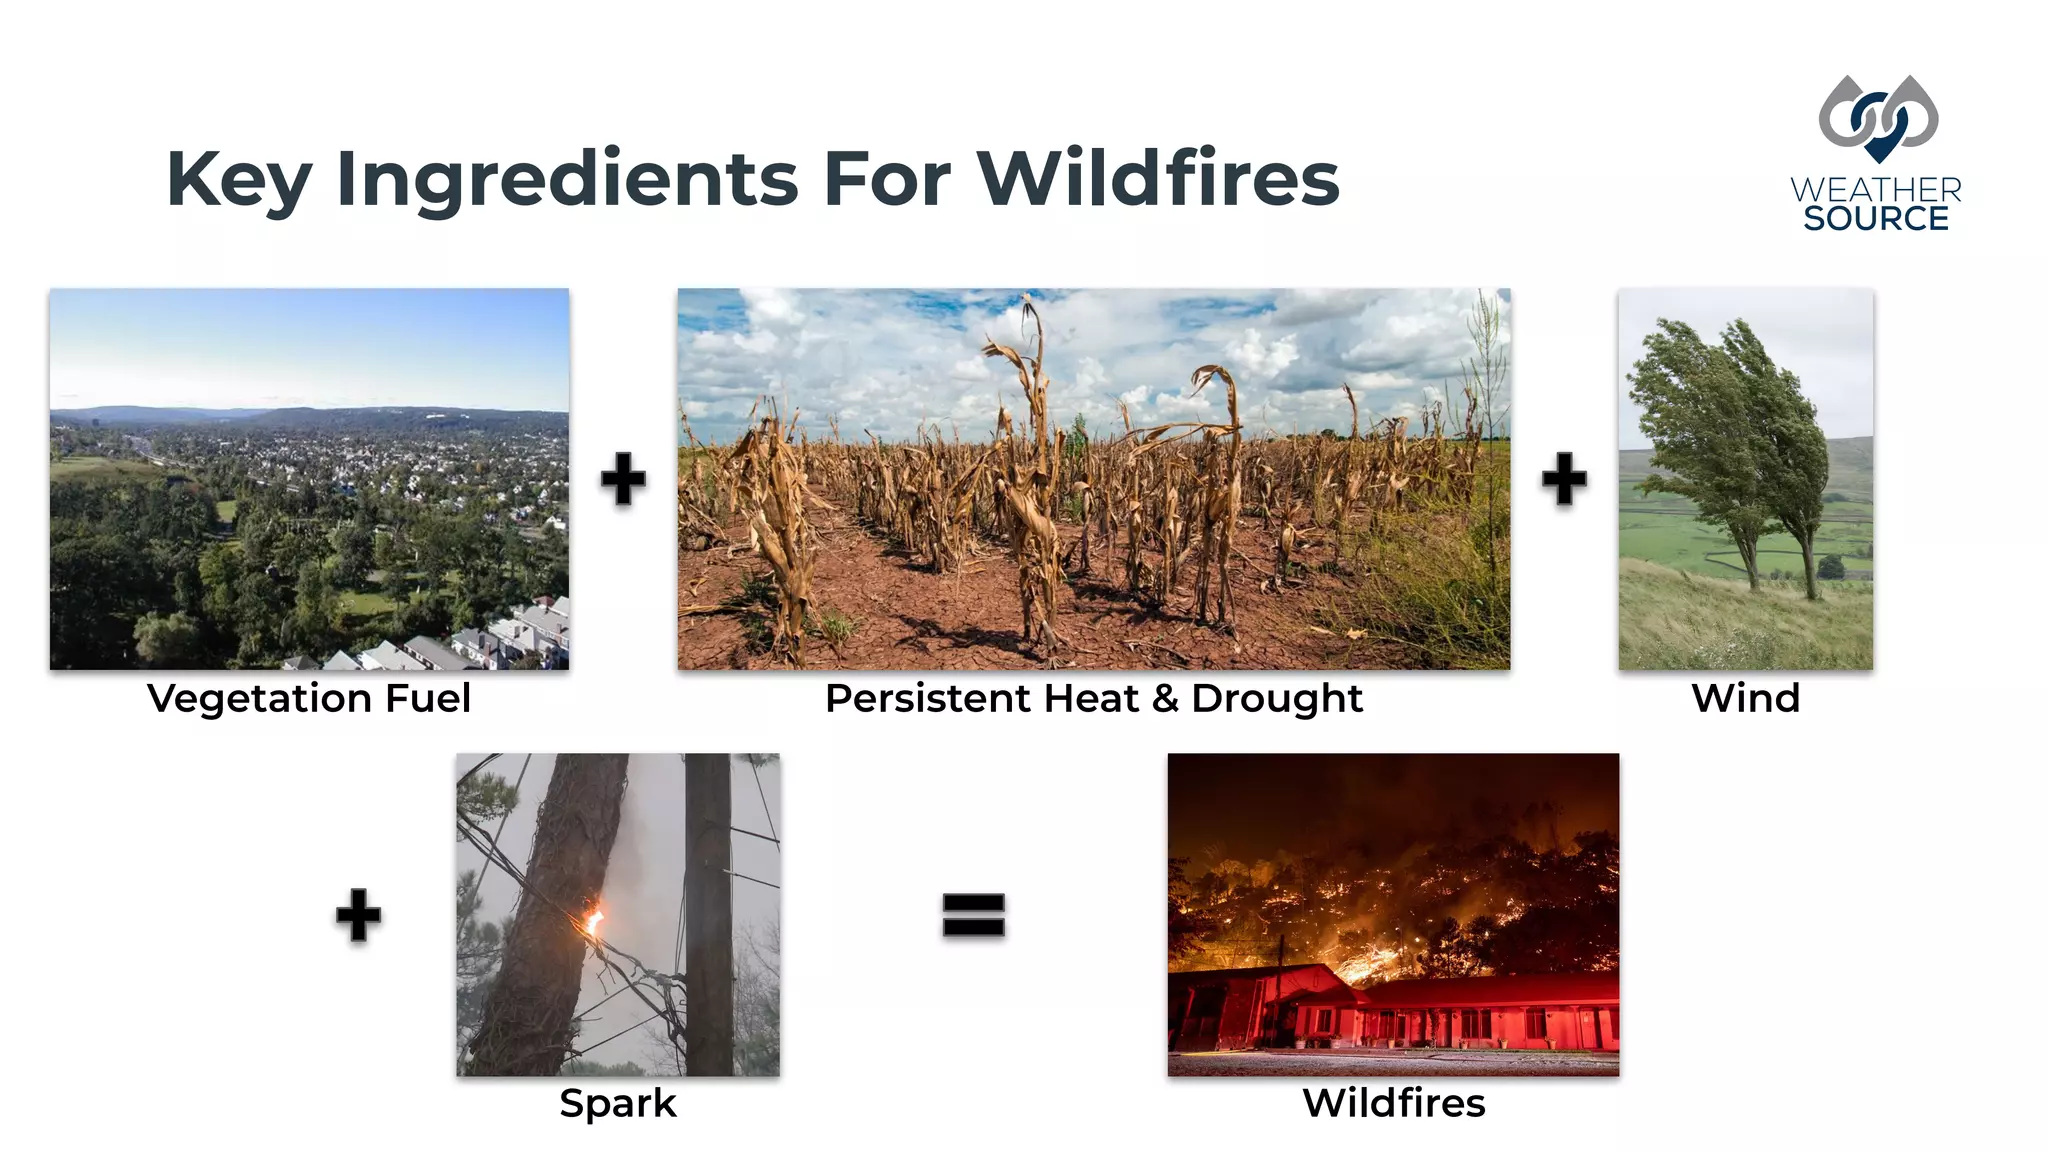
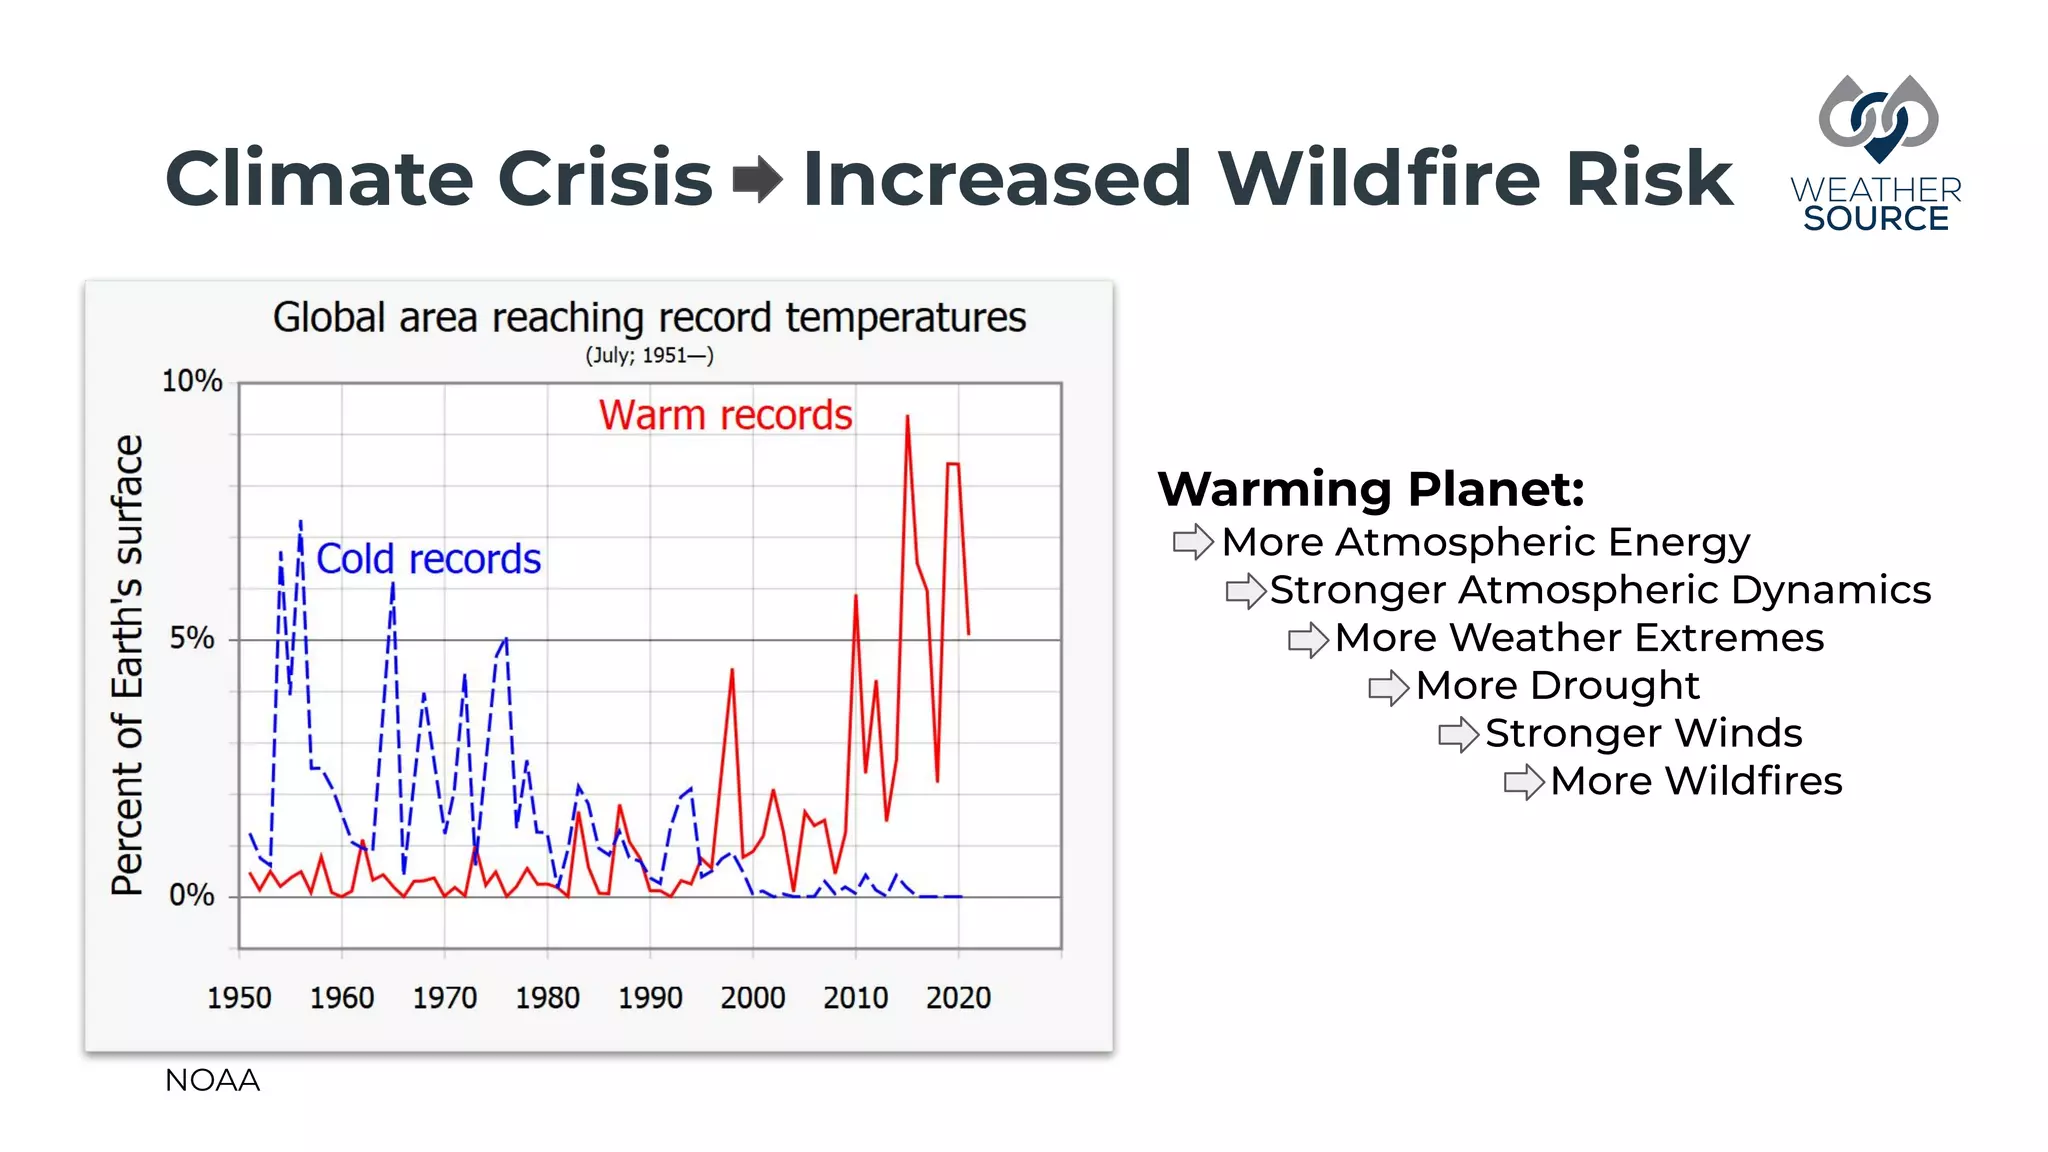
Vegetation, heat, drought, and wind are critical factors in wildfire occurrence, worsened by climate change.
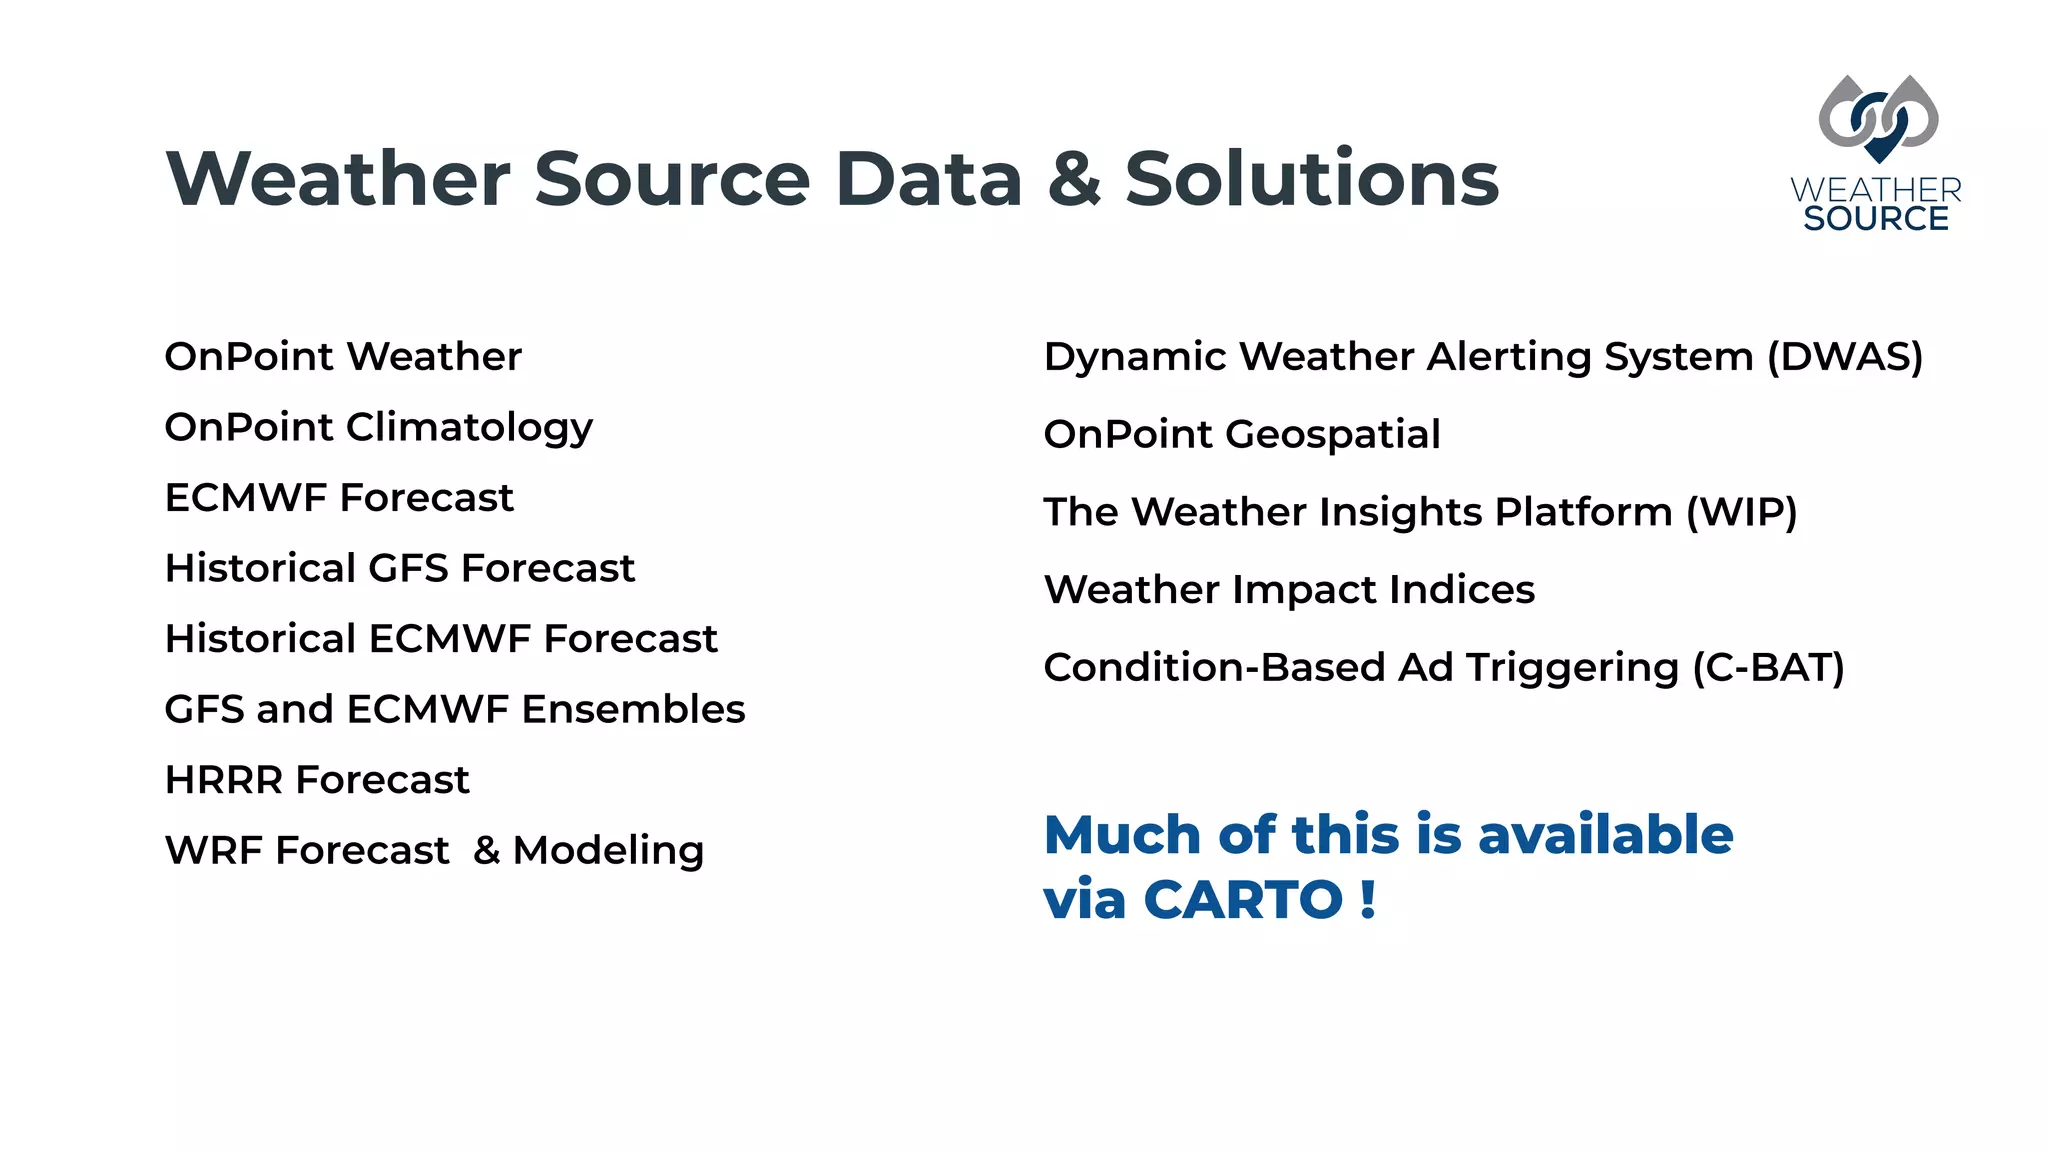
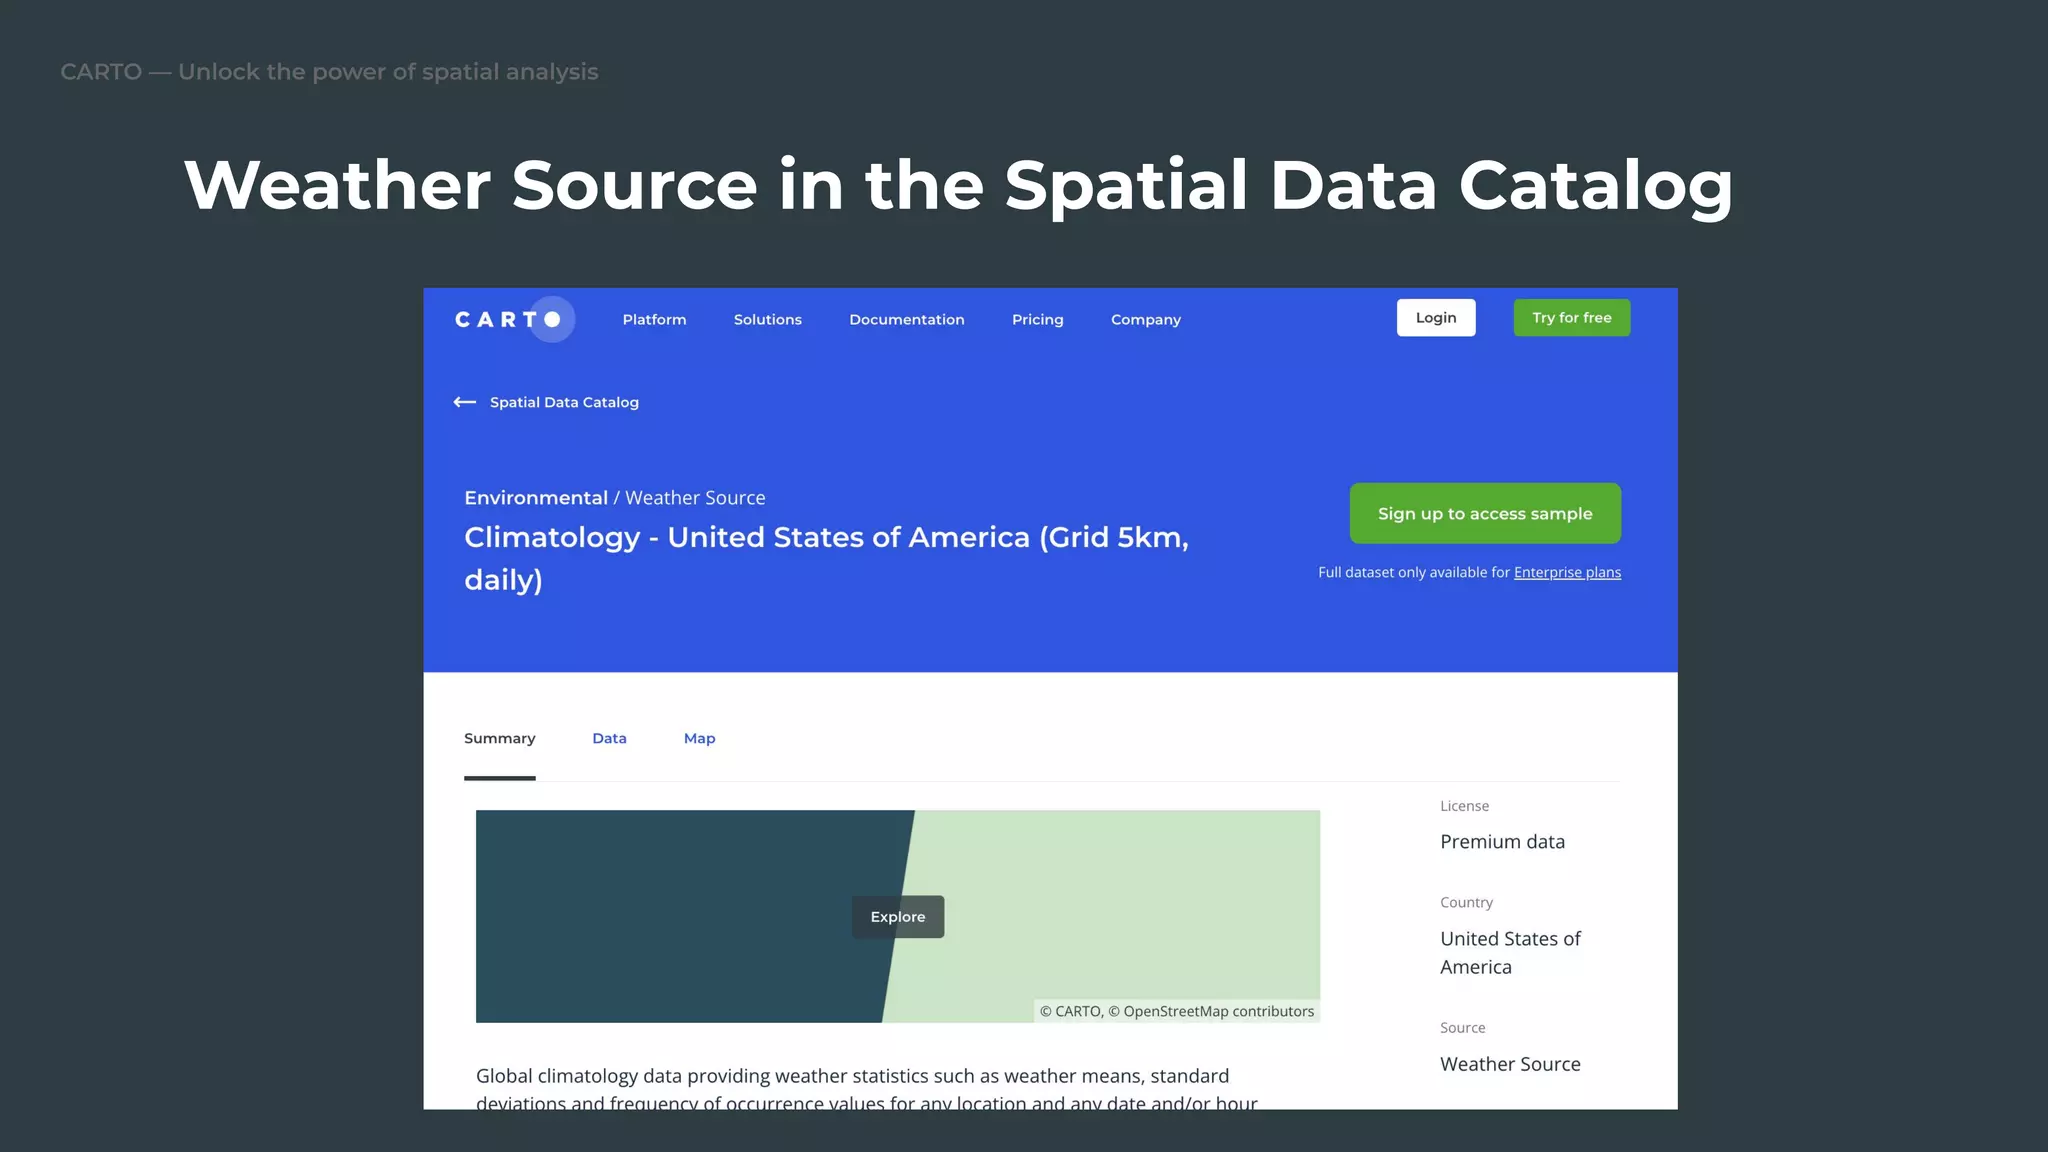
Overview of Weather Source data and solutions to build the Wildfire Risk Index through spatial analysis.
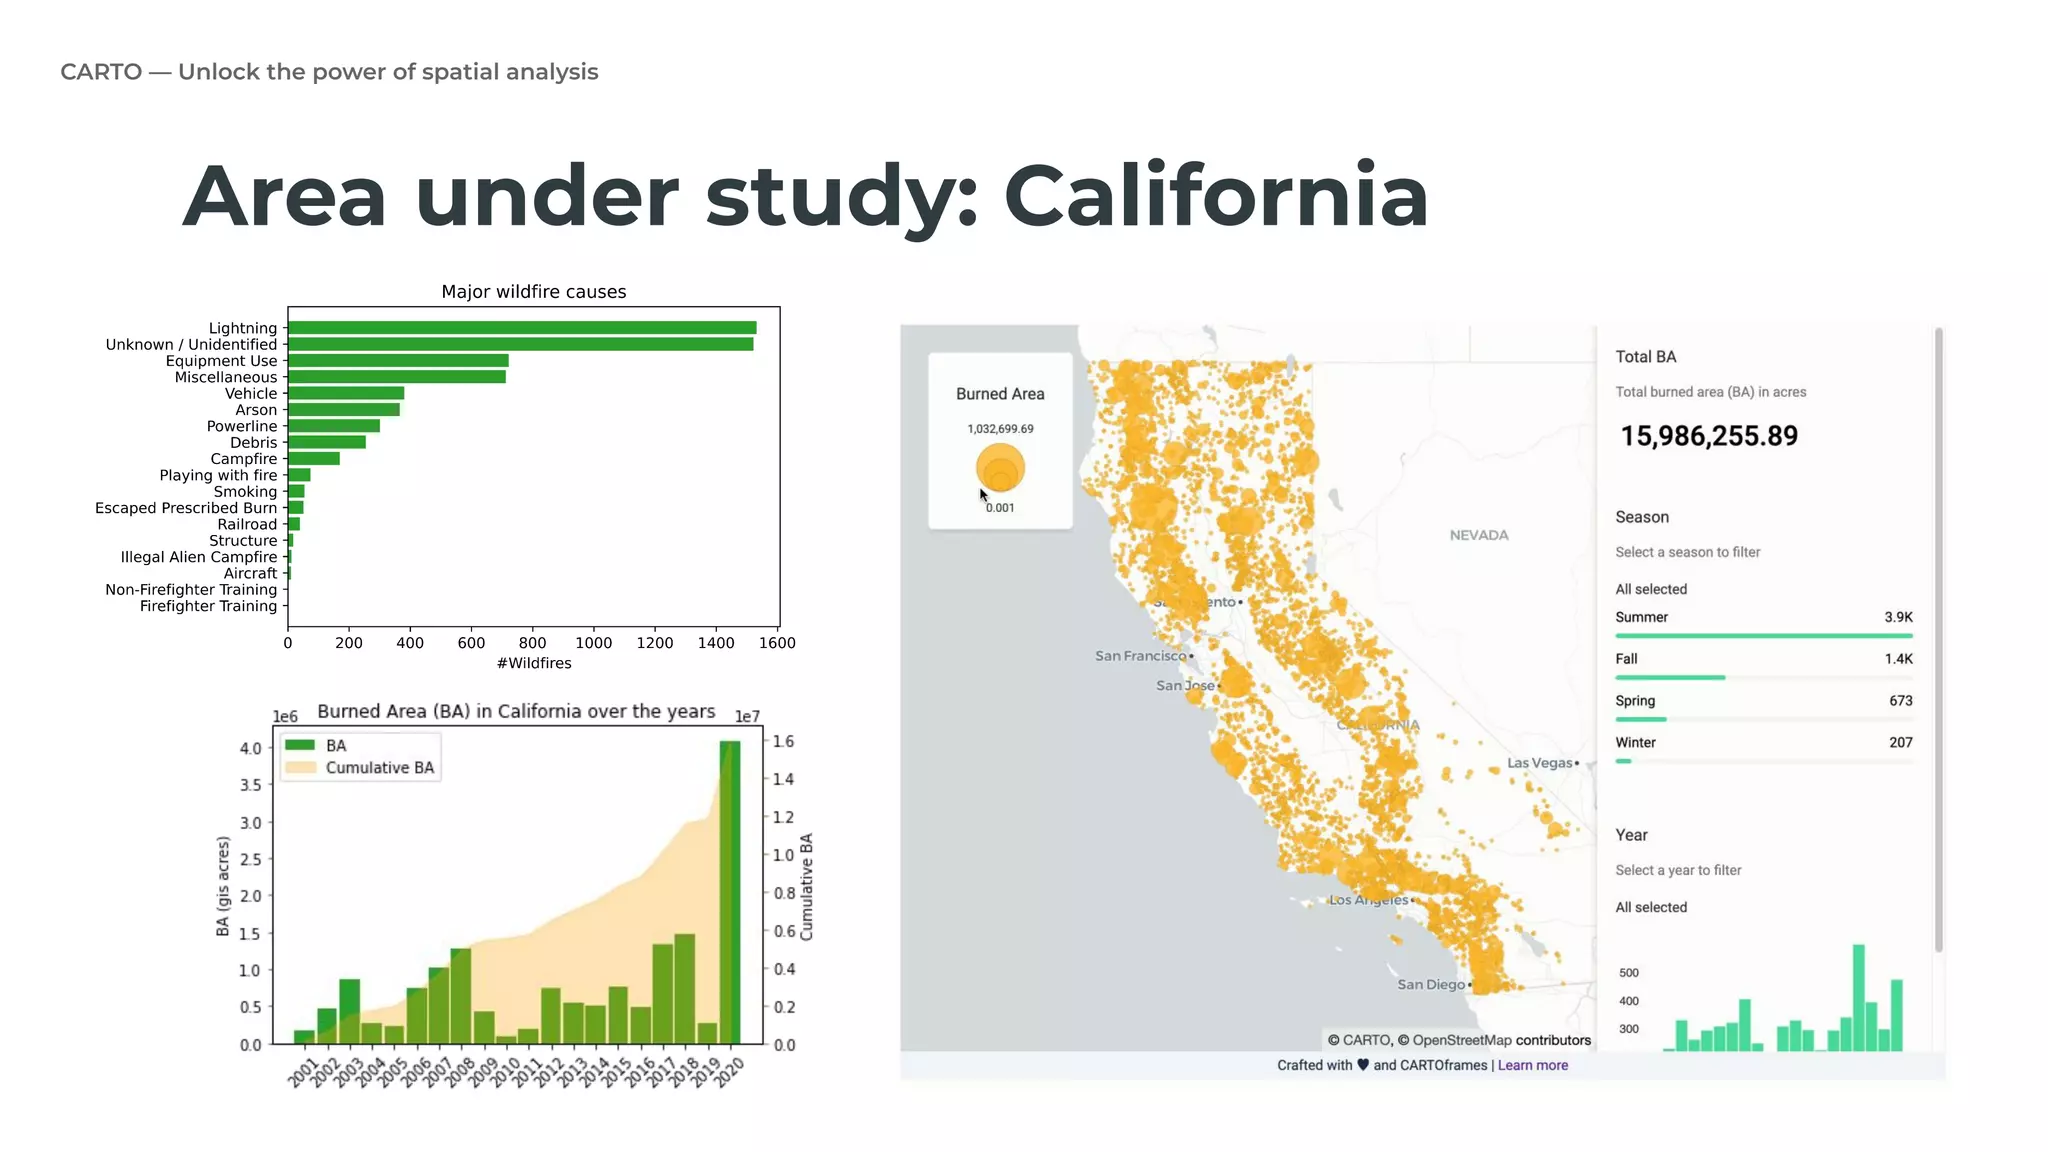
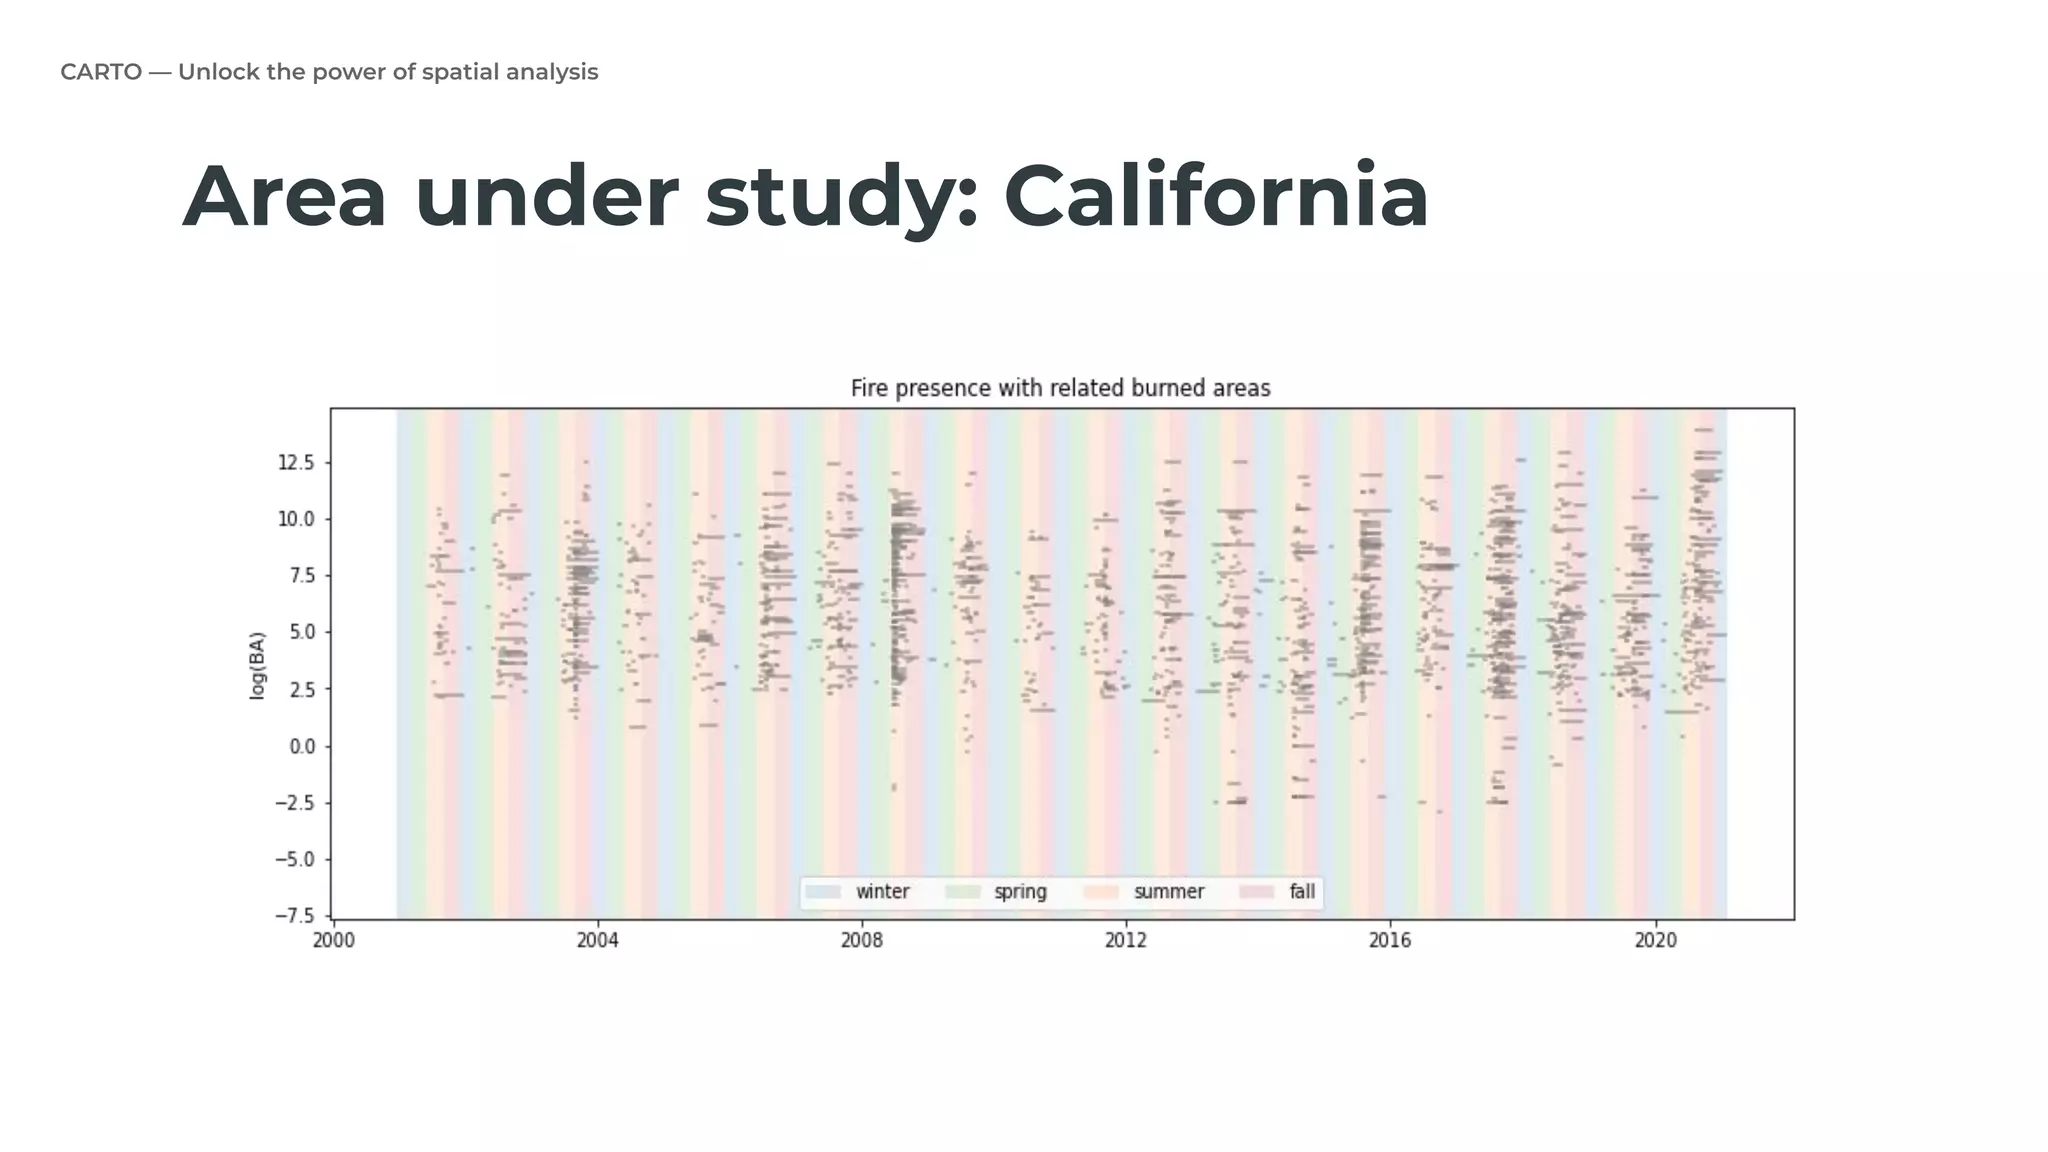
California selected as the primary area of focus for the Wildfire Risk Index analysis.
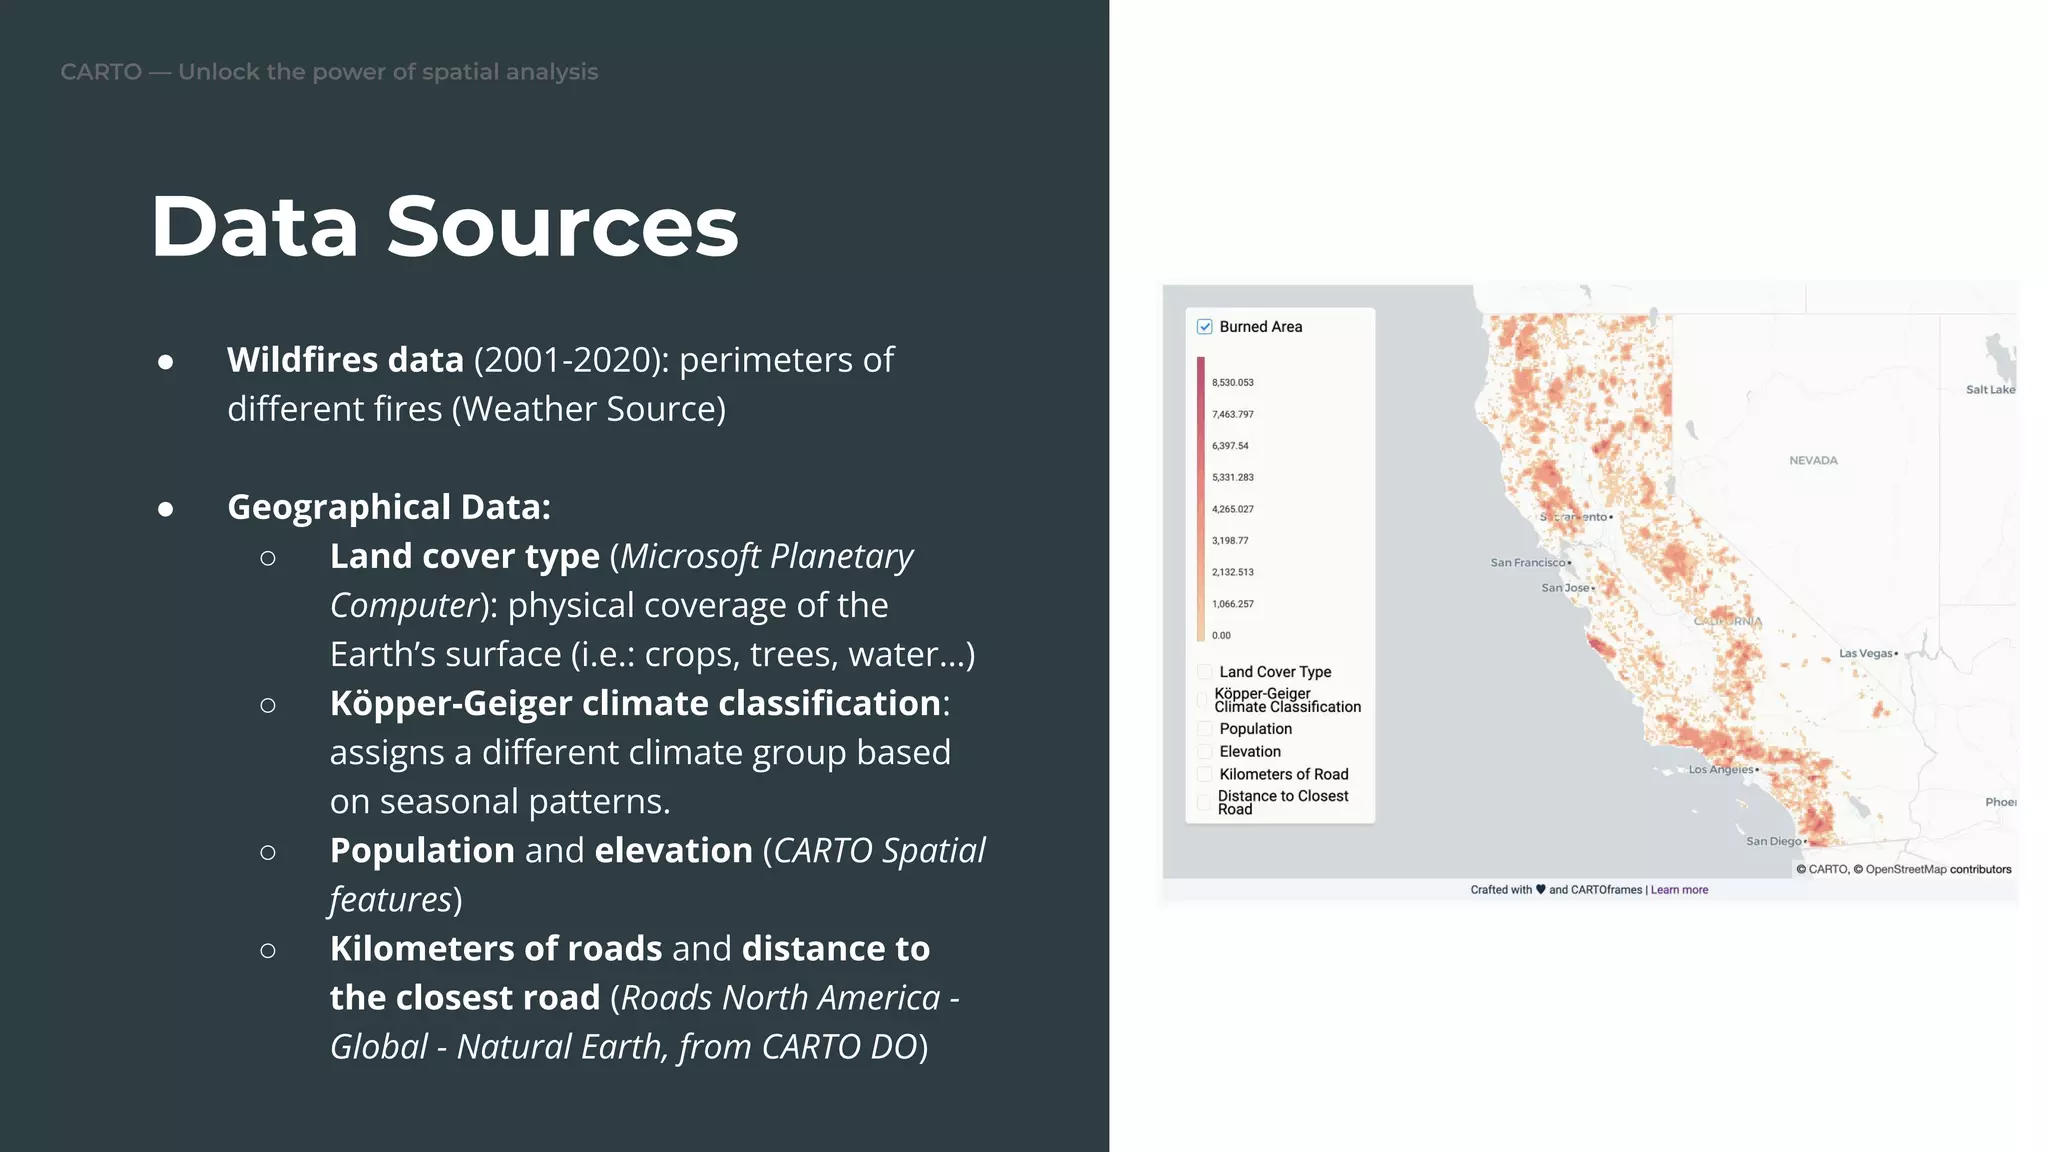
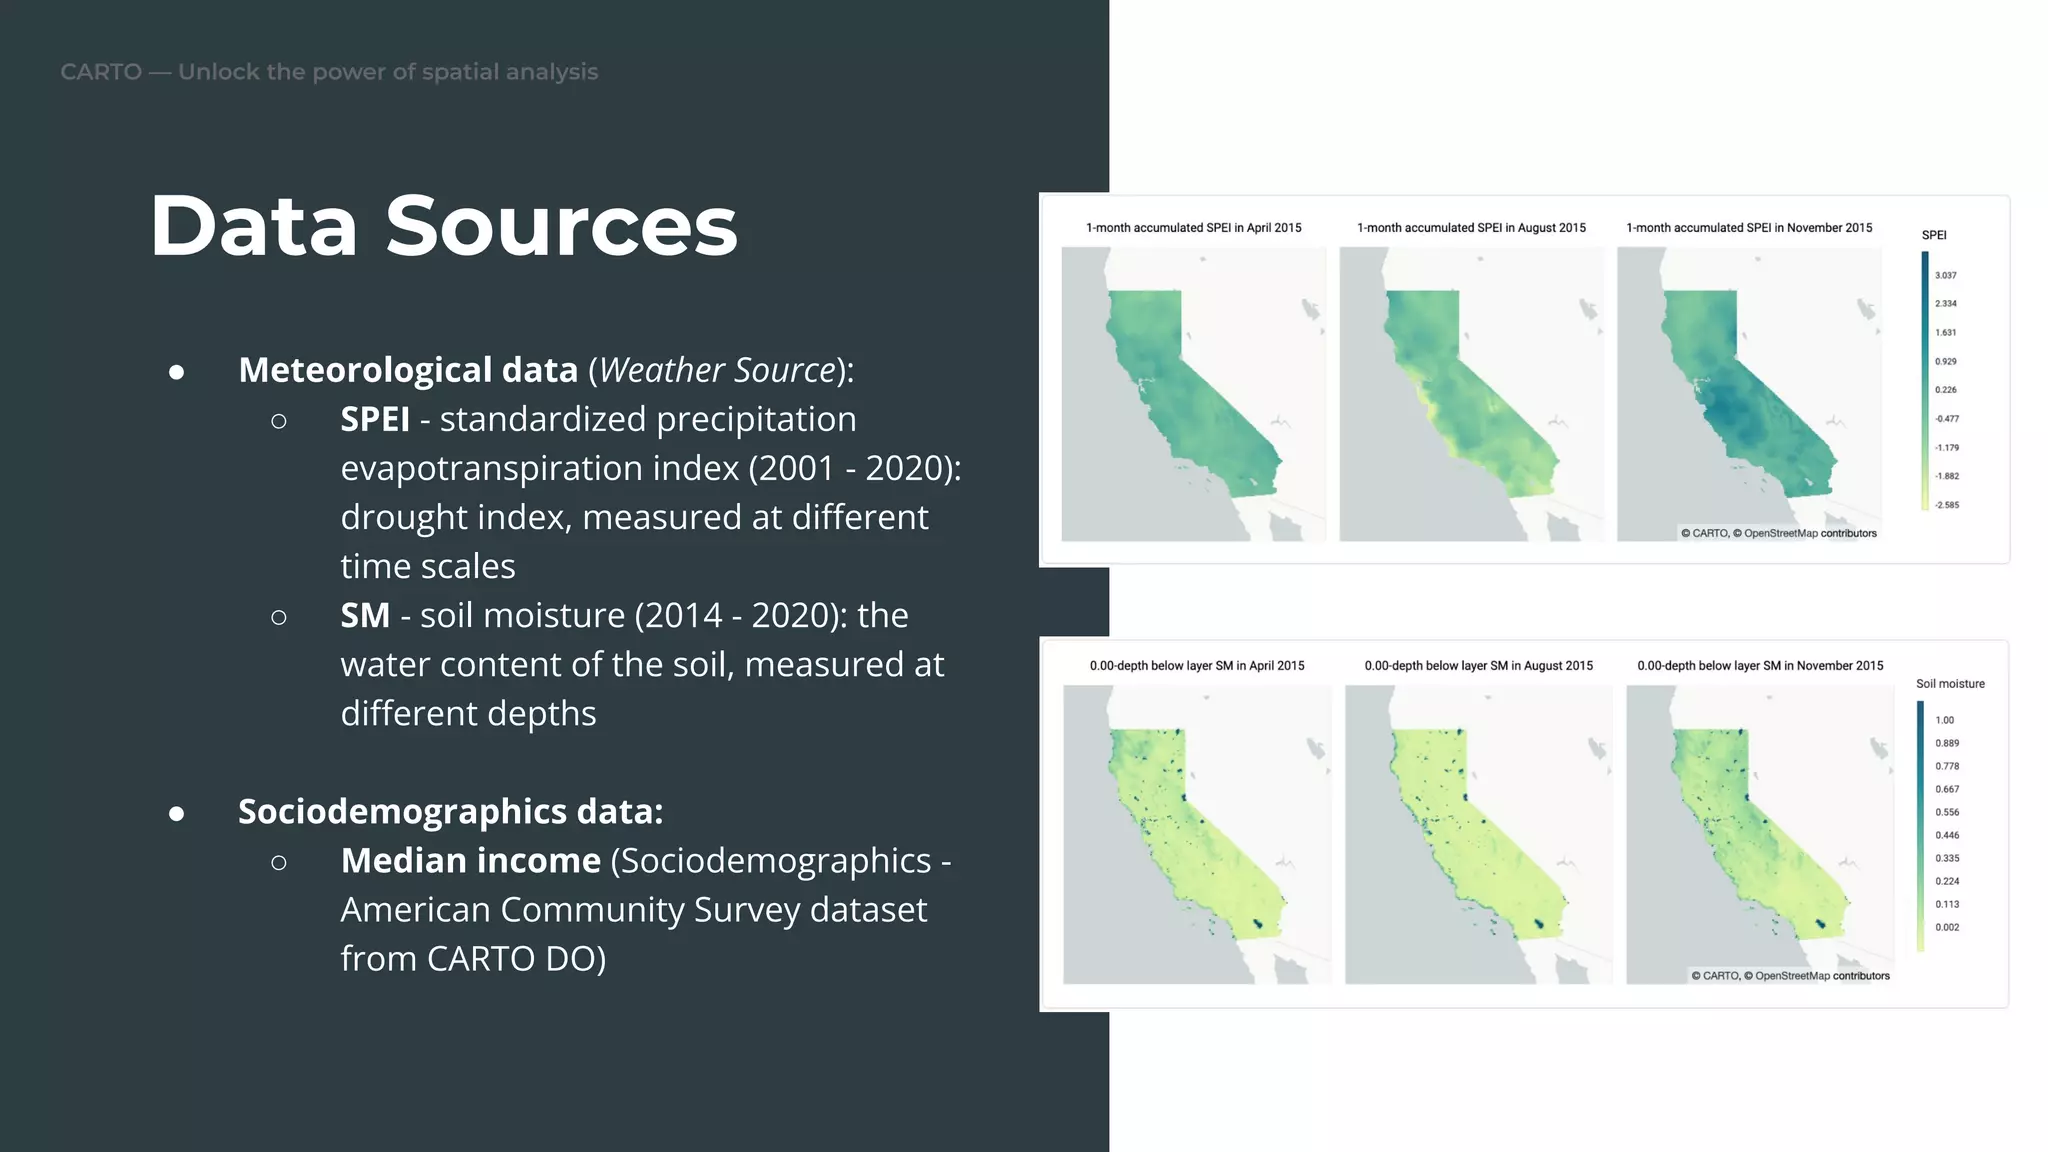
Various data sources for wildfire analysis, including wildfires, geographical, meteorological, and sociodemographic data.
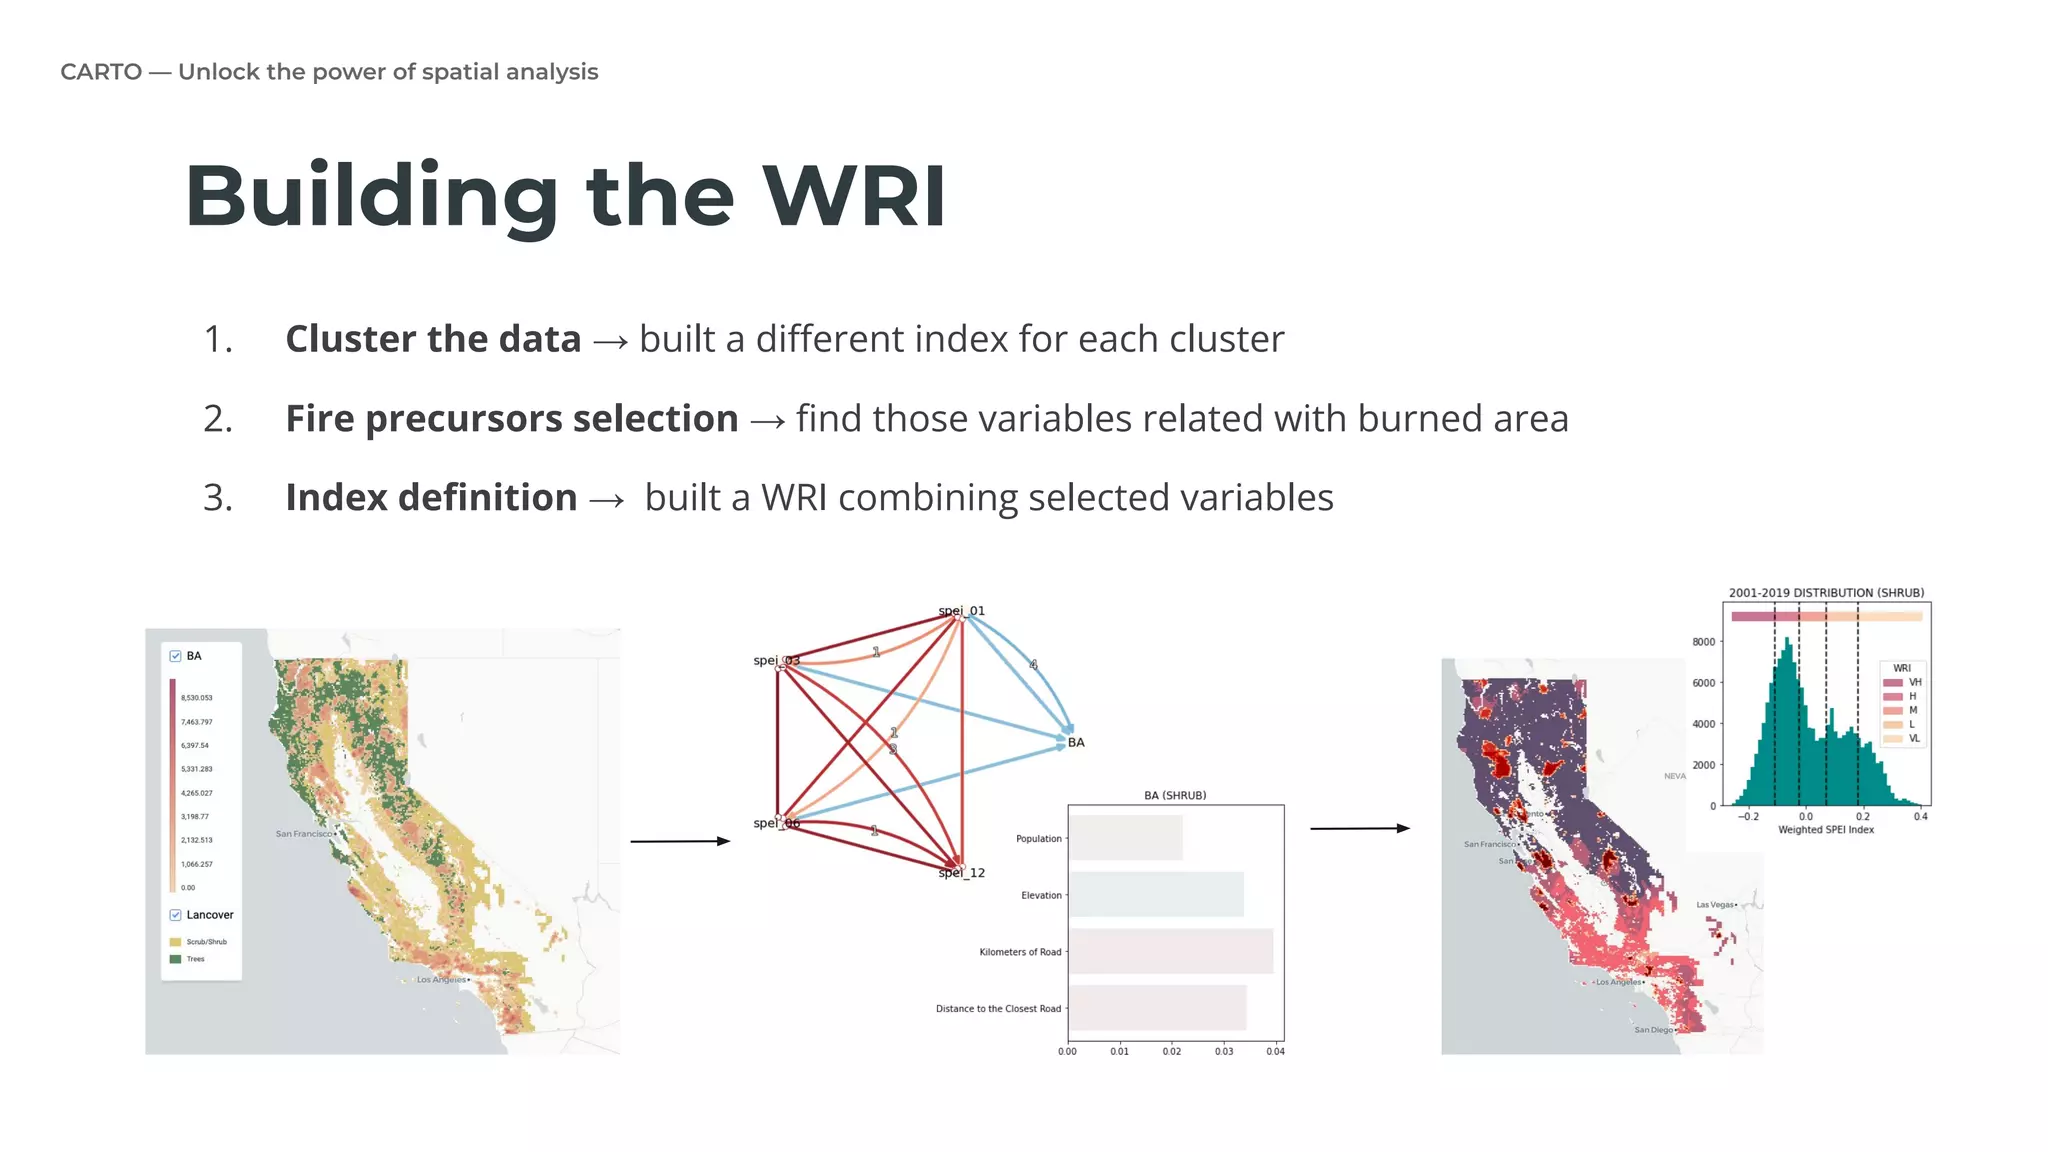
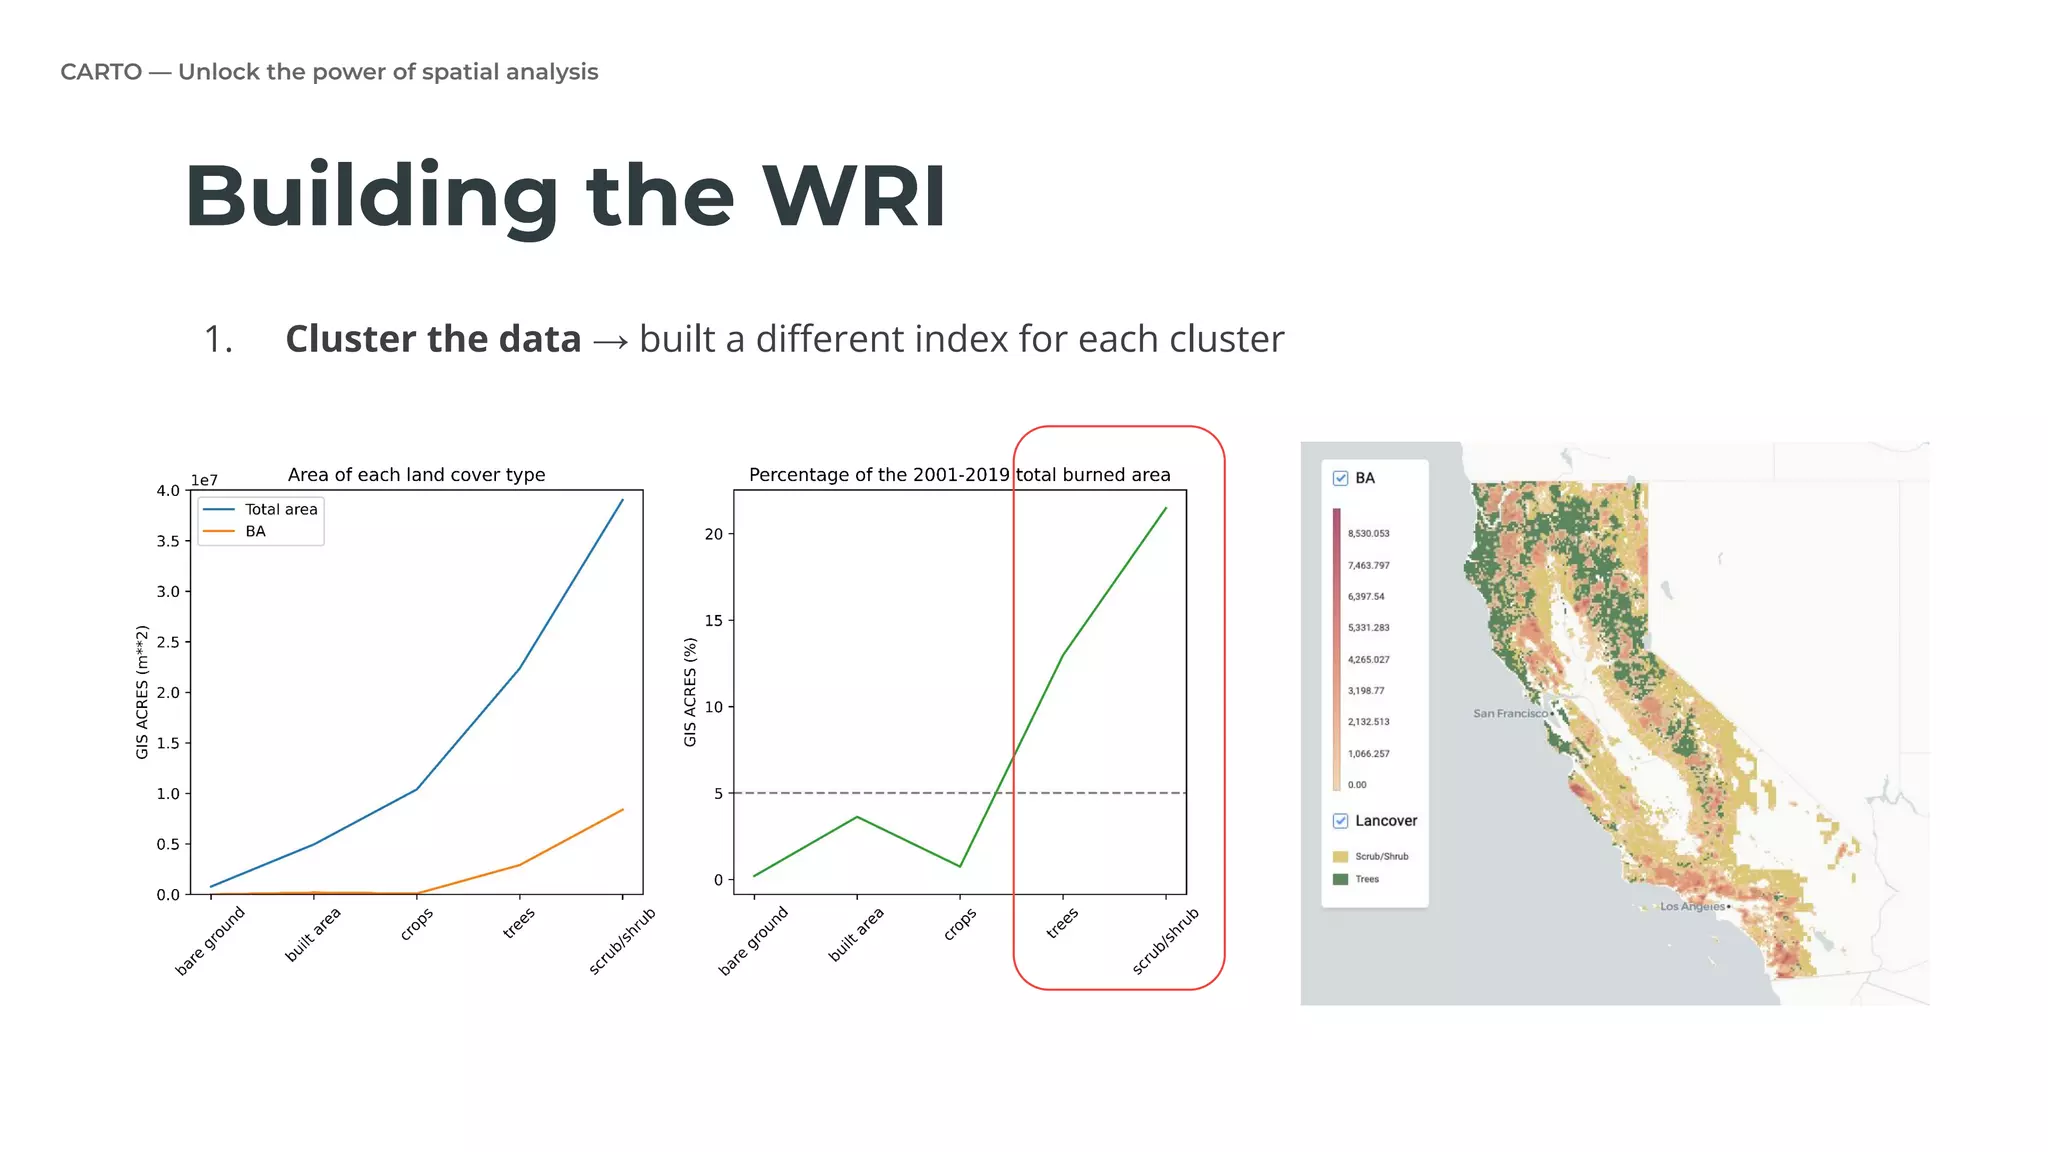
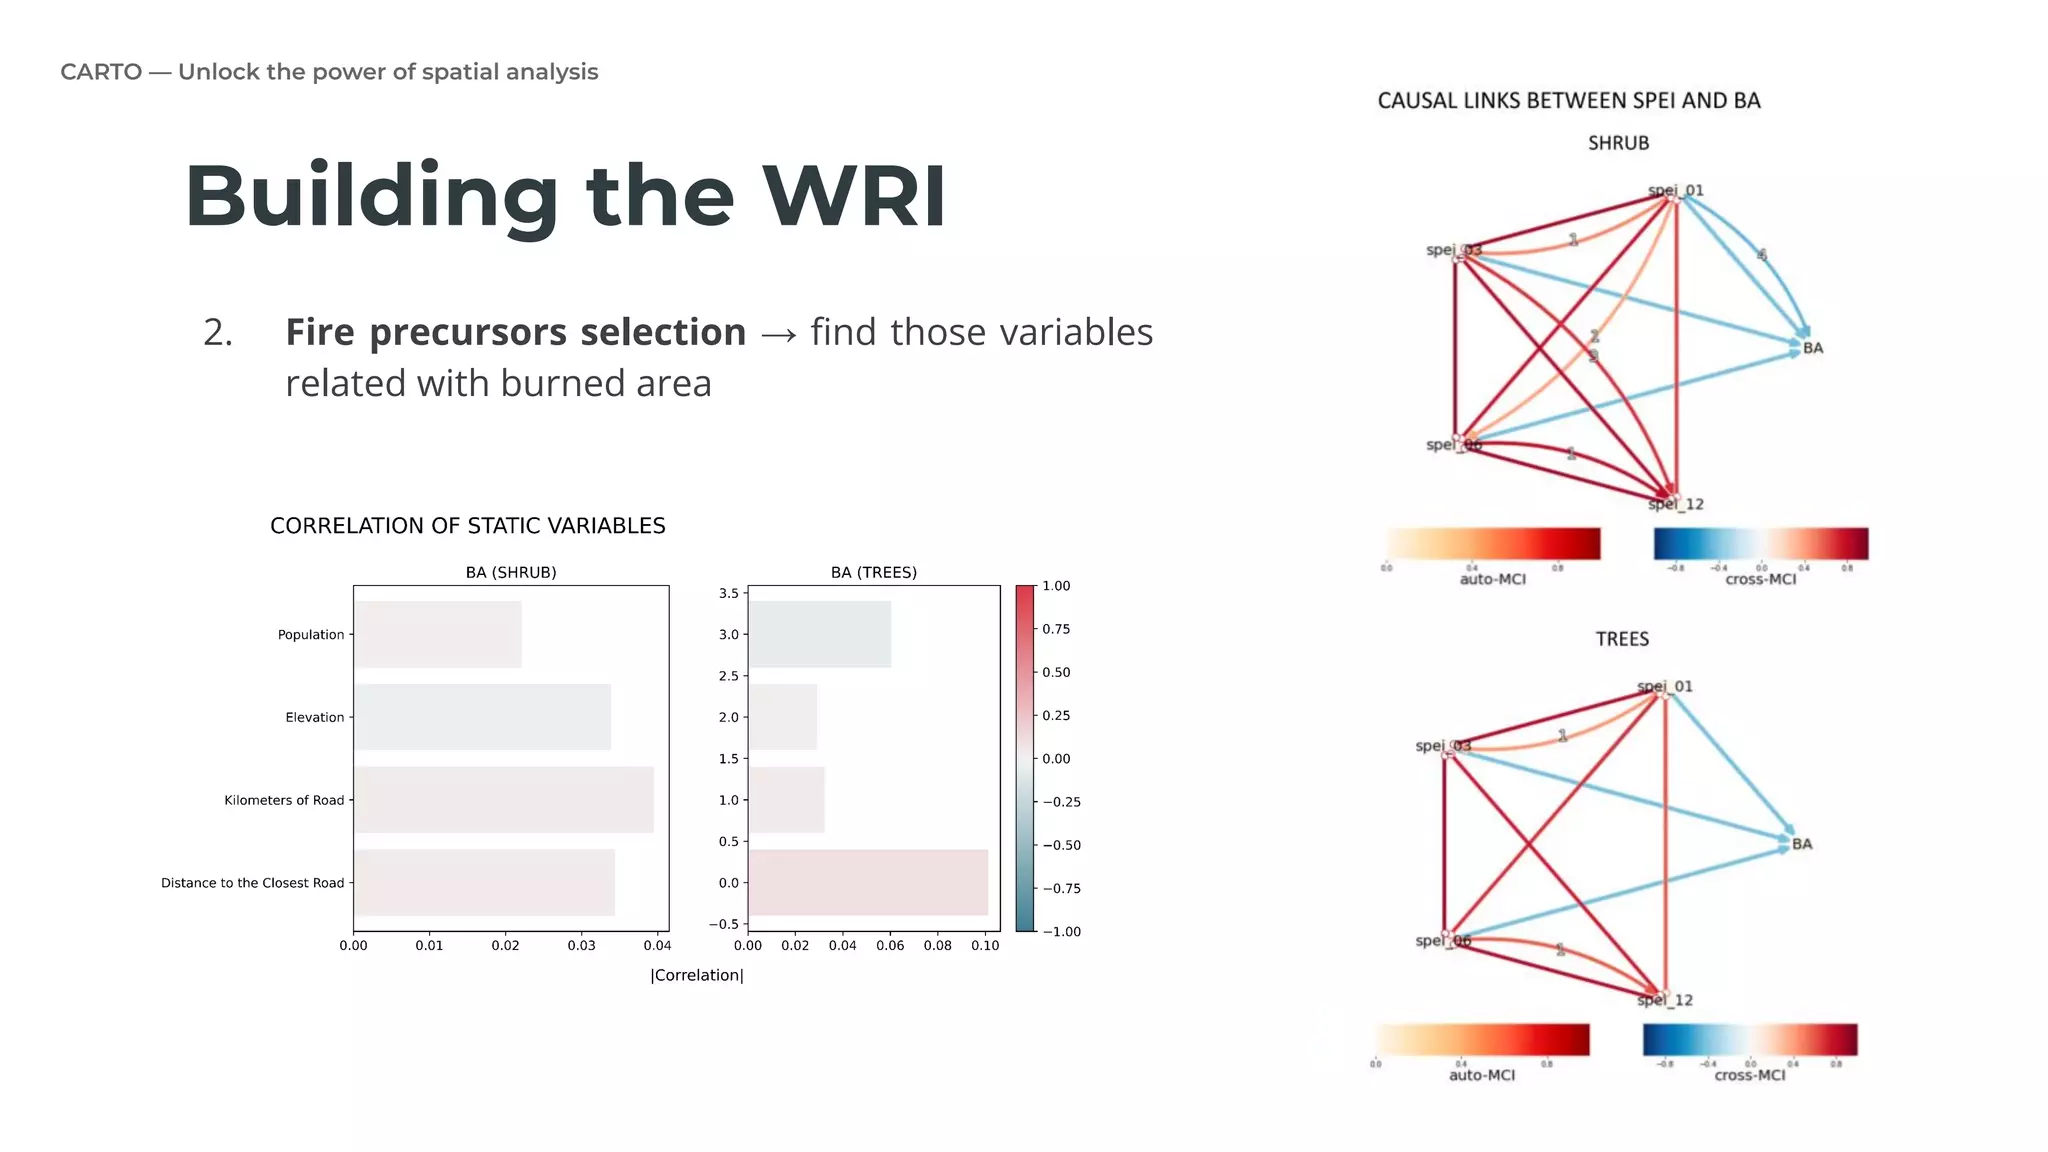
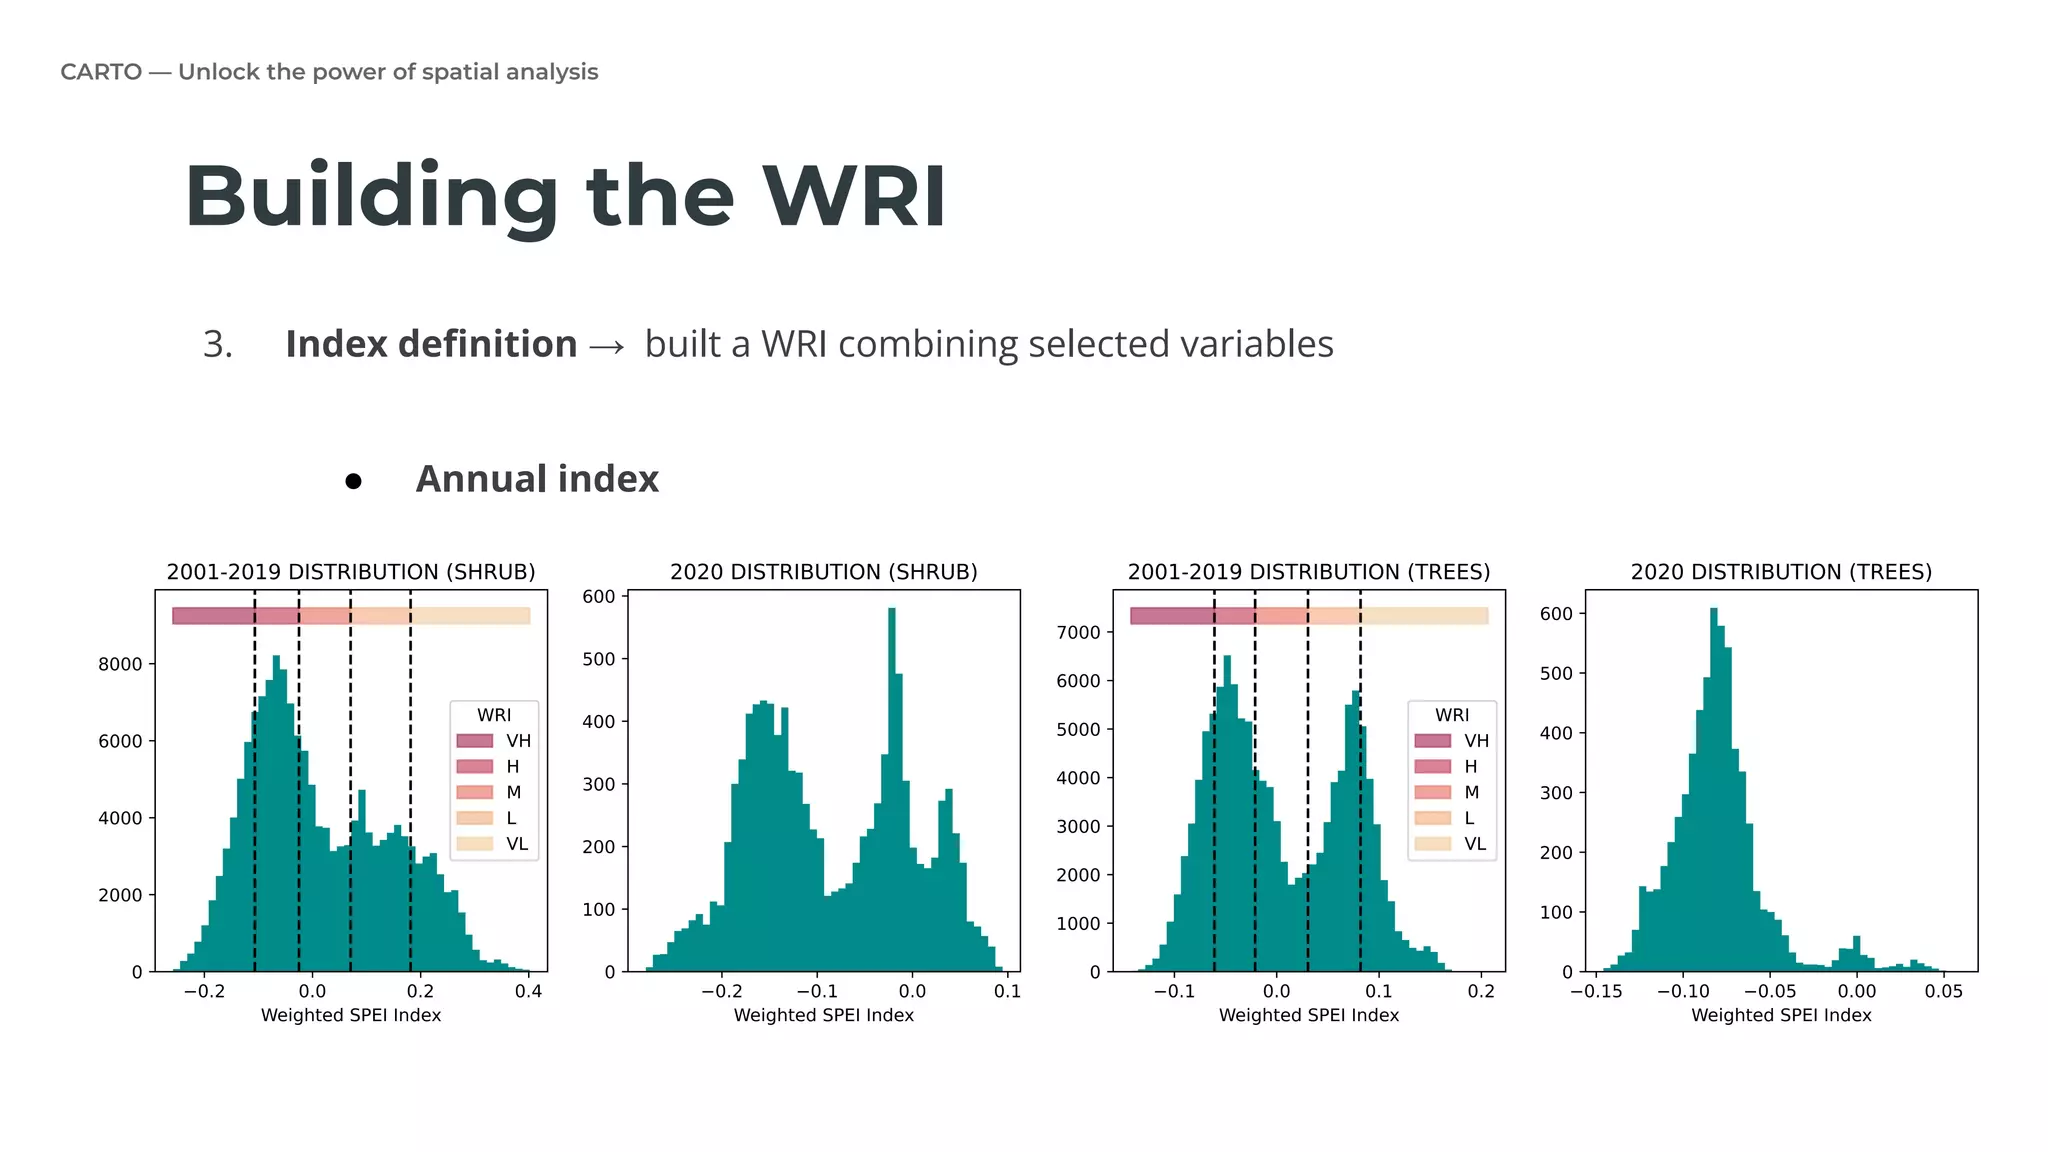
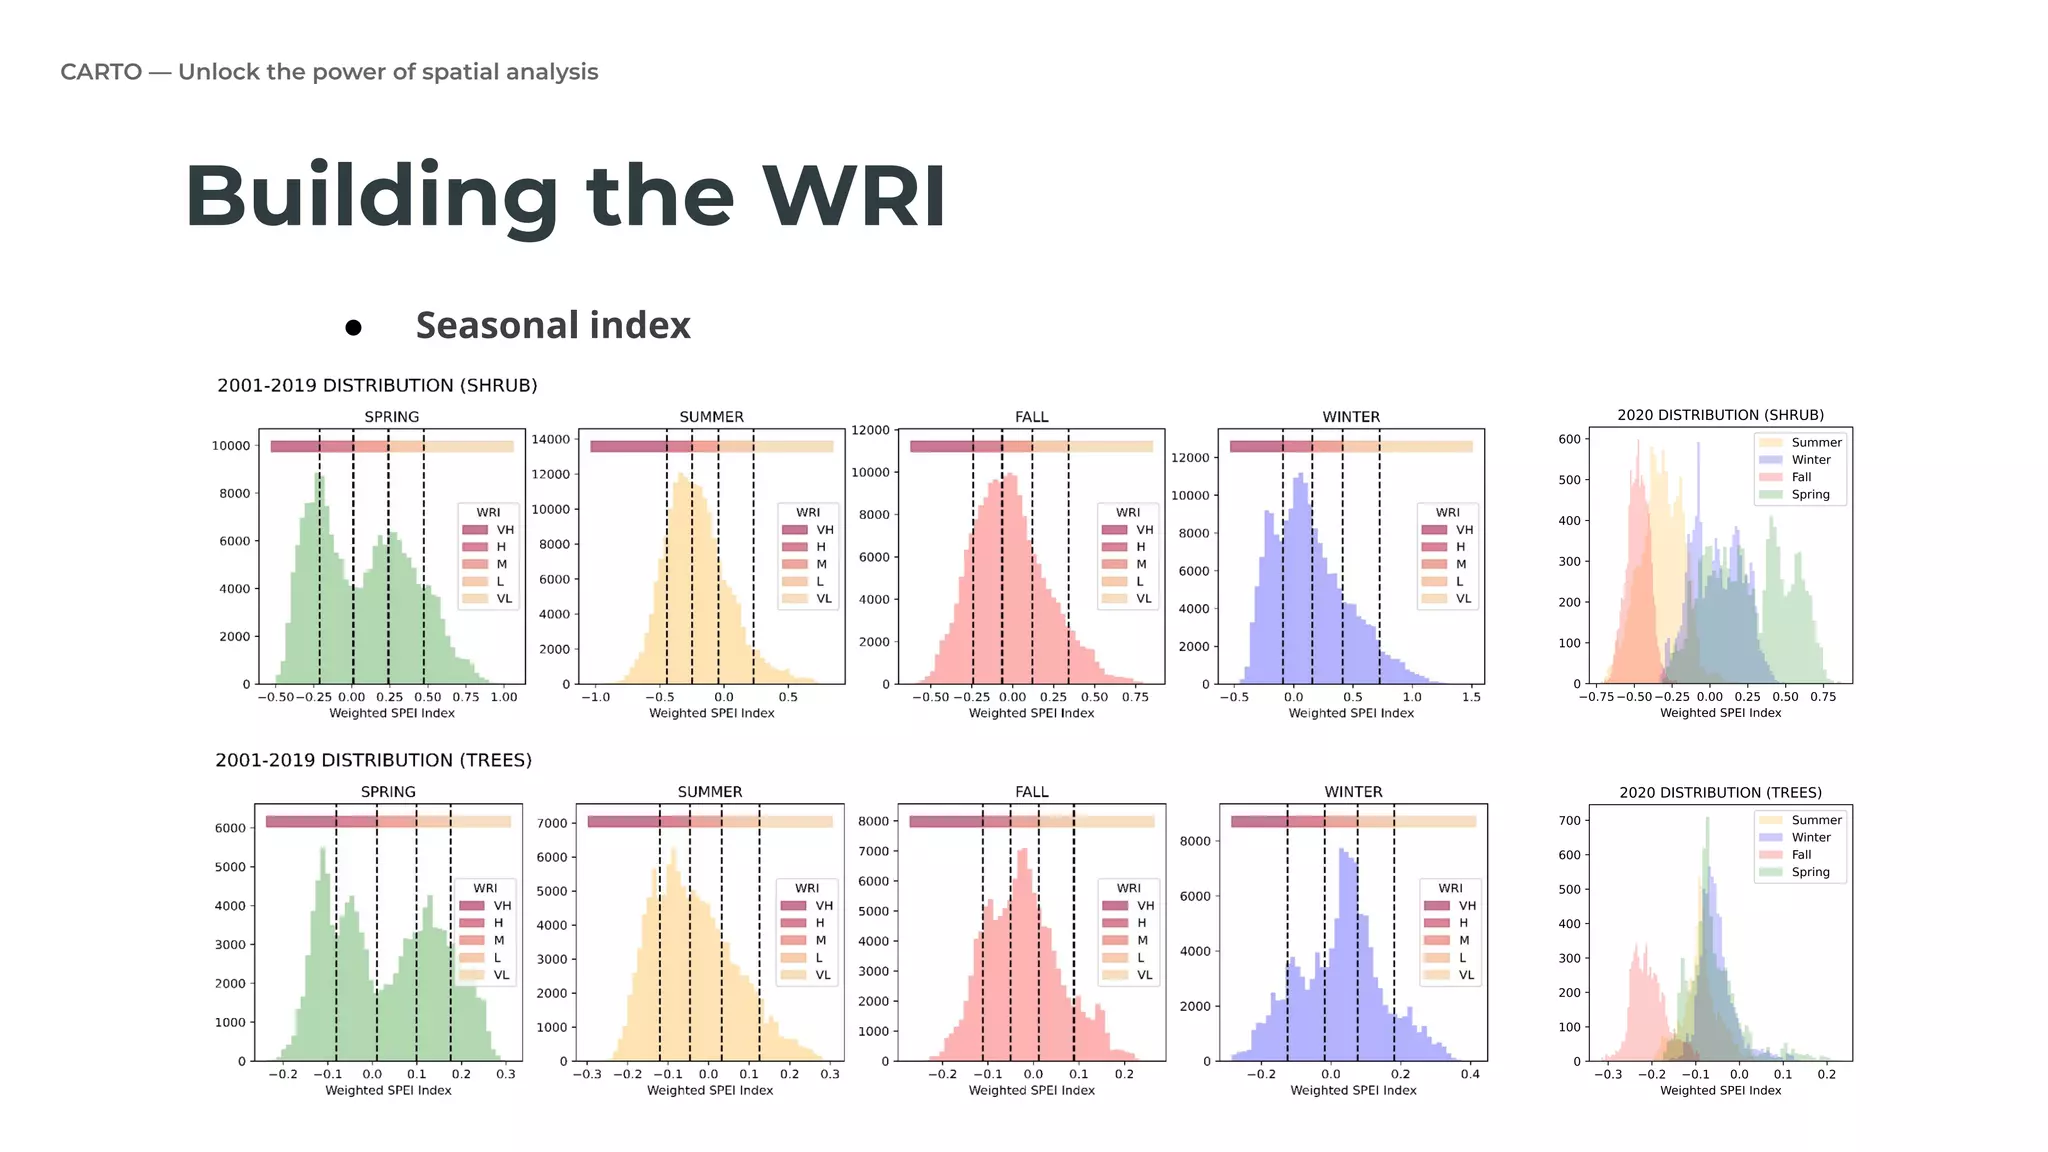
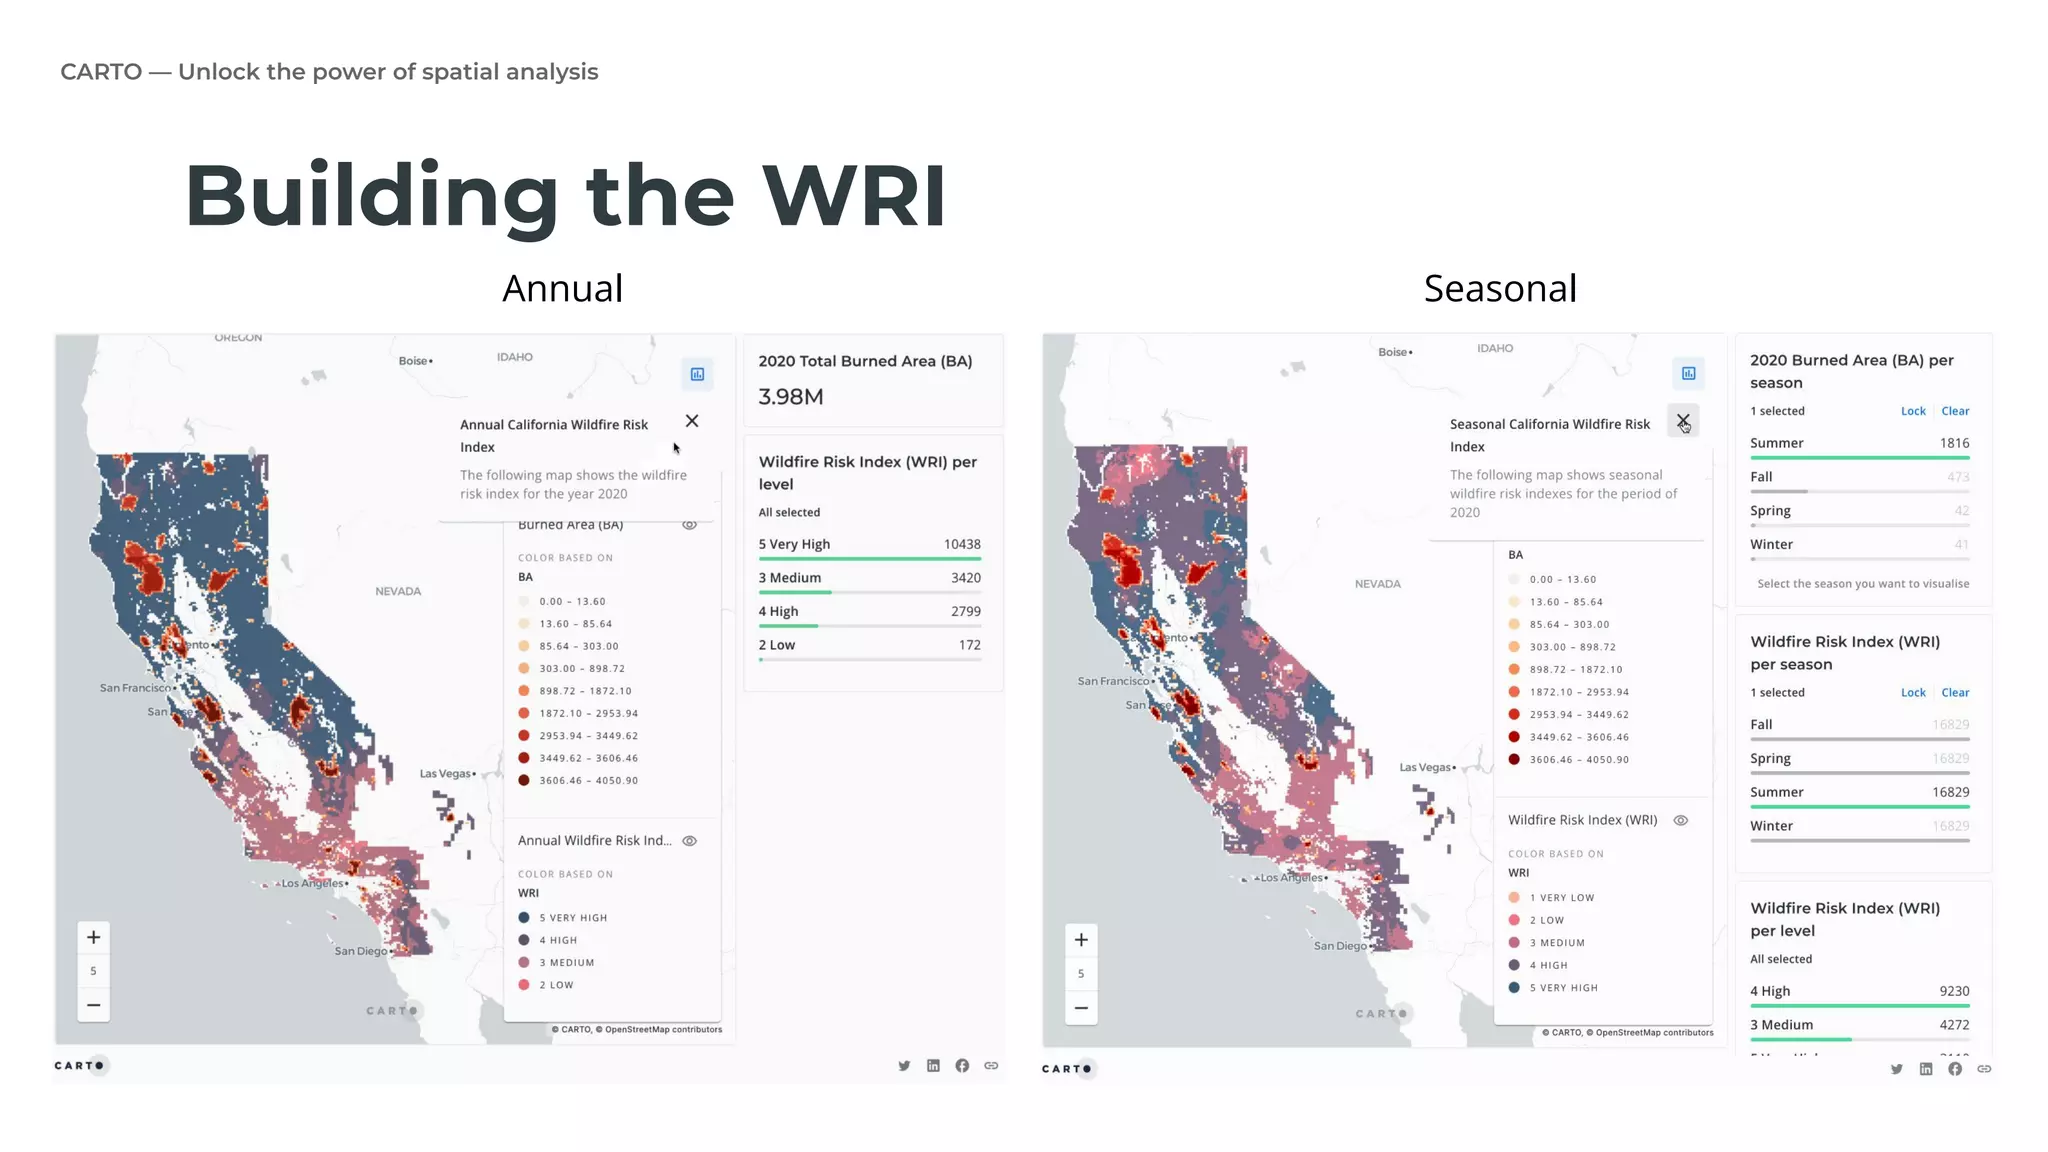
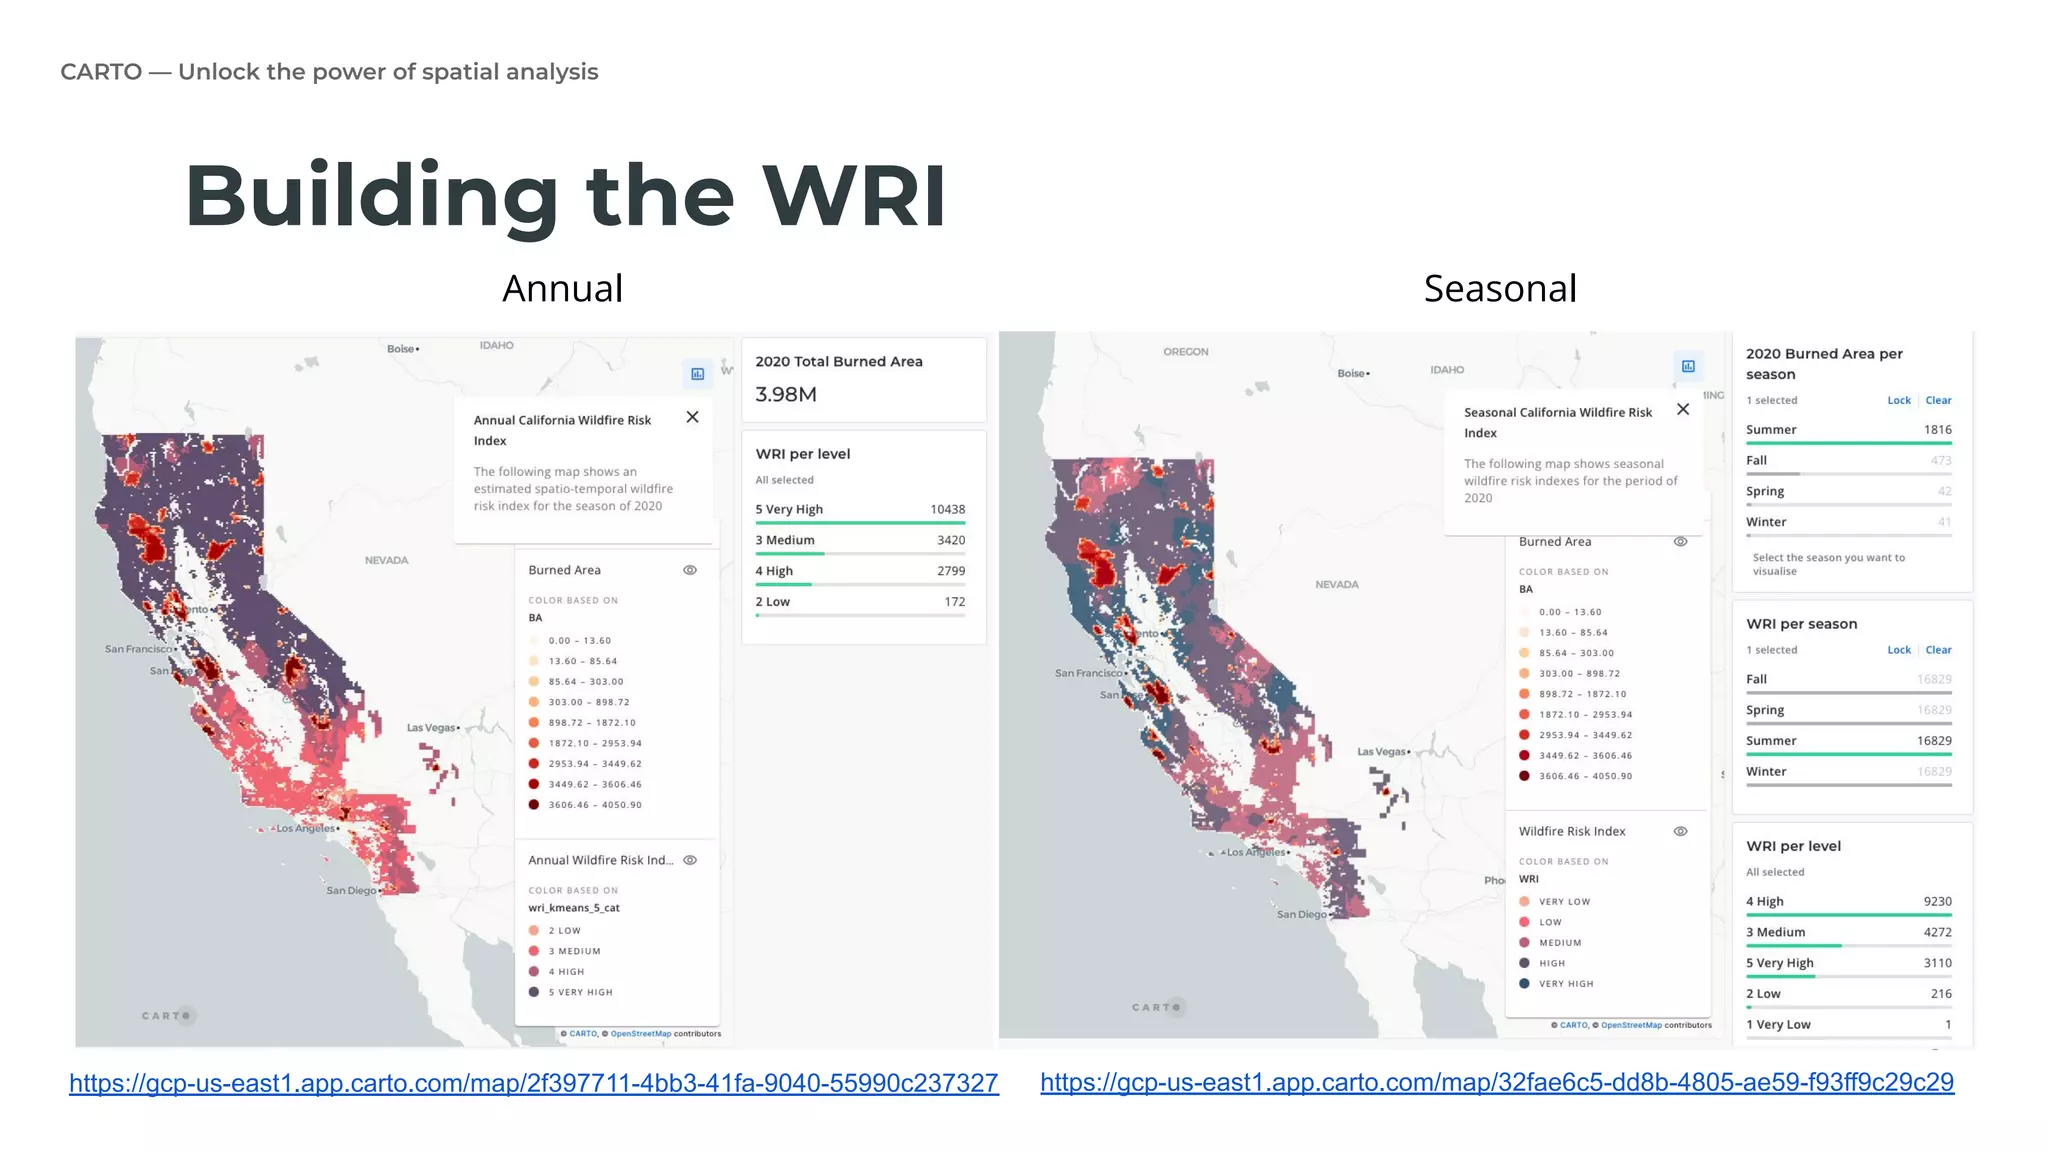
Processes for constructing the index include data clustering, selection of fire precursors, and annual vs. seasonal indices.
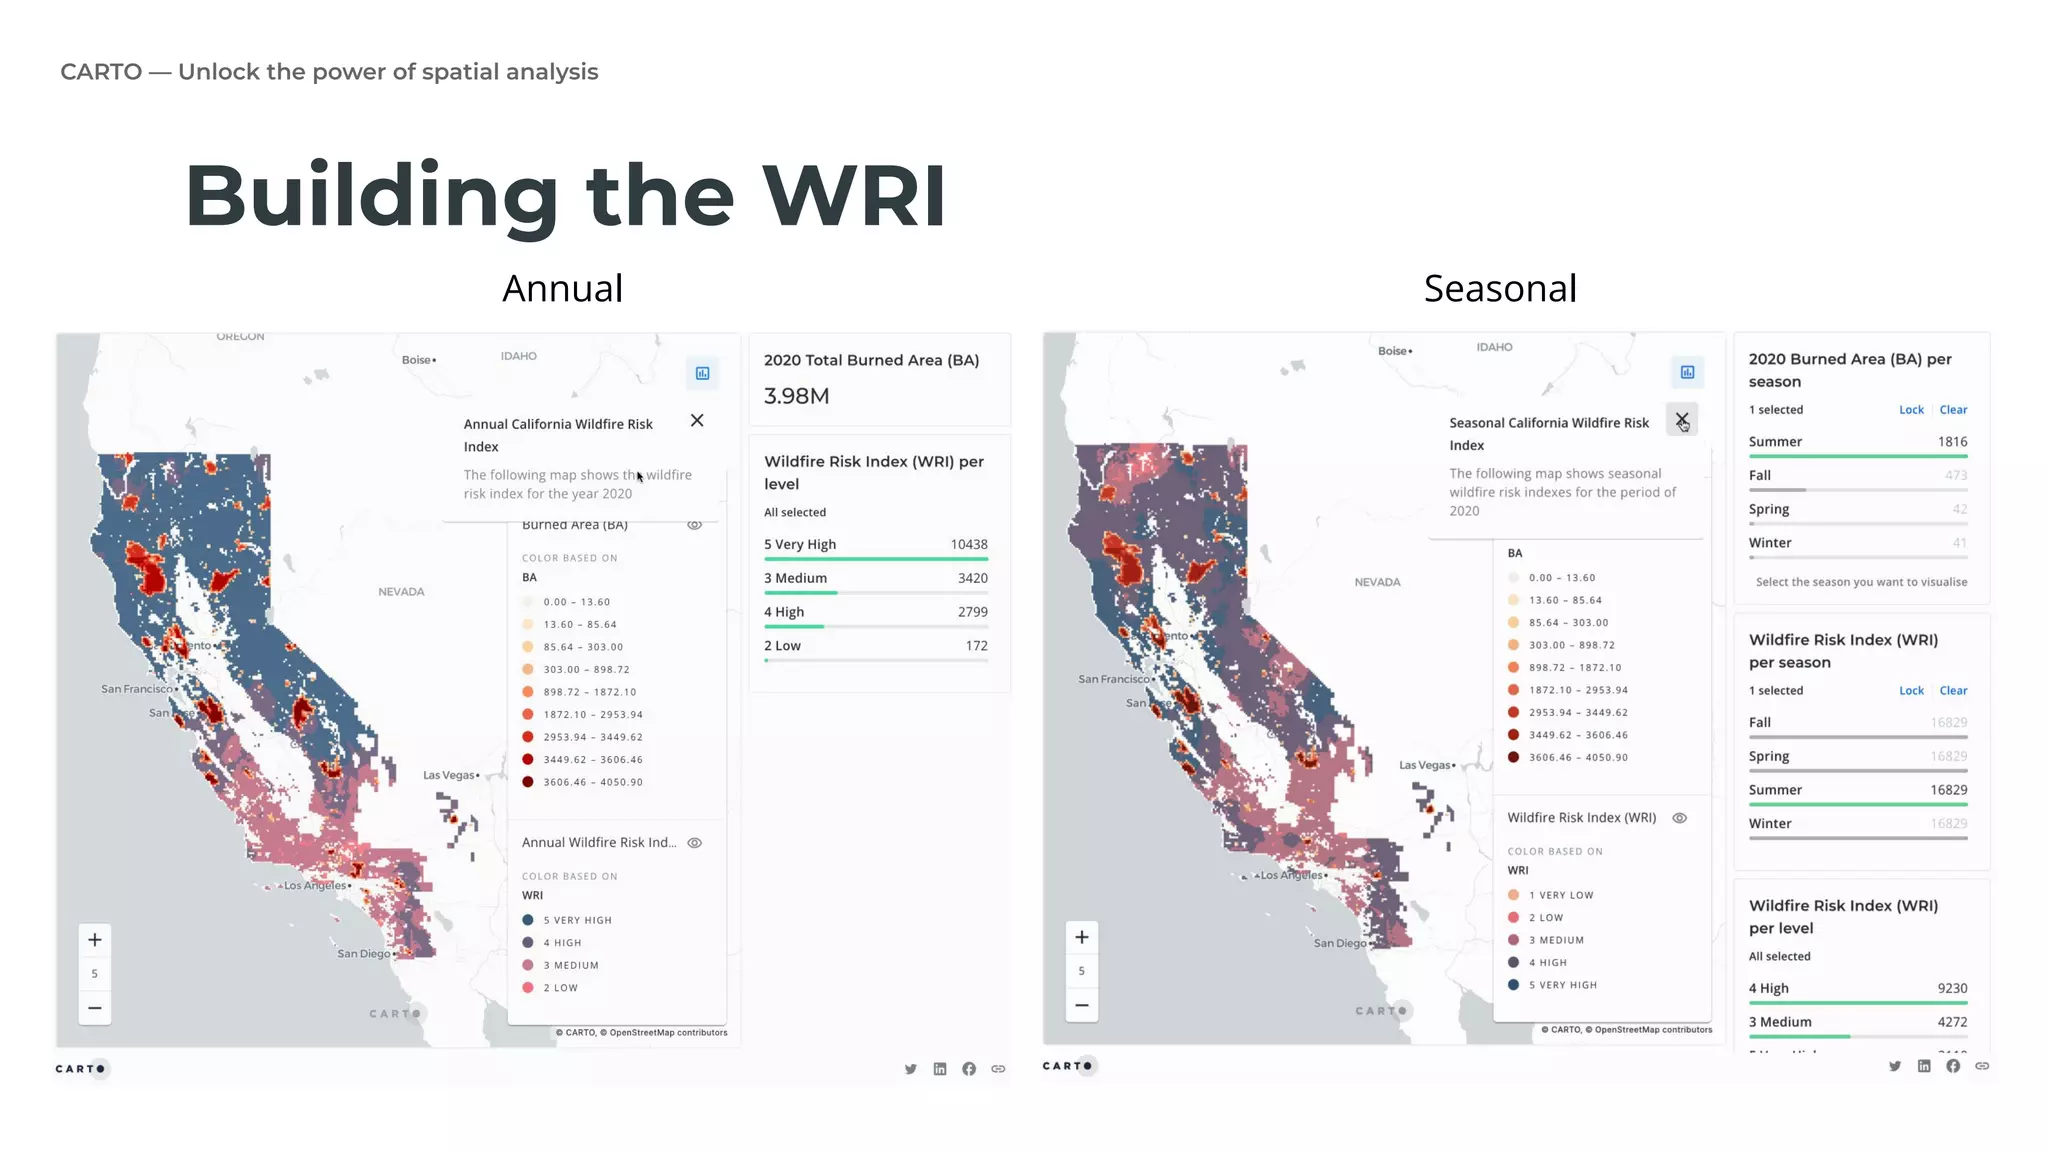
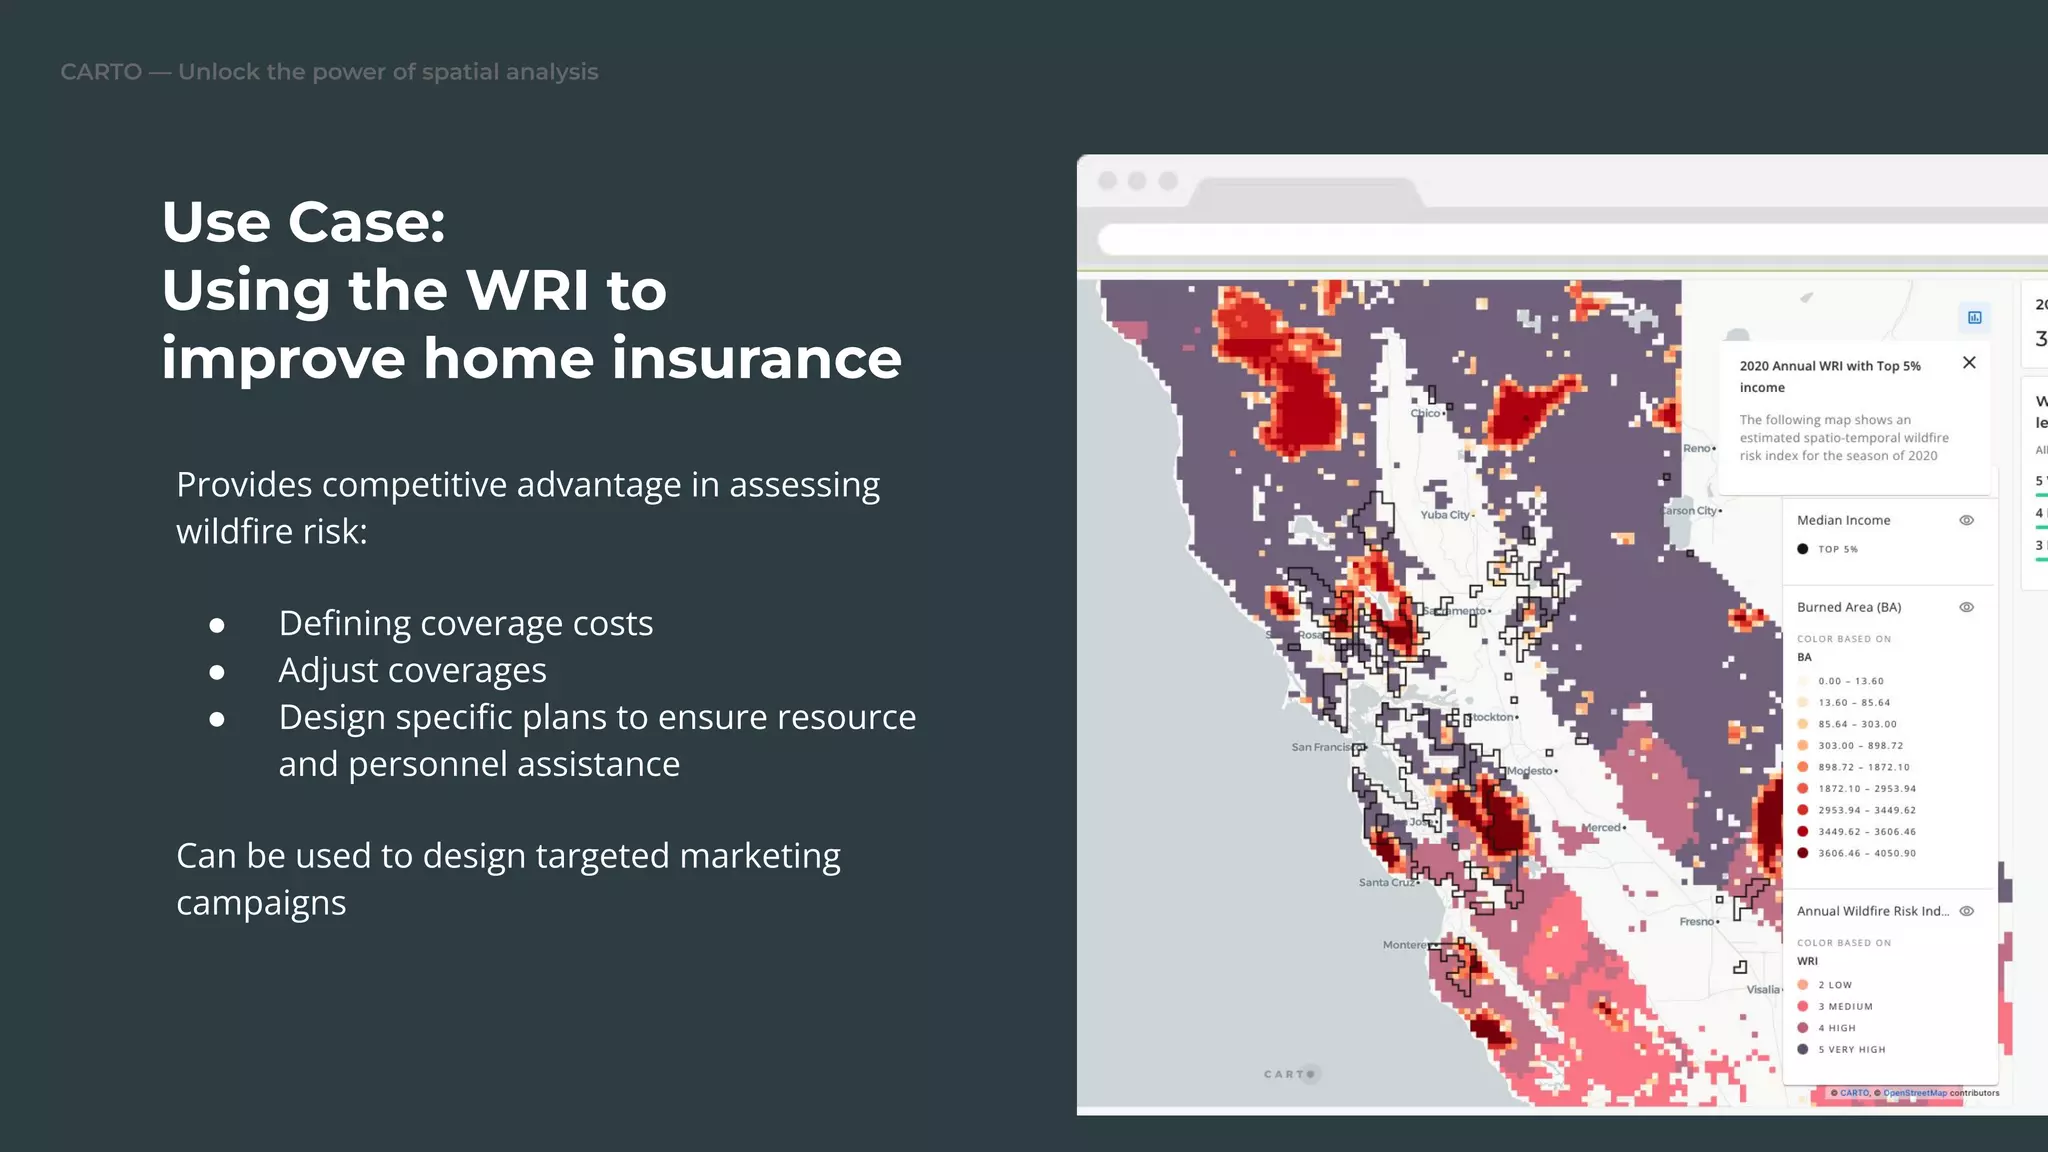
Details on the application of the WRI for insurance and resource management, providing competitive advantages.
Wrap-up of the presentation, inviting questions and providing contact details for further inquiries.


![[DSC Europe 25] Andy Cotgreave - Nothing is new in analytics.pptx](https://cdn.slidesharecdn.com/ss_thumbnails/mba4vzcurvoh5lfrd5zw-6-251205194645-341bbbbe-thumbnail.jpg?width=640&height=640&fit=bounds)

![[DSC Europe 25] Boris Perkovic - Lost in performance.pptx](https://cdn.slidesharecdn.com/ss_thumbnails/uq5hrp7vsuahqkxzifux-1-251204082258-fd2ee09d-thumbnail.jpg?width=640&height=640&fit=bounds)


![[DSC Europe 25] Dusan Jovicic - AI Story: From on-prem to cloud and back agai...](https://cdn.slidesharecdn.com/ss_thumbnails/8kp49m6uq22ifnbwhfnk-2-251205085715-964d11a6-thumbnail.jpg?width=640&height=640&fit=bounds)
![[DSC Europe 25] Jim Sterne - Adopting Generative AI Capabilities Into the Ent...](https://cdn.slidesharecdn.com/ss_thumbnails/sxhpofuorcagxsaulkmt-3-251204082258-7e66bc48-thumbnail.jpg?width=640&height=640&fit=bounds)
![[DSC Europe 25] Vid Stimac - Policy Parsimony: Between Oversimplifying and Ov...](https://cdn.slidesharecdn.com/ss_thumbnails/eqlepagzqp2rhg3gbluh-dsc-stimac-251120-251205090438-059e7f54-thumbnail.jpg?width=640&height=640&fit=bounds)


![[DSC Europe 25] Dragan Vucic - Building the Learning Organization - How AI Tr...](https://cdn.slidesharecdn.com/ss_thumbnails/8brigo2sbu6qur6gxrra-7-251205085715-6ae07d24-thumbnail.jpg?width=640&height=640&fit=bounds)

![[DSC Europe 25] Max Talanov - Non digital NNs.pptx](https://cdn.slidesharecdn.com/ss_thumbnails/wif8tr3gtua74qvtopke-non-digital-nns-251205090438-26b0eea6-thumbnail.jpg?width=640&height=640&fit=bounds)
![[DSC Europe 25] Petar Zivanov - AI meets documents From chatbots to AI-powere...](https://cdn.slidesharecdn.com/ss_thumbnails/xer2bb6nrdc8pdpev0pc-8-251204082258-7c2fa4a1-thumbnail.jpg?width=640&height=640&fit=bounds)
![[DSC Europe 25] Nikola Rajovic - Hardware Technologies Under the Hood: RISC-V...](https://cdn.slidesharecdn.com/ss_thumbnails/o2gptrmtoyqndgoshwgq-dsc2025-tenstorrent-rajovic-251205090438-814685f5-thumbnail.jpg?width=640&height=640&fit=bounds)
