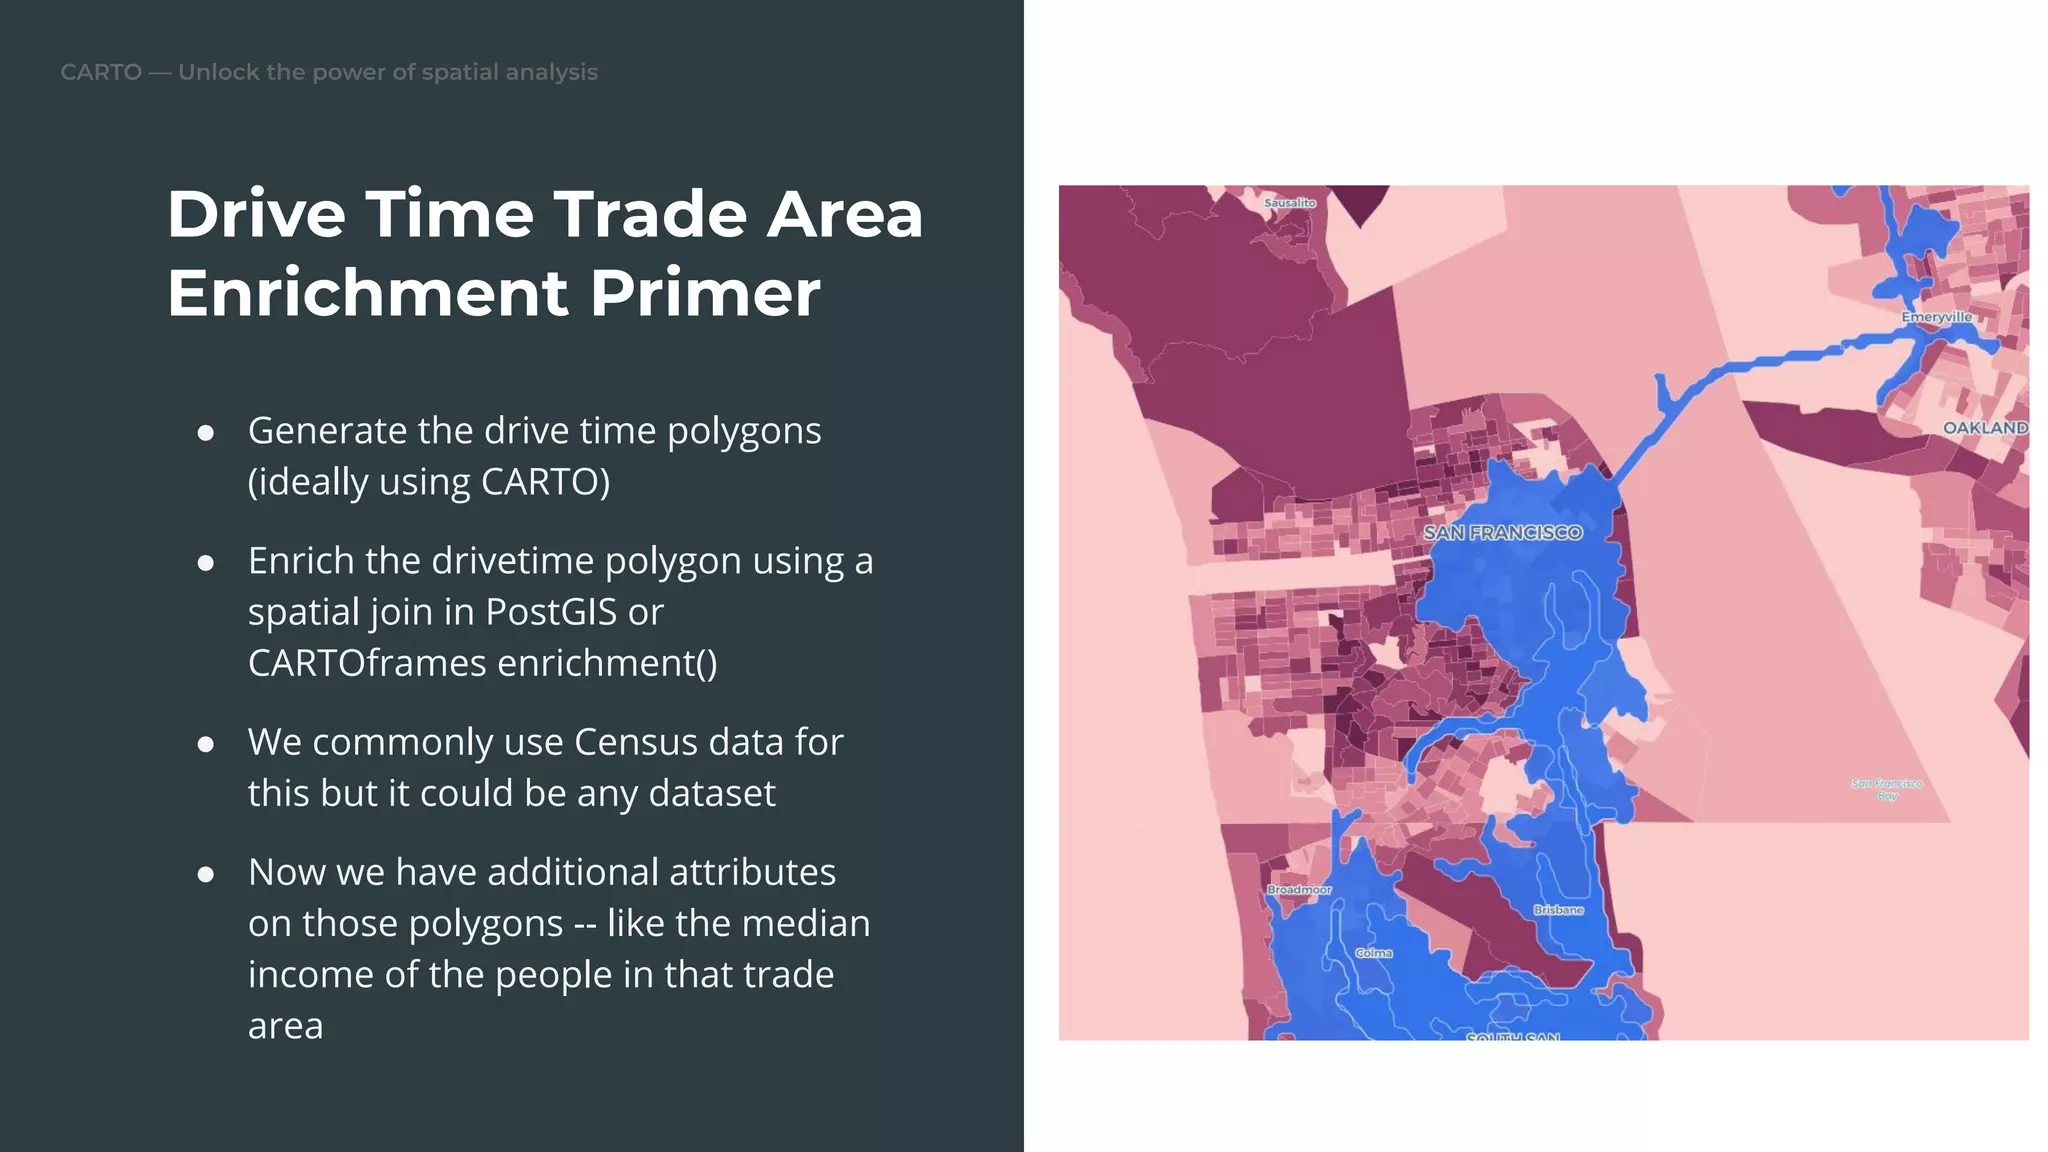
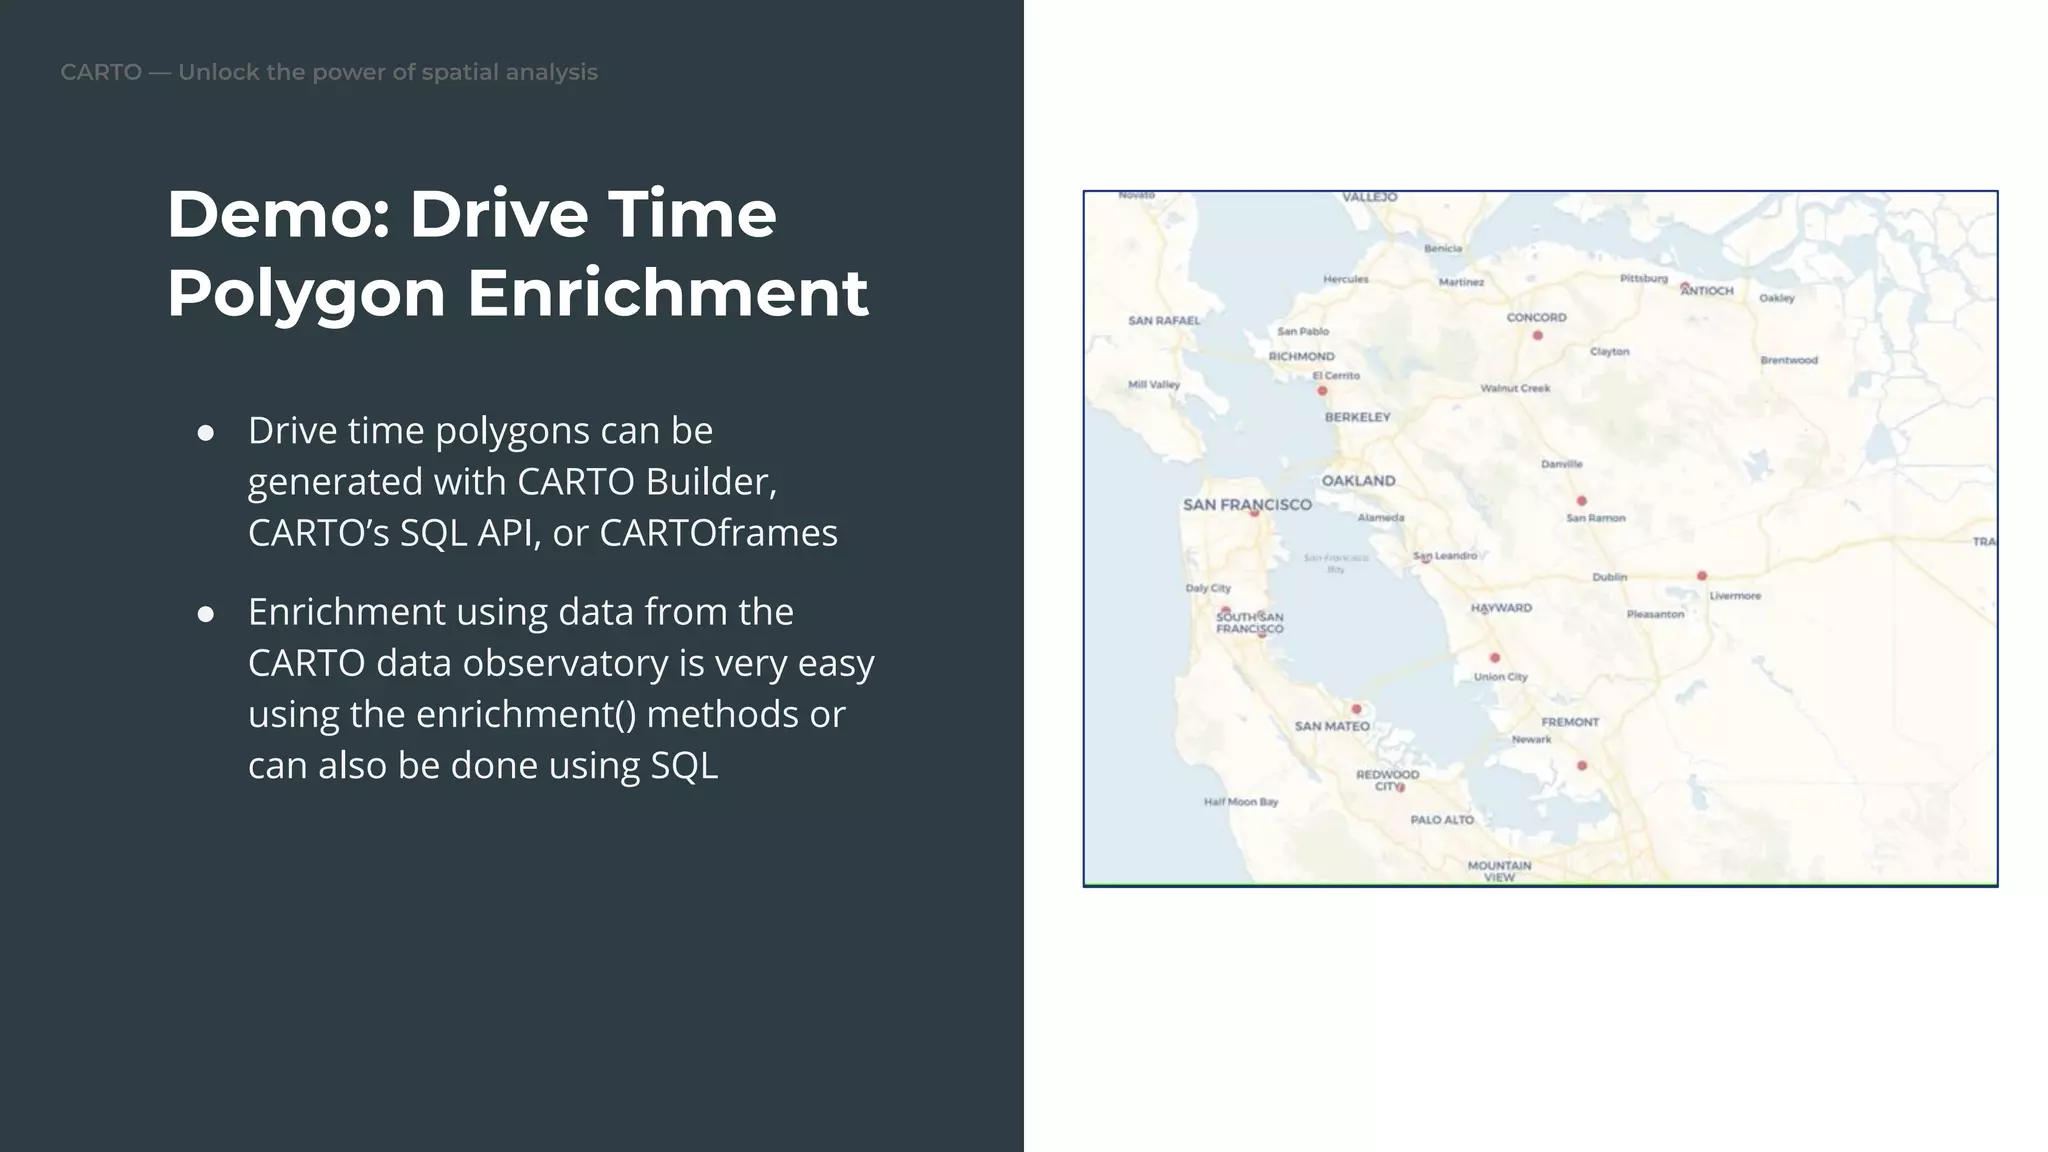
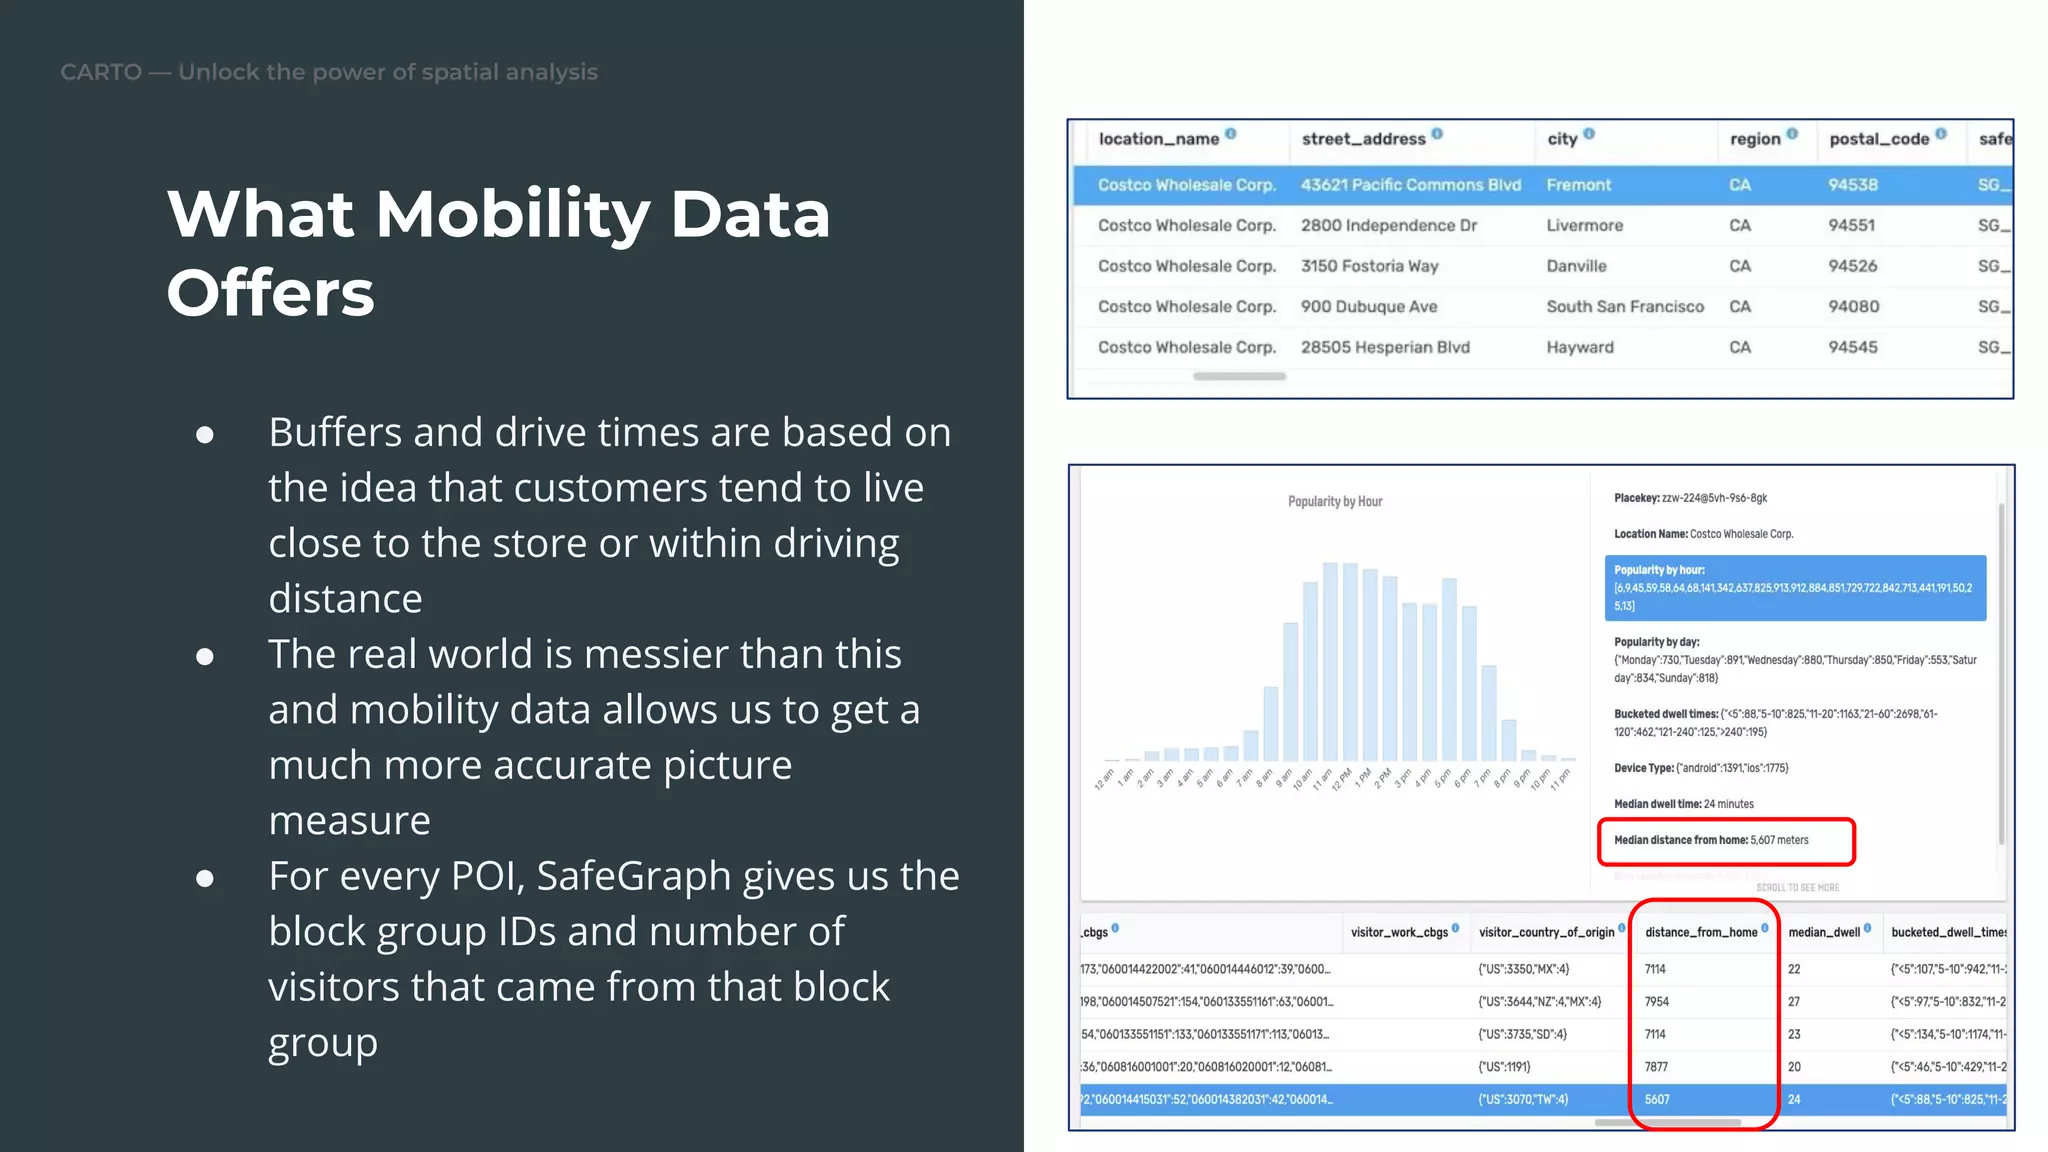
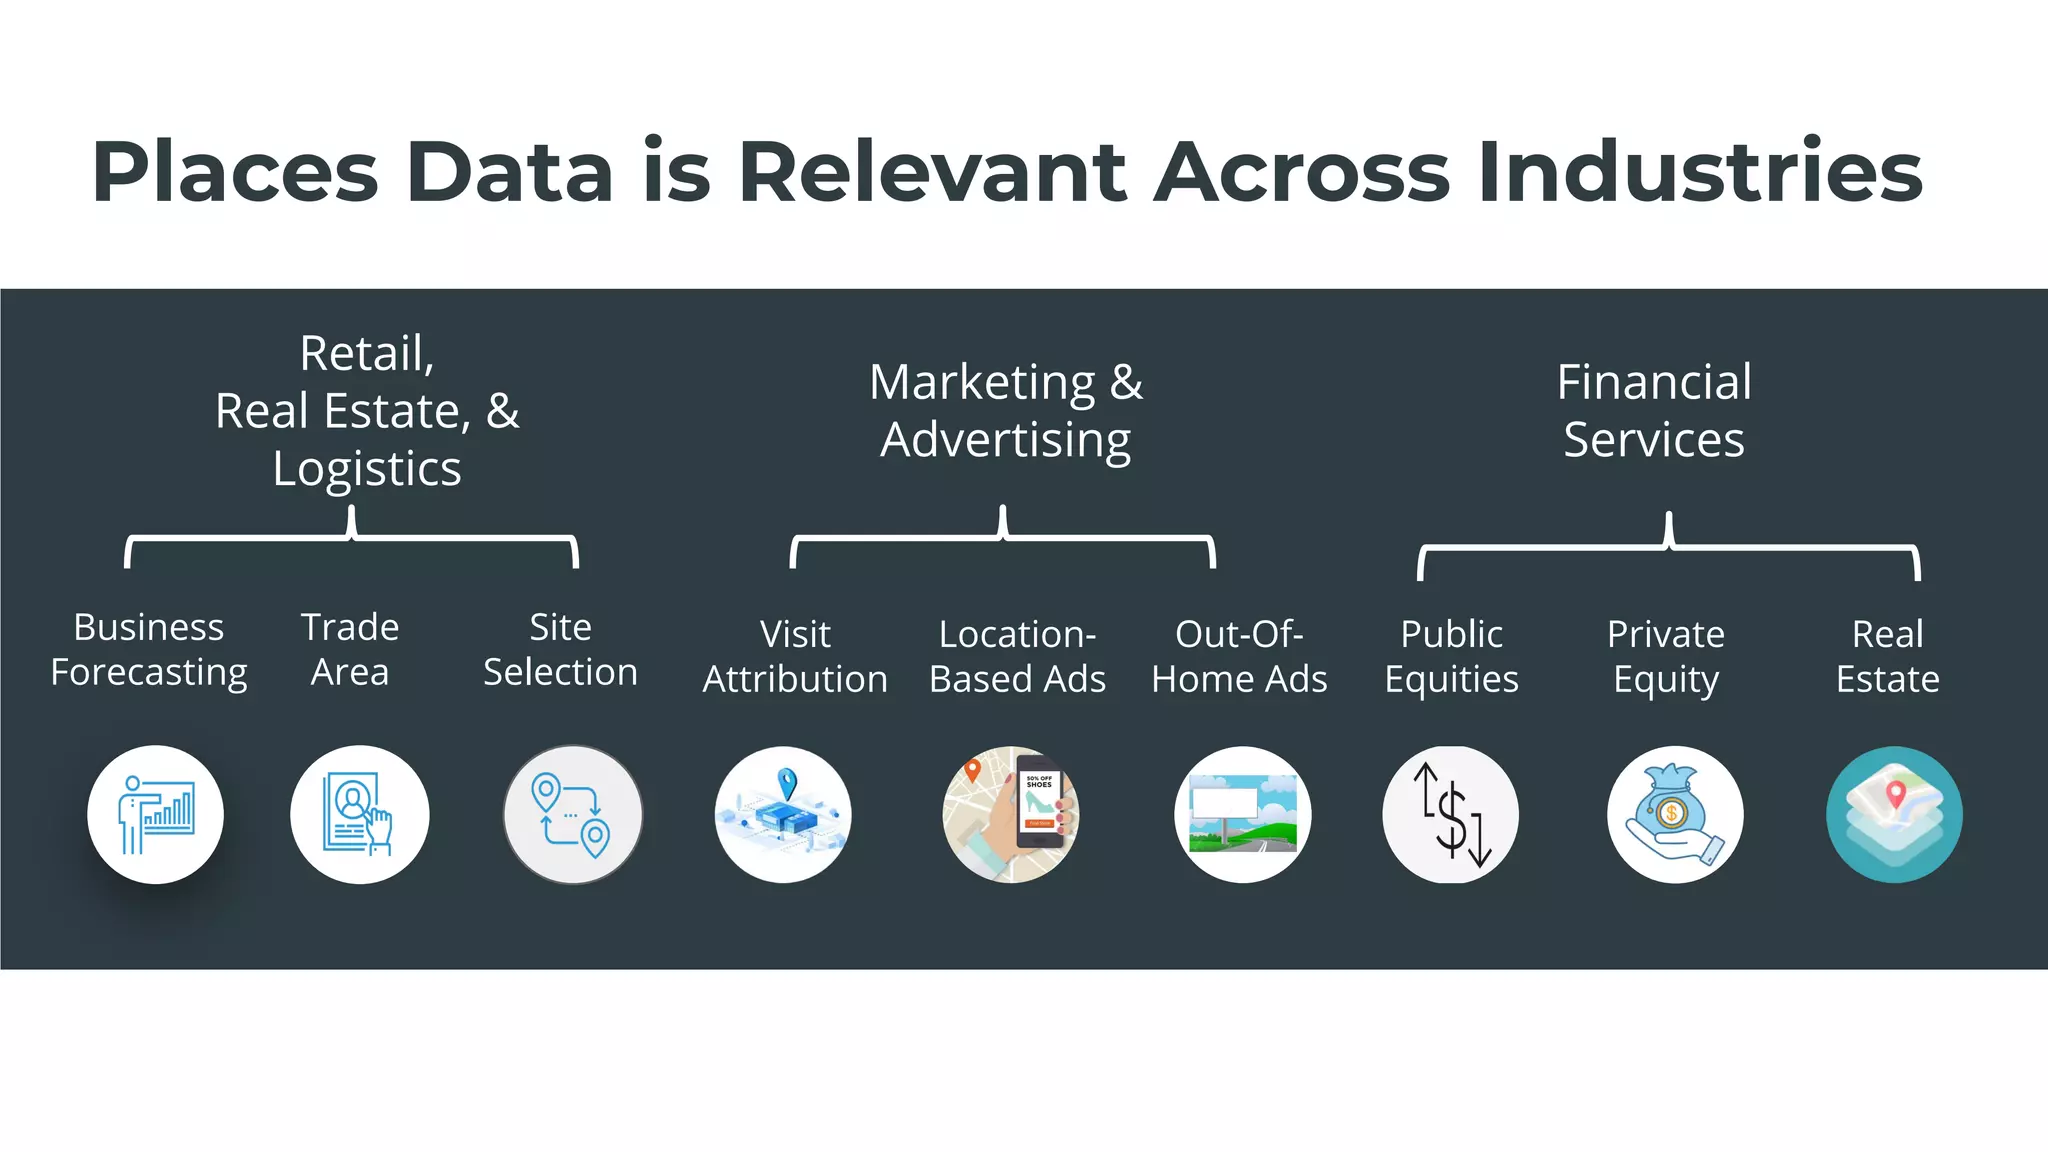
Understanding Retail
Catchment Areas with Human
Mobility Data
Follow @CARTO on Twitter
Introductions
Solutions Engineer at CARTO VP of Partnerships at SafeGraph
Agenda
● Background on trade areas and catchments
● Quick review of drive time trade areas
● Creating trade areas using mobility data
● Trade area enrichment notebook demo
● Diving deeper into SafeGraph’s mobility data
● Use cases for SafeGraph’s data
● Q&A Read more at:
carto.com/blog
● Know the difference between drive time vs. mobility
data trade areas
● Be able to generate your own mobility data trade
areas
● Understand what makes SafeGraph data different
and how to leverage that data properly
● Know where to go for more information, ideas, and
tools
Key Takeaways
● Catchments and Trade Areas
are used somewhat
interchangeably
● Trade Areas allow us to
understand the audience or
area that a location serves
● Based loosely on the idea of a
gravity model
Catchment and
Trade Areas
Poll
What data are you currently using
to identify trade areas?
3.0 - Mobility Data
Buffers → Drive Times → Mobility Data
1.0 - Buffers 2.0 - Drive Times
How it started How it’s going
Drive Time Trade Area
Enrichment Primer
● Generate the drive time polygons
(ideally using CARTO)
● Enrich the drivetime polygon using a
spatial join in PostGIS or
CARTOframes enrichment()
● We commonly use Census data for
this but it could be any dataset
● Now we have additional attributes
on those polygons -- like the median
income of the people in that trade
area
Demo: Drive Time
Polygon Enrichment
● Drive time polygons can be
generated with CARTO Builder,
CARTO’s SQL API, or CARTOframes
● Enrichment using data from the
CARTO data observatory is very easy
using the enrichment() methods or
can also be done using SQL
What Mobility Data
Offers
● Buffers and drive times are based on
the idea that customers tend to live
close to the store or within driving
distance
● The real world is messier than this
and mobility data allows us to get a
much more accurate picture
measure
● For every POI, SafeGraph gives us the
block group IDs and number of
visitors that came from that block
group
Trade Areas with
Mobility Data
● SafeGraph gives us visitor home block
group IDs and the number of people who
came from that block group
● We can do a spatial intersection of those
visitor block groups with the ACS to enrich
them (with a weighted average)
● We now have a much closer proxy for the
real visitors/customers - something like
the ACS-derived median income should be
much more accurate
Demo: Bay Area
Costcos Analysis
● Costco median income for the trade areas
differs by as much as 30% (between the
trade area types)
● Drive times might be telling you one thing
but mobility data should ultimately be the
more accurate data source
● Median income is just the beginning and
purposefully simple for this example
● There could be all sorts of differences
between drivetime trade areas vs. mobility
data trade areas
● Drive time trade areas might be giving you an inaccurate
idea of who your customers and competitors are
● Mobility data can tell you where customers come from,
where else they go, how far they travel for one store vs.
another, and what time of day they tend to shop
● This can inform all sorts of product and marketing
decisions
Why Does This Matter?
Poll
What business decisions are your
trade area analyses powering?
Our Mission:
The Source of Truth for Physical
Places
Core Places
(POI)
Geometry Neighborhood
Patterns
Core attributes of +7MM POI Building footprints with
spatial hierarchy for POI
Census Block Group visit
patterns and mobility
insights
Over 7MM points of interest across 6,200 major brands in the U.S, Canada, & UK
SafeGraph’s Physical Places Data
Places
Patterns
Foot traffic insights for
places derived from
anonymized mobile
devices
Retail,
Real Estate, &
Logistics
Marketing &
Advertising
Visit
Attribution
Location-
Based Ads
Financial
Services
Business
Forecasting
Site
Selection
Trade
Area
Public
Equities
Private
Equity
Out-Of-
Home Ads
Real
Estate
Places Data is Relevant Across Industries
SafeGraph is in the Spatial Data Catalog
Thanks for listening!
Any questions?
Request a demo at CARTO.COM
Inspect POI and mobility data at shop.safegraph.com
Jonathan Wolf
VP of Partnerships at Safegraph // jonathan@safegraph.com
Kyle Pennell
Solutions Engineer at CARTO // kpennell@carto.com

Understanding Retail Catchment Areas with Human Mobility Data

  • 1.
    Understanding Retail Catchment Areaswith Human Mobility Data Follow @CARTO on Twitter
  • 2.
    Introductions Solutions Engineer atCARTO VP of Partnerships at SafeGraph
  • 3.
    Agenda ● Background ontrade areas and catchments ● Quick review of drive time trade areas ● Creating trade areas using mobility data ● Trade area enrichment notebook demo ● Diving deeper into SafeGraph’s mobility data ● Use cases for SafeGraph’s data ● Q&A Read more at: carto.com/blog
  • 4.
    ● Know thedifference between drive time vs. mobility data trade areas ● Be able to generate your own mobility data trade areas ● Understand what makes SafeGraph data different and how to leverage that data properly ● Know where to go for more information, ideas, and tools Key Takeaways
  • 5.
    ● Catchments andTrade Areas are used somewhat interchangeably ● Trade Areas allow us to understand the audience or area that a location serves ● Based loosely on the idea of a gravity model Catchment and Trade Areas
  • 6.
    Poll What data areyou currently using to identify trade areas?
  • 7.
    3.0 - MobilityData Buffers → Drive Times → Mobility Data 1.0 - Buffers 2.0 - Drive Times How it started How it’s going
  • 8.
    Drive Time TradeArea Enrichment Primer ● Generate the drive time polygons (ideally using CARTO) ● Enrich the drivetime polygon using a spatial join in PostGIS or CARTOframes enrichment() ● We commonly use Census data for this but it could be any dataset ● Now we have additional attributes on those polygons -- like the median income of the people in that trade area
  • 9.
    Demo: Drive Time PolygonEnrichment ● Drive time polygons can be generated with CARTO Builder, CARTO’s SQL API, or CARTOframes ● Enrichment using data from the CARTO data observatory is very easy using the enrichment() methods or can also be done using SQL
  • 10.
    What Mobility Data Offers ●Buffers and drive times are based on the idea that customers tend to live close to the store or within driving distance ● The real world is messier than this and mobility data allows us to get a much more accurate picture measure ● For every POI, SafeGraph gives us the block group IDs and number of visitors that came from that block group
  • 11.
    Trade Areas with MobilityData ● SafeGraph gives us visitor home block group IDs and the number of people who came from that block group ● We can do a spatial intersection of those visitor block groups with the ACS to enrich them (with a weighted average) ● We now have a much closer proxy for the real visitors/customers - something like the ACS-derived median income should be much more accurate
  • 12.
    Demo: Bay Area CostcosAnalysis ● Costco median income for the trade areas differs by as much as 30% (between the trade area types) ● Drive times might be telling you one thing but mobility data should ultimately be the more accurate data source ● Median income is just the beginning and purposefully simple for this example ● There could be all sorts of differences between drivetime trade areas vs. mobility data trade areas
  • 13.
    ● Drive timetrade areas might be giving you an inaccurate idea of who your customers and competitors are ● Mobility data can tell you where customers come from, where else they go, how far they travel for one store vs. another, and what time of day they tend to shop ● This can inform all sorts of product and marketing decisions Why Does This Matter?
  • 14.
    Poll What business decisionsare your trade area analyses powering?
  • 15.
    Our Mission: The Sourceof Truth for Physical Places
  • 16.
    Core Places (POI) Geometry Neighborhood Patterns Coreattributes of +7MM POI Building footprints with spatial hierarchy for POI Census Block Group visit patterns and mobility insights Over 7MM points of interest across 6,200 major brands in the U.S, Canada, & UK SafeGraph’s Physical Places Data Places Patterns Foot traffic insights for places derived from anonymized mobile devices
  • 17.
    Retail, Real Estate, & Logistics Marketing& Advertising Visit Attribution Location- Based Ads Financial Services Business Forecasting Site Selection Trade Area Public Equities Private Equity Out-Of- Home Ads Real Estate Places Data is Relevant Across Industries
  • 18.
    SafeGraph is inthe Spatial Data Catalog
  • 19.
    Thanks for listening! Anyquestions? Request a demo at CARTO.COM Inspect POI and mobility data at shop.safegraph.com Jonathan Wolf VP of Partnerships at Safegraph // jonathan@safegraph.com Kyle Pennell Solutions Engineer at CARTO // kpennell@carto.com