Download to read offline
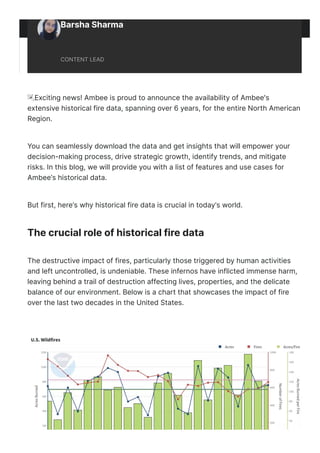
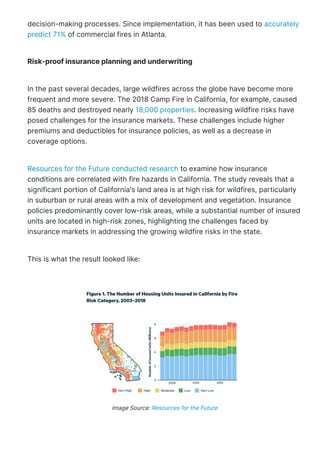

Ambee has launched an extensive historical wildfire dataset covering North America from 2017 to 2022, aimed at providing insights for risk assessment, strategic growth, and trend identification. The dataset outlines various parameters such as fire start and contained dates, burned area, and fire weather index, which help stakeholders understand and manage wildfire risks effectively. Historical fire data is crucial for improving fire forecasting, resource allocation, insurance planning, and studying the impact of climate change on fire patterns.