How to Separate Data in an Excel Column.pptx
•Download as PPTX, PDF•
0 likes•122 views
Excel is a great tool for storing, organizing, and tracking data. Sometimes the data comes in a way that needs to be cleaned up to be legible. This is a way to separate data in a column without having to do it manually.
Report
Share
Report
Share

Recommended
Vote Builder Tips
The document provides tips and tricks for using the VoteBuilder system. It discusses:
1. Adjusting the visible fields on voter lists by clicking the "Settings Cog" and dragging fields between boxes.
2. Saving page layouts by expanding sections once and clicking "Save Page Layout".
3. Sharing lists at the folder level by saving lists to folders, editing folder access, and selecting shared folders.
4. Restoring previous lists by clicking "More" and selecting "Restore Previous List".
Ms Access
This document provides an introduction and overview of key Access interface elements and functions for working with databases, including:
- The main screen contains the menu bar, tool bar, and object bar for navigating commands and creating database objects.
- Forms, queries, and reports can be created using wizards to present and retrieve data in a structured way. Forms allow adding, editing, and deleting records while queries selectively retrieve records based on criteria.
- Tables can be created to store data, and fields within tables can be added, edited, deleted, and have their data types and properties configured. Primary keys can also be set to uniquely identify records.
Access ppt
This document provides instructions for creating and working with databases in Microsoft Access. It explains that Access allows users to create, access, and manage databases on a computer. It then discusses how to start Access, create a new database using templates, and open existing database files. The document also covers how to create tables in Access using the datasheet and design views, and describes different data types and how to set field properties.
Ms access 2010 lesson 3 (Interface)
Ms Access 2010 contains a ribbon interface with tabs, groups, commands, and other screen elements like the status bar, navigation pane, and quick access toolbar. The ribbon contains tabs for common tasks like Home, Create, and Database Tools that group related commands. Other screen elements include the record selector for navigating records, navigation pane for accessing database objects, and view buttons for switching between views like Datasheet and Design views. The ribbon and its elements can be customized and hidden/displayed to suit the user's needs.
Microsoft Access 2010 - a jargon free guide
This document provides a brief overview and introduction to key features of Microsoft Access 2010 in simple, non-technical terms. It explains what MS Access is used for, how to plan and create a database, as well as how to generate tables, forms, queries and reports. It also highlights some new features in MS Access 2010 and promotes jargon-free training resources available on the provided website.
MS ACCESS (REPORT)
We use reports in our daily life. Now a days, computer is basic need of every place. MS ACCESS is used to present & analyse the data. Reports provide the most flexible way of viewing and printing summarized information. I hope this presentation will help you to prepare a report in MS Access.
Ms access basics ppt
This document provides an overview of Microsoft Access and how to create and manage databases. It discusses database files, tables, fields, and data types. It then explains how to create new databases and tables, enter and manipulate data, and generate forms and reports. The key steps covered include using wizards to easily set up databases, tables, forms and reports, and switching between design and datasheet views to enter and edit information.
Acct120 Class #14 Microsoft Excel Features
This document provides an introduction to using Microsoft Excel for an accounting course. It explains basic spreadsheet concepts and Excel features such as cells, columns, rows, formatting, entering data, altering cell sizes, inserting/deleting rows and columns, and using cut, copy and paste. Students are instructed to create a proper spreadsheet for accounting purposes based on a provided guide.
M s access
Microsoft Access allows users to create and manage databases. When first opening Access, a dialog box appears with options to create a new database or open an existing one. The user can then select the type of database to create. A database contains tables which hold data in fields with specific data types. Forms and reports allow easy viewing and manipulation of table data.
L3 ms access 2010 interface
MS Access 2010 contains a ribbon interface with tabs and commands organized into groups. It also includes a status bar, navigation pane, views, and a customizable quick access toolbar. The ribbon allows accessing tools to explore, create, import, and manage database objects and data. Key interface elements are the ribbon, file menu, Home, Create, External Data, Database Tools, and Fields tabs for accessing commands to work with Access objects, tables, queries and more.
Introduction to microsoft access
Microsoft Access is a powerful program for creating and managing databases. It allows users to construct tables with fields and records to organize data. Users can view and manipulate this data in a table or in alternate views like forms and reports. Forms present data from tables in a graphical interface, allowing users to easily add, update and delete records. Reports take the data and present it in a printed format designed by the user. Overall, Microsoft Access provides tools for structuring, editing, and presenting database information in an intuitive interface.
MS Excel 2010 tutorial 4
The document describes various formatting and editing features in Microsoft Excel 2010. It discusses how to adjust cell widths and heights, format cells by changing number formats, alignment, fonts, borders, and fill colors. It also covers inserting and deleting rows and columns, sorting data, and advanced features like hiding and unhiding rows and columns.
Excel.01
Excel is a spreadsheet program used to store and analyze data. It contains workbooks made up of individual worksheets. The Excel window displays components like the active cell, column headings, formula bar, and sheet tabs. Formulas in Excel always begin with an equal sign and can contain arithmetic operators and functions. Users can enter, format, navigate between and manipulate data and cells using various keyboard shortcuts, mouse clicks, menus and toolbars in Excel.
Ms access
A database program allows you to store, find, analyze, manage, and share information. It contains tables to store data, queries to ask questions of data, forms for easy data entry and viewing, reports to present data in a printed format, pages for intranet and internet access, macros to automate tasks, and modules for more complex automation using programming code. Key aspects include creating tables with primary keys, building relationships between tables, designing queries using criteria, creating forms to view and edit data, and generating reports to output data. Macros can automate common tasks like opening forms or printing reports.
B.sc i cs u 4 introduction to ms access
This document provides an introduction to Microsoft Access, including key concepts like databases, tables, fields, and data types. It explains how to get started with Access by creating or opening a database. It describes how to build tables with fields and define primary keys. It also covers manipulating data in tables, creating and working with forms and reports, and switching between views like design view and datasheet view. The document serves as a tutorial for getting acquainted with the basic features and functionality of Microsoft Access.
B.sc i bio chem u 4 introduction to ms access
This document provides an introduction to Microsoft Access, including key concepts like databases, tables, fields, and data types. It explains how to get started with Access by creating or opening a database. It describes how to build tables with fields and define primary keys. It also covers manipulating data in tables, creating and working with forms and reports, and switching between views like design view and datasheet view. The document serves as a tutorial for getting acquainted with the basic features and functionality of Microsoft Access.
Tutorial - How to Create a Report
The document provides instructions for creating and running membership reports in Shelby. It explains how to access the Reports section, create a new report by clicking the paper icon, select the site(s) to include, choose which types of members to include (active, inactive, deleted), select which fields of information to display, and output the report as a PDF or text file. The instructions also provide details for specific membership list reports, such as how to select address and phone number types.
Excel 2007 for Retail
Excel is an application used to create spreadsheets containing numerical values, formulas, and charts. It allows users to enter data into cells organized into rows and columns and perform calculations on that data. The basic elements of an Excel file include worksheets containing grids of cells organized by column letters and row numbers, grouped together in workbooks. Formulas and functions can be used to calculate and analyze the data in cells. Common tasks like formatting, sorting, conditional formatting, and summarizing data help users understand and visualize information in Excel spreadsheets.
Creating a business letter proj 3
This document provides instructions on formatting elements for business letters, including:
1) Letterheads should contain the sender's name, address, phone number, and email at the top of the page. Elements can be centered or placed at the top and bottom.
2) Setting margins creates borders around the page and can be customized.
3) Tables organize text into rows and columns and allow navigation and formatting using keyboard shortcuts or the ribbon.
4) Formatting objects like images and adjusting properties like brightness and transparency can make documents more professional.
Access07 l1 ch2
This document discusses how to create relationships between database tables in Microsoft Access 2007. It explains how to define primary and foreign keys to link tables together, and how to establish one-to-many relationships between tables by dragging fields. It also covers printing relationship reports, displaying related data in subdatasheets, and managing relationships and subdatasheets.
G Sheets introduction
Google Sheets is a web-based spreadsheet program similar to Excel that allows users to store, organize, and analyze data. Users can create a new blank spreadsheet in Google Drive by clicking "New" and selecting Google Sheets. A spreadsheet is made up of cells organized into rows and columns, with cells referenced by their row and column labels like A1. Basic functions in Sheets include entering data, selecting cell ranges, resizing columns and rows, and formatting text.
MS Access 2007 in ITT
learning and step wise description to work in ms access
project was made in ITT programme while doing CA
Ms excel AND EXCEL CHARTS
This document provides an overview of MS Excel and its features:
- MS Excel is a commonly used spreadsheet program for storing and analyzing numerical data in an organized manner. Data can be easily filtered, recovered, and manipulated using mathematical formulas.
- Excel allows for easy visualization of data through tables and various chart types like column, line, pie, and bar charts. Chart elements, styles, and colors can be customized.
- Key features include unlimited data storage, password protection, and the ability to perform calculations using functions like SUM.
Access 2007 Training
The document discusses how to create and manage a simple movie database using Microsoft Access. It defines key database concepts like tables, records, fields and primary keys. It then provides step-by-step instructions on how to use Access to create tables for movies and directors, define fields, enter record data, and view records using forms.
MS Word Advanced Training
Training overview for MS Word Advanced. Authors: Michael Sheyahshe & Mary Skaggs. (c) 2008 www.alterNativeMedia.biz
Relational models
A relational database management system (RDBMS) is a database management system (DBMS) that is based on relational model as introduced by E.F. Codd.
Users Guide To Microsoft Word Tables
Aligning Text in a Microsoft Word Document can be a tedious task if you try to do it
using only Tabs and Spaces.
Fortunately, Word has a Table feature which you can
use to present the same information but in a more structured and easy-to-read
format.
MS Word Table Feature helps Creating
Tabular Data, Managing their Structures and Dimensions, Formatting them, and
Displaying them in a form that you most desire.
Time Saving Data Entry Tips and Tricks - Data Entry India Outsource
Read the time-saving data entry tips, tricks & key shortcuts by DEIO to save your time that results in the best entries of data in a short period of time. For more info - https://www.dataentryindiaoutsource.com/blog/time-saving-data-entry-tips-tricks/
kiromax.ppt
This document provides an overview of spreadsheets and Microsoft Excel. It discusses how Excel allows users to perform calculations, organize and analyze data. Common uses of spreadsheets include sales, accounting, scheduling and inventory. The document then reviews Excel basics like worksheets, cells, formatting, sorting, inserting/deleting rows and columns. It provides instructions for entering labels and values, cutting/copying/pasting, and formatting cells.
Setting Line Spacing in Business MemosAt the top of a document.docx
Setting Line Spacing in Business Memos
At the top of a document after you open it move the cursor to the top left corner and open the Paragraph dialogue box to set the spacing info and tab setting as shown below before you move forward with any other part of the memo. Then, click on the “Set a Default” button. Sometimes it stays, other times it does not. If you find you need to readjust to the setting below, put the cursor anywhere in the document, highlight the whole document (I use Ctrl + A), right click on the highlighted area/document, and click on Paragraph. The box below will open up, and set info as shown below. Also works for specific document areas.
At the top of a memo, where you double space the Date, To, From, and Subject, hit the Enter key twice to achieve the double spacing. Applies to other places in the memo where you need to double space between sections.
Correct spacing.
See directions below to change the tab setting to 0.15 from the standard setting.
Setting Tab Spacing to 0.15
For tab setting, set to 0.15, and don’t use 0.5, in the “Default tab stops:” area in the upper right corner. Hit OK. Provides more finite spacing with lists, outlines, etc.
Change to this number from standard size.
Initial Formatting Memo Information
When setting up a memo, you start with single line spacing and zero, as shown above. For the Date, To, From, and Subject, you hit the Enter key twice to produce the double space required in business memo writing. You tab over to generate the straight line effect when adding information after the colon, as shown below.
Click to show paragraph marks and other hidden formatting information.
Click again to hide information.
Numbering Pages
Number your pages. Find the number feature under the Insert tab, highlighted in yellow below will be the title Page Number.
Click on the arrow in the bottom right corner to select the desired pagination option and style.
Insert tab
Borders and Shading
Borders
Left click on the mouse in a highlighted section in a table to see a column pop up, and in the middle of the pop up you will see a row labeled Borders and Shading. Left click on Borders and Shading, and the box below will pop up. You have three options: Borders, Page Borders, and Shading. You can use the mouse to select one of the other tabs, or use the keyboard: Borders (Alt + B); Page Borders (Alt + P), or Shading (Alt + S), which you will see below.
You have a selection of features: Style to select a line; Color to choose a color; Width to select how bold to make a line; and other features. Use these to enhance your tables.
Click when done to add to the table.
Borders and Shading
Page Border
To enhance the border of a table, you have selections, similar to the choices above.
Border and Shading
Shading
Use shading to highlight a table (rows or columns) to make information stick out. On the next page, you will see an example with more di.
More Related Content
What's hot
M s access
Microsoft Access allows users to create and manage databases. When first opening Access, a dialog box appears with options to create a new database or open an existing one. The user can then select the type of database to create. A database contains tables which hold data in fields with specific data types. Forms and reports allow easy viewing and manipulation of table data.
L3 ms access 2010 interface
MS Access 2010 contains a ribbon interface with tabs and commands organized into groups. It also includes a status bar, navigation pane, views, and a customizable quick access toolbar. The ribbon allows accessing tools to explore, create, import, and manage database objects and data. Key interface elements are the ribbon, file menu, Home, Create, External Data, Database Tools, and Fields tabs for accessing commands to work with Access objects, tables, queries and more.
Introduction to microsoft access
Microsoft Access is a powerful program for creating and managing databases. It allows users to construct tables with fields and records to organize data. Users can view and manipulate this data in a table or in alternate views like forms and reports. Forms present data from tables in a graphical interface, allowing users to easily add, update and delete records. Reports take the data and present it in a printed format designed by the user. Overall, Microsoft Access provides tools for structuring, editing, and presenting database information in an intuitive interface.
MS Excel 2010 tutorial 4
The document describes various formatting and editing features in Microsoft Excel 2010. It discusses how to adjust cell widths and heights, format cells by changing number formats, alignment, fonts, borders, and fill colors. It also covers inserting and deleting rows and columns, sorting data, and advanced features like hiding and unhiding rows and columns.
Excel.01
Excel is a spreadsheet program used to store and analyze data. It contains workbooks made up of individual worksheets. The Excel window displays components like the active cell, column headings, formula bar, and sheet tabs. Formulas in Excel always begin with an equal sign and can contain arithmetic operators and functions. Users can enter, format, navigate between and manipulate data and cells using various keyboard shortcuts, mouse clicks, menus and toolbars in Excel.
Ms access
A database program allows you to store, find, analyze, manage, and share information. It contains tables to store data, queries to ask questions of data, forms for easy data entry and viewing, reports to present data in a printed format, pages for intranet and internet access, macros to automate tasks, and modules for more complex automation using programming code. Key aspects include creating tables with primary keys, building relationships between tables, designing queries using criteria, creating forms to view and edit data, and generating reports to output data. Macros can automate common tasks like opening forms or printing reports.
B.sc i cs u 4 introduction to ms access
This document provides an introduction to Microsoft Access, including key concepts like databases, tables, fields, and data types. It explains how to get started with Access by creating or opening a database. It describes how to build tables with fields and define primary keys. It also covers manipulating data in tables, creating and working with forms and reports, and switching between views like design view and datasheet view. The document serves as a tutorial for getting acquainted with the basic features and functionality of Microsoft Access.
B.sc i bio chem u 4 introduction to ms access
This document provides an introduction to Microsoft Access, including key concepts like databases, tables, fields, and data types. It explains how to get started with Access by creating or opening a database. It describes how to build tables with fields and define primary keys. It also covers manipulating data in tables, creating and working with forms and reports, and switching between views like design view and datasheet view. The document serves as a tutorial for getting acquainted with the basic features and functionality of Microsoft Access.
Tutorial - How to Create a Report
The document provides instructions for creating and running membership reports in Shelby. It explains how to access the Reports section, create a new report by clicking the paper icon, select the site(s) to include, choose which types of members to include (active, inactive, deleted), select which fields of information to display, and output the report as a PDF or text file. The instructions also provide details for specific membership list reports, such as how to select address and phone number types.
Excel 2007 for Retail
Excel is an application used to create spreadsheets containing numerical values, formulas, and charts. It allows users to enter data into cells organized into rows and columns and perform calculations on that data. The basic elements of an Excel file include worksheets containing grids of cells organized by column letters and row numbers, grouped together in workbooks. Formulas and functions can be used to calculate and analyze the data in cells. Common tasks like formatting, sorting, conditional formatting, and summarizing data help users understand and visualize information in Excel spreadsheets.
Creating a business letter proj 3
This document provides instructions on formatting elements for business letters, including:
1) Letterheads should contain the sender's name, address, phone number, and email at the top of the page. Elements can be centered or placed at the top and bottom.
2) Setting margins creates borders around the page and can be customized.
3) Tables organize text into rows and columns and allow navigation and formatting using keyboard shortcuts or the ribbon.
4) Formatting objects like images and adjusting properties like brightness and transparency can make documents more professional.
Access07 l1 ch2
This document discusses how to create relationships between database tables in Microsoft Access 2007. It explains how to define primary and foreign keys to link tables together, and how to establish one-to-many relationships between tables by dragging fields. It also covers printing relationship reports, displaying related data in subdatasheets, and managing relationships and subdatasheets.
G Sheets introduction
Google Sheets is a web-based spreadsheet program similar to Excel that allows users to store, organize, and analyze data. Users can create a new blank spreadsheet in Google Drive by clicking "New" and selecting Google Sheets. A spreadsheet is made up of cells organized into rows and columns, with cells referenced by their row and column labels like A1. Basic functions in Sheets include entering data, selecting cell ranges, resizing columns and rows, and formatting text.
MS Access 2007 in ITT
learning and step wise description to work in ms access
project was made in ITT programme while doing CA
Ms excel AND EXCEL CHARTS
This document provides an overview of MS Excel and its features:
- MS Excel is a commonly used spreadsheet program for storing and analyzing numerical data in an organized manner. Data can be easily filtered, recovered, and manipulated using mathematical formulas.
- Excel allows for easy visualization of data through tables and various chart types like column, line, pie, and bar charts. Chart elements, styles, and colors can be customized.
- Key features include unlimited data storage, password protection, and the ability to perform calculations using functions like SUM.
Access 2007 Training
The document discusses how to create and manage a simple movie database using Microsoft Access. It defines key database concepts like tables, records, fields and primary keys. It then provides step-by-step instructions on how to use Access to create tables for movies and directors, define fields, enter record data, and view records using forms.
MS Word Advanced Training
Training overview for MS Word Advanced. Authors: Michael Sheyahshe & Mary Skaggs. (c) 2008 www.alterNativeMedia.biz
Relational models
A relational database management system (RDBMS) is a database management system (DBMS) that is based on relational model as introduced by E.F. Codd.
Users Guide To Microsoft Word Tables
Aligning Text in a Microsoft Word Document can be a tedious task if you try to do it
using only Tabs and Spaces.
Fortunately, Word has a Table feature which you can
use to present the same information but in a more structured and easy-to-read
format.
MS Word Table Feature helps Creating
Tabular Data, Managing their Structures and Dimensions, Formatting them, and
Displaying them in a form that you most desire.
What's hot (19)
Similar to How to Separate Data in an Excel Column.pptx
Time Saving Data Entry Tips and Tricks - Data Entry India Outsource
Read the time-saving data entry tips, tricks & key shortcuts by DEIO to save your time that results in the best entries of data in a short period of time. For more info - https://www.dataentryindiaoutsource.com/blog/time-saving-data-entry-tips-tricks/
kiromax.ppt
This document provides an overview of spreadsheets and Microsoft Excel. It discusses how Excel allows users to perform calculations, organize and analyze data. Common uses of spreadsheets include sales, accounting, scheduling and inventory. The document then reviews Excel basics like worksheets, cells, formatting, sorting, inserting/deleting rows and columns. It provides instructions for entering labels and values, cutting/copying/pasting, and formatting cells.
Setting Line Spacing in Business MemosAt the top of a document.docx
Setting Line Spacing in Business Memos
At the top of a document after you open it move the cursor to the top left corner and open the Paragraph dialogue box to set the spacing info and tab setting as shown below before you move forward with any other part of the memo. Then, click on the “Set a Default” button. Sometimes it stays, other times it does not. If you find you need to readjust to the setting below, put the cursor anywhere in the document, highlight the whole document (I use Ctrl + A), right click on the highlighted area/document, and click on Paragraph. The box below will open up, and set info as shown below. Also works for specific document areas.
At the top of a memo, where you double space the Date, To, From, and Subject, hit the Enter key twice to achieve the double spacing. Applies to other places in the memo where you need to double space between sections.
Correct spacing.
See directions below to change the tab setting to 0.15 from the standard setting.
Setting Tab Spacing to 0.15
For tab setting, set to 0.15, and don’t use 0.5, in the “Default tab stops:” area in the upper right corner. Hit OK. Provides more finite spacing with lists, outlines, etc.
Change to this number from standard size.
Initial Formatting Memo Information
When setting up a memo, you start with single line spacing and zero, as shown above. For the Date, To, From, and Subject, you hit the Enter key twice to produce the double space required in business memo writing. You tab over to generate the straight line effect when adding information after the colon, as shown below.
Click to show paragraph marks and other hidden formatting information.
Click again to hide information.
Numbering Pages
Number your pages. Find the number feature under the Insert tab, highlighted in yellow below will be the title Page Number.
Click on the arrow in the bottom right corner to select the desired pagination option and style.
Insert tab
Borders and Shading
Borders
Left click on the mouse in a highlighted section in a table to see a column pop up, and in the middle of the pop up you will see a row labeled Borders and Shading. Left click on Borders and Shading, and the box below will pop up. You have three options: Borders, Page Borders, and Shading. You can use the mouse to select one of the other tabs, or use the keyboard: Borders (Alt + B); Page Borders (Alt + P), or Shading (Alt + S), which you will see below.
You have a selection of features: Style to select a line; Color to choose a color; Width to select how bold to make a line; and other features. Use these to enhance your tables.
Click when done to add to the table.
Borders and Shading
Page Border
To enhance the border of a table, you have selections, similar to the choices above.
Border and Shading
Shading
Use shading to highlight a table (rows or columns) to make information stick out. On the next page, you will see an example with more di.
Excel pivot tables (1)
Pivot tables allow users to summarize and analyze data in Excel by aggregating and reorganizing the data into a new format determined by the user. The document provides a step-by-step tutorial on how to create a pivot table using sample voter data. Key steps include selecting the data range, inserting a pivot table on a new worksheet, and dragging fields from the pivot table field list to rows, columns, and values areas to choose how the data should be organized and summarized. Advanced techniques like filtering, moving fields, and customizing pivot table options are also demonstrated.
MS Access 2010 tutorial 3
The document provides instructions for creating tables in Microsoft Access 2010 using Table Design view. It describes how to define fields, data types, primary keys and field properties before entering data. Additional methods like creating a lookup field using the Lookup Wizard and freezing columns for data entry are also outlined. The summary provides the essential steps to set up a table structure and enter data.
Austingrimes databasesforbeginners
This document provides step-by-step instructions for beginners to create and use a basic database in Microsoft Access. It explains how to start Access, create a new database file, design database tables by adding field names and data types, enter data, and use filters, queries, sorting, and reports to view and organize information in the database.
111249-140817070204-phpapp02.pdf
eeeeeeeeeeeeeeeeeeeeeeeeeeeeeeeeeeeeeeeeeeeeeeeeeeeeeeeeeeeeeeeeeeeeeeeeeeeeeeeeeeeeeeeeeeeeeeeeeeeeeeeeeeeeeeeeeeeeeeeeeeeeeeeeeeeeeeeeeeeeeeeeeeeeeeeeeeeeeeeeeeeeeeeeeeeeeeeeeeeeeeeeeeeeeeeeeeeeeeeeeeeeeeeeeeeeeeeeeeeeeeeeeeeeeeeeeeeeeeeeeeeeeeeeeeeeeeeeeeeeeeeeeeeeeeeeeeeeeeeeeeeeeeeeeeeeeeeeeeeeeeeeeeeeeeeeeeeeeeeeeeeeeeeeeeeeeeeeeeeeeeeeeeeeeeeeeeeeeeeeeeeeeeeeeeeeee
SPSS How to use Spss software
This document provides an overview of using SPSS to analyze data. It discusses opening data files in SPSS, viewing the data, entering new data values, setting up variable properties like name, type, and label. It also covers running frequency analyses and descriptive statistics, computing new variables, and concludes that SPSS is a powerful tool for statistical analysis.
SACRAO Presentation T4.3.pdf
Scott Harvey, Registrar at Tri-County Technical College, presented on using Excel PivotTables to analyze student data. The presentation introduced PivotTables and how they can be used to summarize large amounts of student data from an Excel worksheet into concise reports. It covered preparing the source data, creating a PivotTable, adding filters, showing details, creating PivotCharts, and useful tips. The presentation concluded with a demonstration of PivotTables and how they can help answer questions about student enrollment numbers, majors, withdrawals and more from a data set in just a half hour.
Deep dive with google sheets
This document provides instructions for various functions in Google Sheets, including selecting and formatting cells, inserting and deleting rows and columns, adding multiple sheets, and performing basic calculations. It explains how to change cell sizes, select ranges, insert new columns or rows, add sheet tabs, rename and delete sheets, apply formatting like bolding and borders, and remove unwanted formatting. The document also distinguishes different data types like numbers, text, currency, and dates, and demonstrates how to do basic math calculations in sheets cells.
Uses & applications of microsoft excel in vph research
Microsoft Excel is a spreadsheet application that allows users to enter and organize data into columns and rows, perform calculations with formulas, and visualize data through graphs and charts. It consists of worksheets where data is entered into cells that are organized by columns and rows. Common functions include formatting cells, filtering and sorting data, and using formulas to analyze data through calculations and pivot tables to examine relationships between variables.
(Manual spss)
The document provides instructions for launching and using the statistical software SPSS. It discusses finding the SPSS icon on the computer and launching the program. Once SPSS is open, the user can start a new data file or open an existing one. Basic steps for using SPSS are outlined, including entering data, defining variables, testing for normality, statistical analysis, and interpreting results. Specific functions and menus in SPSS are demonstrated for descriptive statistics, normality testing, and t-tests.
How to use a spreadsheet
The document provides instructions on how to use Excel and MS Word. It explains how to set up a spreadsheet in Excel to organize data with rows and columns and enter formulas to calculate statistics like average and standard deviation. It then demonstrates formatting cells and changing number of decimals. For MS Word, it outlines starting a new document, opening existing ones, and how to save, including using save as to save to a different folder with a new name. It also indicates the various toolbars, menus, and rulers seen at the top of the programs.
SPSS PRESENTATION.PPT.pptx
sssssssssssssssssssssssssssssssssssssssssssssssssssssssssssssssssssssssssssssssssssssssssssssssssssssssssssssssssssssssssssssssssssssssssssssssssssssssssssssssssssssssssssssssssssssssssssssssssssssssssssssssssssssssssssssssssssssssssssssssssssssssssssssssssssssssssssssssssssssssssssssssssssssssssssssssssssssssssssssssssssssssssssssssssssssssssssssssssssssssssssssssssssssssssssssssssssssssssssssssssssssssssssssssssssssssssssssssssssssssssssssssssssssssssssssssssssssssssssssssssssssssssssssssssssssssssssssssssssssssssssssssssssssssssssssssssssssssssssssssssssssssssssssssssssssssssssssssssssssssssssssssssssssssssssssssssssssssssssssssssssssssssssssssssssssssssssssssssssssssssssssssssssssssssssssssssssssssssssssssssss
Using Excel to Do Data Journalism - Steve Doig - Seattle NewsTrain - 11.11.17
Using Excel to Do Data Journalism - Steve Doig - Seattle NewsTrain - 11.11.17News Leaders Association's NewsTrain
With screenshots, this handout walks the user through an introduction to Excel, including sorting, filtering, functions and pivot tables. It was prepared by Steve Doig, professor of journalism, specializing in data reporting, at the Walter Cronkite School of Journalism and Mass Communication at Arizona State University. He created it for Seattle NewsTrain on Nov. 11, 2017. It accompanies his presentation, Data-Driven Enterprise off Your Beat. NewsTrain is a training initiative of Associated Press Media Editors (APME). More info: http://bit.ly/NewsTrainSpss guidelines
The document provides an overview of a training on using SPSS. It is divided into three parts:
1) Introduction to SPSS, including background, objectives, and definitions.
2) Dealing with SPSS, covering getting started, key terms, creating a code book, and data entry.
3) Data management and analysis using SPSS, including exploratory, descriptive, and inferential analysis.
The training invites participants to properly learn how to use SPSS and makes time for questions.
8622380.ppt
This document provides instructions for performing a mail merge in Microsoft Word. It explains that mail merge allows combining a data set of recipients with a template letter. This removes the hassle of individually typing letters and allows inserting recipient details like names and addresses. The steps covered include selecting mail merge from the tools menu, choosing a starting document or template, selecting the recipient list from an existing file or database, inserting recipient fields into the template, previewing the merged letters, and printing the final merged documents.
Excel notes by satish kumar avunoori
This document provides an introduction and overview of key concepts in Microsoft Excel including worksheets, cells, formatting, formulas, functions, charts, and pivot tables. It explains how to create and manage worksheets, format cells, perform calculations with formulas and functions, create charts to visualize data, build pivot tables to summarize and filter data, and consolidate data across multiple worksheets. Examples and step-by-step instructions are provided for common Excel tasks like renaming sheets, merging cells, using arithmetic and logical operators in formulas, and linking worksheets to consolidate data.
DATA HANDLING FOR SPSS
Before conducting any statistical analysis one must have the data in tractable form for reliable and organized analysis. Whatever procedure used to do this is termed as “Data Handelling” and if we are working with SPSS then it is termed as “Data Mining”. Data mining is analysis step of knowledge Discovery in database or Data mining is an interdisciplinary subfield of computer engineering..Data Mining helps discovering of pattern in large datasets. The main moto of Data Mining is to extract information from a dataset and transform it into an knowledge that will helpful for further use. Beside from raw step analysis. In this paper Data Handling, is proposed for SPSS.
Tableau.pdf
The document provides an overview of the key components and terminology used in Tableau, including workbooks, sheets, dashboards, stories, containers, dimensions, measures, filters, parameters, groups, sets, hierarchies, actions, and shortcuts. It defines each component and provides examples. The summary also includes links to relevant tutorial videos to further explain concepts like building dashboards, using filters and parameters, creating groups and sets, and more.
Similar to How to Separate Data in an Excel Column.pptx (20)
Time Saving Data Entry Tips and Tricks - Data Entry India Outsource
Time Saving Data Entry Tips and Tricks - Data Entry India Outsource
Setting Line Spacing in Business MemosAt the top of a document.docx
Setting Line Spacing in Business MemosAt the top of a document.docx
Uses & applications of microsoft excel in vph research
Uses & applications of microsoft excel in vph research
Using Excel to Do Data Journalism - Steve Doig - Seattle NewsTrain - 11.11.17
Using Excel to Do Data Journalism - Steve Doig - Seattle NewsTrain - 11.11.17
Recently uploaded
GraphSummit Singapore | Graphing Success: Revolutionising Organisational Stru...
Sudheer Mechineni, Head of Application Frameworks, Standard Chartered Bank
Discover how Standard Chartered Bank harnessed the power of Neo4j to transform complex data access challenges into a dynamic, scalable graph database solution. This keynote will cover their journey from initial adoption to deploying a fully automated, enterprise-grade causal cluster, highlighting key strategies for modelling organisational changes and ensuring robust disaster recovery. Learn how these innovations have not only enhanced Standard Chartered Bank’s data infrastructure but also positioned them as pioneers in the banking sector’s adoption of graph technology.
Presentation of the OECD Artificial Intelligence Review of Germany
Consult the full report at https://www.oecd.org/digital/oecd-artificial-intelligence-review-of-germany-609808d6-en.htm
Let's Integrate MuleSoft RPA, COMPOSER, APM with AWS IDP along with Slack
Discover the seamless integration of RPA (Robotic Process Automation), COMPOSER, and APM with AWS IDP enhanced with Slack notifications. Explore how these technologies converge to streamline workflows, optimize performance, and ensure secure access, all while leveraging the power of AWS IDP and real-time communication via Slack notifications.
GraphSummit Singapore | The Art of the Possible with Graph - Q2 2024
Neha Bajwa, Vice President of Product Marketing, Neo4j
Join us as we explore breakthrough innovations enabled by interconnected data and AI. Discover firsthand how organizations use relationships in data to uncover contextual insights and solve our most pressing challenges – from optimizing supply chains, detecting fraud, and improving customer experiences to accelerating drug discoveries.
GraphSummit Singapore | Enhancing Changi Airport Group's Passenger Experience...
Dr. Sean Tan, Head of Data Science, Changi Airport Group
Discover how Changi Airport Group (CAG) leverages graph technologies and generative AI to revolutionize their search capabilities. This session delves into the unique search needs of CAG’s diverse passengers and customers, showcasing how graph data structures enhance the accuracy and relevance of AI-generated search results, mitigating the risk of “hallucinations” and improving the overall customer journey.
Introducing Milvus Lite: Easy-to-Install, Easy-to-Use vector database for you...
Join us to introduce Milvus Lite, a vector database that can run on notebooks and laptops, share the same API with Milvus, and integrate with every popular GenAI framework. This webinar is perfect for developers seeking easy-to-use, well-integrated vector databases for their GenAI apps.
Full-RAG: A modern architecture for hyper-personalization
Mike Del Balso, CEO & Co-Founder at Tecton, presents "Full RAG," a novel approach to AI recommendation systems, aiming to push beyond the limitations of traditional models through a deep integration of contextual insights and real-time data, leveraging the Retrieval-Augmented Generation architecture. This talk will outline Full RAG's potential to significantly enhance personalization, address engineering challenges such as data management and model training, and introduce data enrichment with reranking as a key solution. Attendees will gain crucial insights into the importance of hyperpersonalization in AI, the capabilities of Full RAG for advanced personalization, and strategies for managing complex data integrations for deploying cutting-edge AI solutions.
Climate Impact of Software Testing at Nordic Testing Days
My slides at Nordic Testing Days 6.6.2024
Climate impact / sustainability of software testing discussed on the talk. ICT and testing must carry their part of global responsibility to help with the climat warming. We can minimize the carbon footprint but we can also have a carbon handprint, a positive impact on the climate. Quality characteristics can be added with sustainability, and then measured continuously. Test environments can be used less, and in smaller scale and on demand. Test techniques can be used in optimizing or minimizing number of tests. Test automation can be used to speed up testing.
Uni Systems Copilot event_05062024_C.Vlachos.pdf
Unlocking Productivity: Leveraging the Potential of Copilot in Microsoft 365, a presentation by Christoforos Vlachos, Senior Solutions Manager – Modern Workplace, Uni Systems
“Building and Scaling AI Applications with the Nx AI Manager,” a Presentation...
“Building and Scaling AI Applications with the Nx AI Manager,” a Presentation...Edge AI and Vision Alliance
For the full video of this presentation, please visit: https://www.edge-ai-vision.com/2024/06/building-and-scaling-ai-applications-with-the-nx-ai-manager-a-presentation-from-network-optix/
Robin van Emden, Senior Director of Data Science at Network Optix, presents the “Building and Scaling AI Applications with the Nx AI Manager,” tutorial at the May 2024 Embedded Vision Summit.
In this presentation, van Emden covers the basics of scaling edge AI solutions using the Nx tool kit. He emphasizes the process of developing AI models and deploying them globally. He also showcases the conversion of AI models and the creation of effective edge AI pipelines, with a focus on pre-processing, model conversion, selecting the appropriate inference engine for the target hardware and post-processing.
van Emden shows how Nx can simplify the developer’s life and facilitate a rapid transition from concept to production-ready applications.He provides valuable insights into developing scalable and efficient edge AI solutions, with a strong focus on practical implementation.TrustArc Webinar - 2024 Global Privacy Survey
How does your privacy program stack up against your peers? What challenges are privacy teams tackling and prioritizing in 2024?
In the fifth annual Global Privacy Benchmarks Survey, we asked over 1,800 global privacy professionals and business executives to share their perspectives on the current state of privacy inside and outside of their organizations. This year’s report focused on emerging areas of importance for privacy and compliance professionals, including considerations and implications of Artificial Intelligence (AI) technologies, building brand trust, and different approaches for achieving higher privacy competence scores.
See how organizational priorities and strategic approaches to data security and privacy are evolving around the globe.
This webinar will review:
- The top 10 privacy insights from the fifth annual Global Privacy Benchmarks Survey
- The top challenges for privacy leaders, practitioners, and organizations in 2024
- Key themes to consider in developing and maintaining your privacy program
Video Streaming: Then, Now, and in the Future
In his public lecture, Christian Timmerer provides insights into the fascinating history of video streaming, starting from its humble beginnings before YouTube to the groundbreaking technologies that now dominate platforms like Netflix and ORF ON. Timmerer also presents provocative contributions of his own that have significantly influenced the industry. He concludes by looking at future challenges and invites the audience to join in a discussion.
A tale of scale & speed: How the US Navy is enabling software delivery from l...
Rapid and secure feature delivery is a goal across every application team and every branch of the DoD. The Navy’s DevSecOps platform, Party Barge, has achieved:
- Reduction in onboarding time from 5 weeks to 1 day
- Improved developer experience and productivity through actionable findings and reduction of false positives
- Maintenance of superior security standards and inherent policy enforcement with Authorization to Operate (ATO)
Development teams can ship efficiently and ensure applications are cyber ready for Navy Authorizing Officials (AOs). In this webinar, Sigma Defense and Anchore will give attendees a look behind the scenes and demo secure pipeline automation and security artifacts that speed up application ATO and time to production.
We will cover:
- How to remove silos in DevSecOps
- How to build efficient development pipeline roles and component templates
- How to deliver security artifacts that matter for ATO’s (SBOMs, vulnerability reports, and policy evidence)
- How to streamline operations with automated policy checks on container images
Artificial Intelligence for XMLDevelopment
In the rapidly evolving landscape of technologies, XML continues to play a vital role in structuring, storing, and transporting data across diverse systems. The recent advancements in artificial intelligence (AI) present new methodologies for enhancing XML development workflows, introducing efficiency, automation, and intelligent capabilities. This presentation will outline the scope and perspective of utilizing AI in XML development. The potential benefits and the possible pitfalls will be highlighted, providing a balanced view of the subject.
We will explore the capabilities of AI in understanding XML markup languages and autonomously creating structured XML content. Additionally, we will examine the capacity of AI to enrich plain text with appropriate XML markup. Practical examples and methodological guidelines will be provided to elucidate how AI can be effectively prompted to interpret and generate accurate XML markup.
Further emphasis will be placed on the role of AI in developing XSLT, or schemas such as XSD and Schematron. We will address the techniques and strategies adopted to create prompts for generating code, explaining code, or refactoring the code, and the results achieved.
The discussion will extend to how AI can be used to transform XML content. In particular, the focus will be on the use of AI XPath extension functions in XSLT, Schematron, Schematron Quick Fixes, or for XML content refactoring.
The presentation aims to deliver a comprehensive overview of AI usage in XML development, providing attendees with the necessary knowledge to make informed decisions. Whether you’re at the early stages of adopting AI or considering integrating it in advanced XML development, this presentation will cover all levels of expertise.
By highlighting the potential advantages and challenges of integrating AI with XML development tools and languages, the presentation seeks to inspire thoughtful conversation around the future of XML development. We’ll not only delve into the technical aspects of AI-powered XML development but also discuss practical implications and possible future directions.
みなさんこんにちはこれ何文字まで入るの?40文字以下不可とか本当に意味わからないけどこれ限界文字数書いてないからマジでやばい文字数いけるんじゃないの?えこ...
ここ3000字までしか入らないけどタイトルの方がたくさん文字入ると思います。
Essentials of Automations: The Art of Triggers and Actions in FME
In this second installment of our Essentials of Automations webinar series, we’ll explore the landscape of triggers and actions, guiding you through the nuances of authoring and adapting workspaces for seamless automations. Gain an understanding of the full spectrum of triggers and actions available in FME, empowering you to enhance your workspaces for efficient automation.
We’ll kick things off by showcasing the most commonly used event-based triggers, introducing you to various automation workflows like manual triggers, schedules, directory watchers, and more. Plus, see how these elements play out in real scenarios.
Whether you’re tweaking your current setup or building from the ground up, this session will arm you with the tools and insights needed to transform your FME usage into a powerhouse of productivity. Join us to discover effective strategies that simplify complex processes, enhancing your productivity and transforming your data management practices with FME. Let’s turn complexity into clarity and make your workspaces work wonders!
Microsoft - Power Platform_G.Aspiotis.pdf
Revolutionizing Application Development
with AI-powered low-code, presentation by George Aspiotis, Sr. Partner Development Manager, Microsoft
Goodbye Windows 11: Make Way for Nitrux Linux 3.5.0!
As the digital landscape continually evolves, operating systems play a critical role in shaping user experiences and productivity. The launch of Nitrux Linux 3.5.0 marks a significant milestone, offering a robust alternative to traditional systems such as Windows 11. This article delves into the essence of Nitrux Linux 3.5.0, exploring its unique features, advantages, and how it stands as a compelling choice for both casual users and tech enthusiasts.
Recently uploaded (20)
GraphSummit Singapore | Graphing Success: Revolutionising Organisational Stru...
GraphSummit Singapore | Graphing Success: Revolutionising Organisational Stru...
Presentation of the OECD Artificial Intelligence Review of Germany
Presentation of the OECD Artificial Intelligence Review of Germany
Let's Integrate MuleSoft RPA, COMPOSER, APM with AWS IDP along with Slack
Let's Integrate MuleSoft RPA, COMPOSER, APM with AWS IDP along with Slack
GraphSummit Singapore | The Art of the Possible with Graph - Q2 2024
GraphSummit Singapore | The Art of the Possible with Graph - Q2 2024
GraphSummit Singapore | Enhancing Changi Airport Group's Passenger Experience...
GraphSummit Singapore | Enhancing Changi Airport Group's Passenger Experience...
Introducing Milvus Lite: Easy-to-Install, Easy-to-Use vector database for you...
Introducing Milvus Lite: Easy-to-Install, Easy-to-Use vector database for you...
Full-RAG: A modern architecture for hyper-personalization
Full-RAG: A modern architecture for hyper-personalization
Climate Impact of Software Testing at Nordic Testing Days
Climate Impact of Software Testing at Nordic Testing Days
“Building and Scaling AI Applications with the Nx AI Manager,” a Presentation...
“Building and Scaling AI Applications with the Nx AI Manager,” a Presentation...
A tale of scale & speed: How the US Navy is enabling software delivery from l...
A tale of scale & speed: How the US Navy is enabling software delivery from l...
みなさんこんにちはこれ何文字まで入るの?40文字以下不可とか本当に意味わからないけどこれ限界文字数書いてないからマジでやばい文字数いけるんじゃないの?えこ...
みなさんこんにちはこれ何文字まで入るの?40文字以下不可とか本当に意味わからないけどこれ限界文字数書いてないからマジでやばい文字数いけるんじゃないの?えこ...
Essentials of Automations: The Art of Triggers and Actions in FME
Essentials of Automations: The Art of Triggers and Actions in FME
Goodbye Windows 11: Make Way for Nitrux Linux 3.5.0!
Goodbye Windows 11: Make Way for Nitrux Linux 3.5.0!
How to Separate Data in an Excel Column.pptx
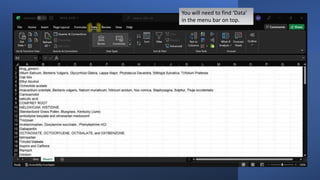
- 1. You will need to find ‘Data’ in the menu bar on top.
- 2. Once you are in the data bar you will go to your data and highlight the column the data you want to separate is in. You can do this by clicking the letter at the top.
- 3. Once you have highlighted your column, find ‘Text to Column’ in the bar and click it
- 4. A box will pop up. Make sure you choose file type ‘Delimited’ then click ‘Next’.
- 5. You need to choose which ‘delimiter’ your data will be split by. Choose the one that your data inside the cells is separated by; tab, semicolon, comma, space, or other. If other type which in space. Click ‘Next’.
- 7. Your data will now be separated into different columns. To see this, go to the triangle next to ‘A’ and click. This will highlight the whole spreadsheet and all the data.
- 8. Once your data is highlighted click the line between ‘A’ and ‘B’. This will make your columns as long as the longest data inside making the separation easily visible.
- 9. Your data is now separated.