Process-based crop simulation models in support of global economic modelingweatherplant above groundsoiland waterplant below groundRicky RobertsonEnvironment andProduction TechnologyDivisionInternationalFood PolicyResearch Instituteat CIAT: 18 May 2011
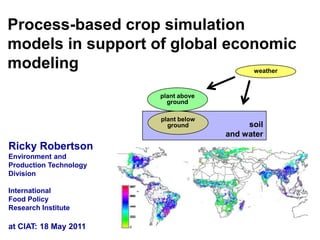
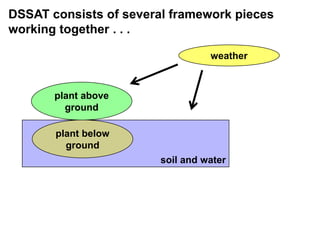
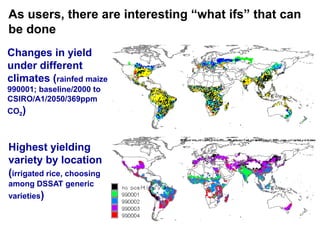
Processed based crop models try to mimic how plants respond to their environmentGrowth of roots/stems/leaves/fruitsWater use/stressNutrient extractionSunshineRain/IrrigationSoil propertiesThis presentation draws from experience with the DSSAT family of crop models from the user perspective
DSSAT consists of several framework pieces working together . . .weatherplant above groundsoil and waterplant below ground
. . . each of which require parameters and datareal or generatedvariety attributessoil characteristicsinitial conditionsplantingdate
The outputs can be thought of in two waysDynamic: each day’s growth, water usage, etc.Response: end results as determined by inputsHWAH = 4400.30NUCM =  264.95NLCM =  113.41ETCM =  773.63For economic modeling, “response” dominates, but sometimes “dynamic” is important (water management)
By running repeatedly, such models can be run globally when data are availableCSIRO/A2/2050maize990001HC27rainfed90 day spin up25% moisture content“April”All of the details must be specified for each location
As users, there are interesting “what ifs” that can be doneChanges in yield under different climates (rainfed maize 990001; baseline/2000 to CSIRO/A1/2050/369ppm CO2)Highest yielding variety by location(irrigated rice, choosing among DSSAT generic varieties)
The robustness or accuracy of results depend on the piecesweatherLocation specific dataEnvironment modelsPlant modelsplant above groundsoiland waterplant below groundAs a user, I can only look for obviously strange results
Data quality hinges on availability, geographic coverage, and consistencyweatherDownscaling of climate data to local scales (to include sunshine and rainfall distribution; microclimates)Soils probably provide the greatest opportunity for improvementplant above groundsoiland waterplant below ground
Users can make some observations to help model developersweatherGlobal scale modeling sometimes exposes strange behavior (e.g., root water extraction in rice)Calibration of varieties depends on quality and variability in experimental data (e.g., maize yield is highest around Ames, IA)plant above groundsoiland waterplant below ground
The yield projections are incorporated into the IMPACT economic model at a regional levelIMPACT runs on geographical units known as Food Production Units or FPUs
GCM/SRES scenario climate results are down scaled to 0.5 degree/5 minute resolution2000 June average minimum temperature2050  CSIRO/A2 June average rainfallMonthly averages are from Thornton and Jones’s FutureClim; daily weather is from DSSAT’s SIMMETEO
Planting months are chosen based on current and future climate conditions (a rule-based system)2000 Rainfed planting month2050 CSIRO/A2 Rainfed planting month
Soils are represented by 27 generic soil profiles based on the harmonized FAO soil datasetsSoil profiles color coded by locationSoil data must be matched to DSSAT-style soil profiles
The remaining inputs fall under management practicesChoice of crop varietyRainfed versus irrigated sources of waterPlanting densities, row spacing, and transplanting detailsFertilizer types, amounts, and application dates
DSSAT generates projected yields for each location2000 Rainfed maize yield2050 CSIRO/A2 Rainfed maize yield
Parallelization of the DSSAT runs results in major time savingsserialparallelizedroughly 1½ weeks on 80 processors(5 crops,rainfed/irrigated,13 climates,15 arc-minute resolution)would takeroughly 96 weeks on a single processor
SPAM 2000 areas are used to weight the projected yields when aggregating to FPUsRainfed maize physical area in 2000The Spatial Production Allocation Model data are available from http://mapspam.info/
Vector FPU boundaries are placed over top of the raster yield projections2000 Rainfed maize yield with FPU boundariesin South Asia
Projected yields from DSSAT are aggregated up to the FPU-level for use in IMPACTBy crop and rainfed/irrigated...Find total SPAM area within FPUFind total production (SPAM area × DSSAT yield) within FPUCompute area-weighted-average yield as total production / total area

Ciat crop modeling_18may11

  • 1.
    Process-based crop simulationmodels in support of global economic modelingweatherplant above groundsoiland waterplant below groundRicky RobertsonEnvironment andProduction TechnologyDivisionInternationalFood PolicyResearch Instituteat CIAT: 18 May 2011
  • 2.
    Processed based cropmodels try to mimic how plants respond to their environmentGrowth of roots/stems/leaves/fruitsWater use/stressNutrient extractionSunshineRain/IrrigationSoil propertiesThis presentation draws from experience with the DSSAT family of crop models from the user perspective
  • 3.
    DSSAT consists ofseveral framework pieces working together . . .weatherplant above groundsoil and waterplant below ground
  • 4.
    . . .each of which require parameters and datareal or generatedvariety attributessoil characteristicsinitial conditionsplantingdate
  • 5.
    The outputs canbe thought of in two waysDynamic: each day’s growth, water usage, etc.Response: end results as determined by inputsHWAH = 4400.30NUCM = 264.95NLCM = 113.41ETCM = 773.63For economic modeling, “response” dominates, but sometimes “dynamic” is important (water management)
  • 6.
    By running repeatedly,such models can be run globally when data are availableCSIRO/A2/2050maize990001HC27rainfed90 day spin up25% moisture content“April”All of the details must be specified for each location
  • 7.
    By running repeatedly,such models can be run globally when data are availableCSIRO/A2/2050maize990001HC27rainfed90 day spin up25% moisture content“April”All of the details must be specified for each location
  • 8.
    As users, thereare interesting “what ifs” that can be doneChanges in yield under different climates (rainfed maize 990001; baseline/2000 to CSIRO/A1/2050/369ppm CO2)Highest yielding variety by location(irrigated rice, choosing among DSSAT generic varieties)
  • 9.
    The robustness oraccuracy of results depend on the piecesweatherLocation specific dataEnvironment modelsPlant modelsplant above groundsoiland waterplant below groundAs a user, I can only look for obviously strange results
  • 10.
    Data quality hingeson availability, geographic coverage, and consistencyweatherDownscaling of climate data to local scales (to include sunshine and rainfall distribution; microclimates)Soils probably provide the greatest opportunity for improvementplant above groundsoiland waterplant below ground
  • 11.
    Users can makesome observations to help model developersweatherGlobal scale modeling sometimes exposes strange behavior (e.g., root water extraction in rice)Calibration of varieties depends on quality and variability in experimental data (e.g., maize yield is highest around Ames, IA)plant above groundsoiland waterplant below ground
  • 12.
    The yield projectionsare incorporated into the IMPACT economic model at a regional levelIMPACT runs on geographical units known as Food Production Units or FPUs
  • 13.
    GCM/SRES scenario climateresults are down scaled to 0.5 degree/5 minute resolution2000 June average minimum temperature2050 CSIRO/A2 June average rainfallMonthly averages are from Thornton and Jones’s FutureClim; daily weather is from DSSAT’s SIMMETEO
  • 14.
    Planting months arechosen based on current and future climate conditions (a rule-based system)2000 Rainfed planting month2050 CSIRO/A2 Rainfed planting month
  • 15.
    Soils are representedby 27 generic soil profiles based on the harmonized FAO soil datasetsSoil profiles color coded by locationSoil data must be matched to DSSAT-style soil profiles
  • 16.
    The remaining inputsfall under management practicesChoice of crop varietyRainfed versus irrigated sources of waterPlanting densities, row spacing, and transplanting detailsFertilizer types, amounts, and application dates
  • 17.
    DSSAT generates projectedyields for each location2000 Rainfed maize yield2050 CSIRO/A2 Rainfed maize yield
  • 18.
    Parallelization of theDSSAT runs results in major time savingsserialparallelizedroughly 1½ weeks on 80 processors(5 crops,rainfed/irrigated,13 climates,15 arc-minute resolution)would takeroughly 96 weeks on a single processor
  • 19.
    SPAM 2000 areasare used to weight the projected yields when aggregating to FPUsRainfed maize physical area in 2000The Spatial Production Allocation Model data are available from http://mapspam.info/
  • 20.
    Vector FPU boundariesare placed over top of the raster yield projections2000 Rainfed maize yield with FPU boundariesin South Asia
  • 21.
    Projected yields fromDSSAT are aggregated up to the FPU-level for use in IMPACTBy crop and rainfed/irrigated...Find total SPAM area within FPUFind total production (SPAM area × DSSAT yield) within FPUCompute area-weighted-average yield as total production / total area

Editor's Notes

  • #3 Nutrient composition of plant parts.
  • #4 Nutrient composition of plant parts.
  • #5 Nutrient composition of plant parts.
  • #6 Nutrient composition of plant parts.
  • #7 Nutrient composition of plant parts.
  • #8 Nutrient composition of plant parts.
  • #9 Nutrient composition of plant parts.
  • #10 Nutrient composition of plant parts.
  • #11 Nutrient composition of plant parts.
  • #12 Nutrient composition of plant parts.
  • #14 Nutrient composition of plant parts.
  • #15 Nutrient composition of plant parts.
  • #16 Nutrient composition of plant parts.
  • #17 Nutrient composition of plant parts.
  • #18 Nutrient composition of plant parts.
  • #19 Nutrient composition of plant parts.
  • #20 Nutrient composition of plant parts.
  • #21 Nutrient composition of plant parts.
  • #22 Nutrient composition of plant parts.