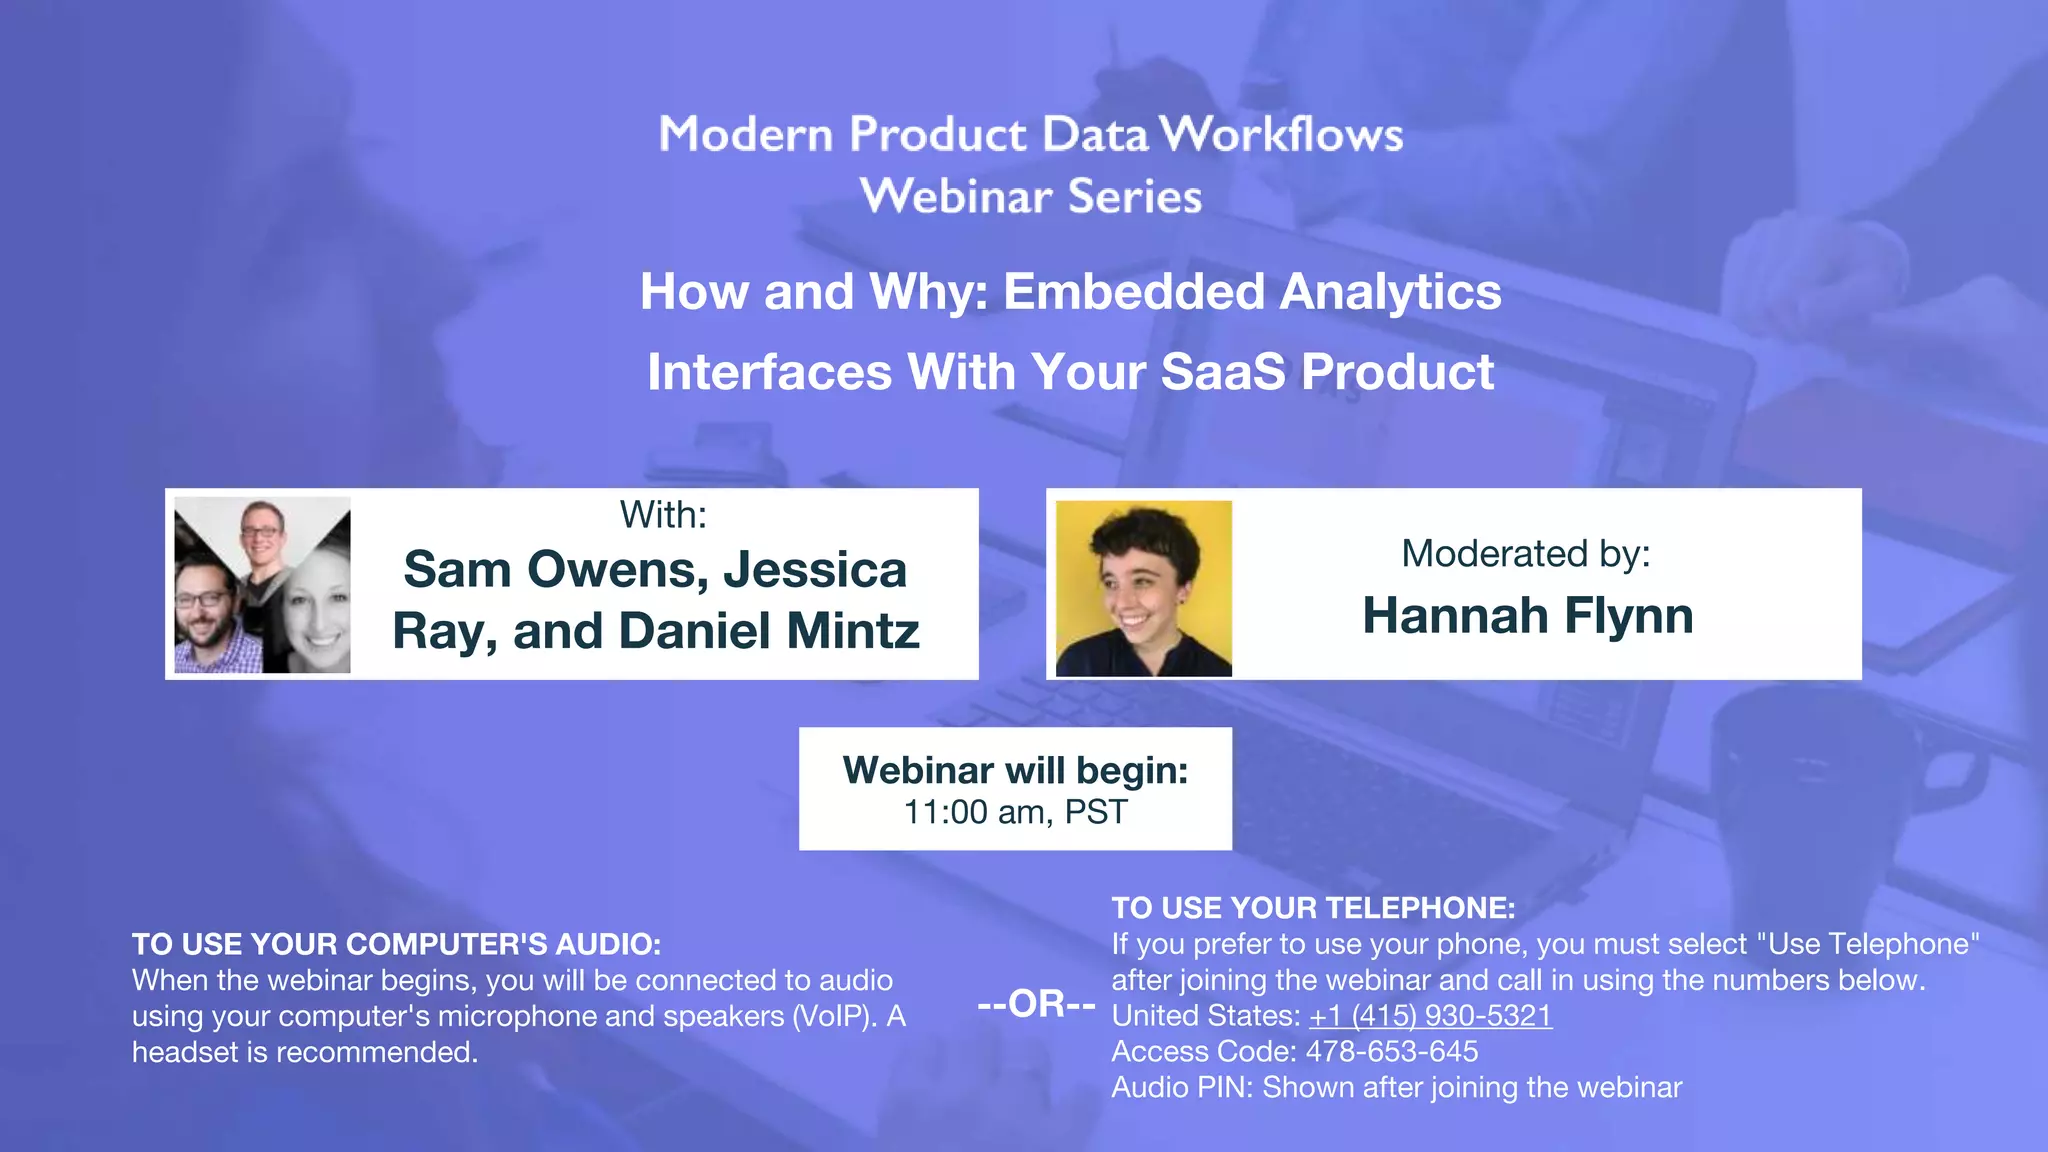
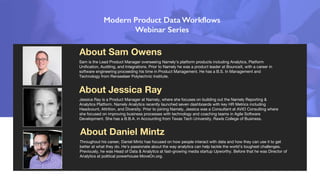
How and Why: Embedded Analytics
Interfaces With Your SaaS Product
Sam Owens, Jessica
Ray, and Daniel Mintz Hannah Flynn
With:
Moderated by:
TO USE YOUR COMPUTER'S AUDIO:
When the webinar begins, you will be connected to audio
using your computer's microphone and speakers (VoIP). A
headset is recommended.
Webinar will begin:
11:00 am, PST
TO USE YOUR TELEPHONE:
If you prefer to use your phone, you must select "Use Telephone"
after joining the webinar and call in using the numbers below.
United States: +1 (415) 930-5321
Access Code: 478-653-645
Audio PIN: Shown after joining the webinar
--OR--
Looker is a complete data platform that offers data analytics and business
insights to every department, and easily integrates into applications to
deliver data directly into the decision-making process. Looker is powering
data-driven cultures at more than 1400 industry-leading and innovative
companies.
Click on the Questions panel to
interact with the presenters
www.productmanagementtoday.com/webinar-series/modern-product-data-workflows
www.projectmanagementupdate.com/webinar-series/modern-product-data-workflows
www.businessinnovationbrief.com/webinar-series/modern-product-data-workflows
About Jessica Ray
Sam is the Lead Product Manager overseeing Namely’s platform products including Analytics, Platform
Unification, Auditing, and Integrations. Prior to Namely he was a product leader at BounceX, with a career in
software engineering proceeding his time in Product Management. He has a B.S. In Management and
Technology from Rensselaer Polytechnic Institute.
About Daniel Mintz
Throughout his career, Daniel Mintz has focused on how people interact with data and how they can use it to get
better at what they do. He’s passionate about the way analytics can help tackle the world’s toughest challenges.
Previously, he was Head of Data & Analytics at fast-growing media startup Upworthy. Before that he was Director of
Analytics at political powerhouse MoveOn.org.
About Sam Owens
Jessica Ray is a Product Manager at Namely, where she focuses on building out the Namely Reporting &
Analytics Platform. Namely Analytics recently launched seven dashboards with key HR Metrics including
Headcount, Attrition, and Diversity. Prior to joining Namely, Jessica was a Consultant at AVIO Consulting where
she focused on improving business processes with technology and coaching teams in Agile Software
Development. She has a B.B.A. in Accounting from Texas Tech University, Rawls College of Business.
Organizations invest strategically to compete 1
Invest engineering talent on core competency
Buy, outsource, M&A … for everything else
1 https://www.gartner.com/imagesrv/cio-trends/pdf/cio_agenda_2018.pdf
Growth is the top priority for investment 1
“New sources of revenue”
“Product and service transformation”
“Customer focus”
1 https://www.gartner.com/imagesrv/cio-trends/pdf/cio_agenda_2018.pdf
POLL 1
How far along is your organization with embedding analytics?
A) Haven’t started
B) Interested, but haven’t built anything yet
C) In the planning phase
D) Building, but haven’t launched
E) Have analytics embedded for customers already
New streams of value, faster
Higher customer engagement
Significant, rapid ROI
Outcomes: Leveraging data to fuel growth
How and Why: Embedded
Analytics Interfaces with your
Saas Products
With Sam Owens & Jessica Ray
8/21/2018
Quick Stats about Namely
Namely Platform
MODERN HR
A flexible employee database
used by everyone, every day.
FULL-SERVICE PAYROLL
Namely handles your payroll taxes,
W-2s, 1099s, and ACA reports.
TIME & ATTENDANCE
Manage hourly workers and pull
hours seamlessly into payroll.
BENEFITS ADMINISTRATION
Simplify enrollment, and automatically
send elections to carriers.
TALENT MANAGEMENT
Paperless onboarding, goals, performance reviews, and more.
Namely Mission
Help mid-sized companies
build a better workplace.
Product Strategy
From Organically Grown to
Deliberately Sophisticated
What Do Our Customers Want?
● HRIS Reporting (Headcount, Turnover)
● Payroll Reporting (Salary, Salary Changes)
● Point-In-Time (Headcount, Salary)
● Change Reports (Manager)
● Auditing (Roles & Permissions, Banking Info)
Where Did We Start?
● HRIS custom reporting Tool
● Some small dashboards delivered in company settings
● Separate payroll & benefits reporting tool
What Did We Identify as Important to Change?
● Centralized reporting and analytics landing page
● Unified custom reporting across products
● Audit logs
● High value dashboards with point-in-time capabilities
Prioritizing Needs
● Landing Page - Needed More New Functionality
● Unified Custom Reporting - Data is still accessible
● Audit Logs - Not nearly as many requests as other functionality
● Dashboards - Functionality entirely unmet, infrastructure needed
for other needs as well.
What Did We Need To Build To Make This Happen?
● Data Infrastructure
● Permissions
● Dashboard Functionality & Design
● Additional Details
How Do We Deliver This?
Time
Scope
Cost
So How Did Looker Help?
Diving into the
Details
Of Client Feedback
“Reporting is very frustrating. I've never worked with a
system that did not have an ad hoc reporting tool that pulled
from all data sources.”
“Reporting isn't visually appealing.”
“More reporting abilities”
“Your reporting is really bad. it is difficult to get the
data I am looking for with time periods and such. it's
very confusing…”
“Improving functionality with reporting”
March 2017 Client Experience Survey,
before Namely Analytics Launch
“Reporting & analytics, I would like to see more graphic
report options. I also think determining the date range for
the data set needs to be simpler. Try pulling an annual
headcount history, thinking about the date filters in terms Of
* = * is not as easy as saying show me everything within
1/1/16 to 12/31/16 date range. ”
Data Visualization
Better Filtering
Yearly Headcount report, with a date range
Quote from a HR Manager
March 2017 Client Experience Survey,
before Namely Analytics Launch
How did we analyze product feedback?
Used Excel
Tagged Feedback into topics
Tip: Sort Alphabetically so that Extremely
Dissatisfied if followed by Extremely
Satisfied
Namely Analytics
Namely Analytics: Tip of the Data Iceberg
Namely
Analytics
Initial data loads for all new
tables
Build new data pipelines into
the Data Warehouse
Collect historical information
from multiple sources
Migrate existing data pipelines
to Apache Airflow
Data Warehouse schema
architecture and design
Build the dashboard and
integrate in web application
Monitor and notify on failures
or performance degradation
Design, implement,
test, repeat
Initial Launch: January 2018
Headcount Attrition (Turnover)
Birthday/
Anniversary
Job Changes
Initial Launch Client Feedback
How did we gather client feedback?
Added an additional ‘pop-up’ pulse survey on each dashboard, and set up client feedback calls with our beta clients
We realized something critical…
Our clients were asking for Point-in-Time reporting, but they actually wanted Effective-Date reporting.
We had defined Point-in-Time as how the data was in the system on a given day.
Our clients sometimes don’t enter data exactly on the day that it happens.
For example, a manager may give an employee a promotion on July 4, effective July 1. The HR Admin may not enter this
promotion into our system until July 5.
In Namely Analytics, they expected for this change to be reflected as of July 1, but we weren’t showing it until July 5.
We adapted and made the next dashboards based on effective dates, and are now in the process of
switching the original dashboards to the new date logic.
Additional Dashboards Launched in Q2
Salary Salary Changes
Launched Diversity Dashboard in Q3
Diversity / Expanding on Diversity
Tracking Metrics
Shoutout to Allison Boucher, Namely Product Manager
for starting the metrics workbook
Objective: Create a Data Centric Product
Goal: 80% Monthly Adoption rate of Namely Analytics
6 out of 7 Client Satisfaction
Understanding Our Users
Cohort Analysis, based on size of Employees
Small
Medium
Large
Take Away: Clients have different reporting/analytics needs depending on their size
Once a user starts using the product, do they use it again the next month?
How about the month after that?
What about 6 months later?
Here is what we did:
- # of clients by size,
- First month that client used Analytics = their cohort
- What percentage of each cohort returned the next month?
- What is the average across cohorts?
Understanding Our Users
Trends in user feedback
Not complicated enough!
“Would like more customization for output display (attrition % by year and quarter, a
date range option) and term reason filter/sum tool”
“Definitely going in the right direction, my CEO loves it. Needs some refining and
even more areas to get data from, but it's great! More?”
“Great start. Wish it was a bit more customizable!”
Too complicated!
“Great, but slightly confusing. Would have been great to have gotten a
tutorial on how to generate the needed data. Time consuming without.”
“Do you need a MBA to use this system?”
Need to find balance between these two types of users
Some of our challenges:
● Permissions
○ Our application has field level permissions, so clients can configure some users to have
access to Gender, not Ethnicity. How we could build a diversity dashboard with that level of
granularity in the permissions scheme?
■ Solution: Created a simplified permissions scheme for each dashboard. A user would
be able to see all of the data on the dashboard even if they don’t have that field-level
permission
■ Future Consideration: Anonymizing Data - if there are only 5 people in a department,
should we still populate a diversity dashboard for that department?
● Design
○ Our design team wasn’t 100% on board with using an embedded solution
■ Focused on setting standards for data visualisations that aren’t tool specific. For
example:
● All graphs shown as a time-series should be a line graph
○ Lines should be X thickness with
● All graphs showing a % of a total should be a pie chart
○ unless they are showing two dimensions of data, then they should be a bar chart
What’s Next?
New Landing Page
Dashboard of Dashboards
Additional subject area reports:
- Time Off
- Performance
- Job Tier/Org Chart
Getting feedback to integrate
into the existing dashboards
MOCKUP
MOCKUP
MOCKUP
MOCKUP
MOCKUP
Database
Pretty Charts
Embedding Analytics
Database
Pretty Charts
PLANNED TO BUILD
Access Control
and more…
Security
Administration
Agile Business Logic
Scheduling
Content Management
Ad hoc Reporting
Data Delivery
REALIZE IS NEEDED
Options for Embedded Analytics
Build
Cons
Slow to value
Distracting
Requires maintenance
Pros
Customizable
Modern workflow
Data stays in DB
Options for Embedded Analytics
Buy
Cons
Inflexible
Doesn’t scale
Data gets copied
Complex ETLs
Pros
Quick to Value
Less distracting
Complete
Build
Cons
Slow to value
Distracting
Requires maintenance
Pros
Customizable
Modern workflow
Data stays in DB
Best of Both
Worlds
Predictable cost
Fast to deploy
Easy to maintain
Modular and feature-complete
No data movement
Built to scale
Modern workflow
Q&A
Hannah Flynn
Moderated by:
Namely and Looker
Linkedin page: /company/Namely/
/company/looker/
Website: namely.com
looker.com
Email: discover@looker.com
Site Editor, Product Management Today
Linkedin page: in/hannahmichaelflynn
Twitter ID: @prodmgmttoday
Website: productmanagementtoday.com
www.productmanagementtoday.com/webinar-series/modern-product-data-workflows
www.projectmanagementupdate.com/webinar-series/modern-product-data-workflows
www.businessinnovationbrief.com/webinar-series/modern-product-data-workflows
Sam Owens, Jessica
Ray, and Daniel Mintz
With:

How and Why: Embedded Analytics Interfaces For Your SaaS Product

  • 1.
    How and Why:Embedded Analytics Interfaces With Your SaaS Product Sam Owens, Jessica Ray, and Daniel Mintz Hannah Flynn With: Moderated by: TO USE YOUR COMPUTER'S AUDIO: When the webinar begins, you will be connected to audio using your computer's microphone and speakers (VoIP). A headset is recommended. Webinar will begin: 11:00 am, PST TO USE YOUR TELEPHONE: If you prefer to use your phone, you must select "Use Telephone" after joining the webinar and call in using the numbers below. United States: +1 (415) 930-5321 Access Code: 478-653-645 Audio PIN: Shown after joining the webinar --OR--
  • 2.
    Looker is acomplete data platform that offers data analytics and business insights to every department, and easily integrates into applications to deliver data directly into the decision-making process. Looker is powering data-driven cultures at more than 1400 industry-leading and innovative companies.
  • 3.
    Click on theQuestions panel to interact with the presenters www.productmanagementtoday.com/webinar-series/modern-product-data-workflows www.projectmanagementupdate.com/webinar-series/modern-product-data-workflows www.businessinnovationbrief.com/webinar-series/modern-product-data-workflows
  • 4.
    About Jessica Ray Samis the Lead Product Manager overseeing Namely’s platform products including Analytics, Platform Unification, Auditing, and Integrations. Prior to Namely he was a product leader at BounceX, with a career in software engineering proceeding his time in Product Management. He has a B.S. In Management and Technology from Rensselaer Polytechnic Institute. About Daniel Mintz Throughout his career, Daniel Mintz has focused on how people interact with data and how they can use it to get better at what they do. He’s passionate about the way analytics can help tackle the world’s toughest challenges. Previously, he was Head of Data & Analytics at fast-growing media startup Upworthy. Before that he was Director of Analytics at political powerhouse MoveOn.org. About Sam Owens Jessica Ray is a Product Manager at Namely, where she focuses on building out the Namely Reporting & Analytics Platform. Namely Analytics recently launched seven dashboards with key HR Metrics including Headcount, Attrition, and Diversity. Prior to joining Namely, Jessica was a Consultant at AVIO Consulting where she focused on improving business processes with technology and coaching teams in Agile Software Development. She has a B.B.A. in Accounting from Texas Tech University, Rawls College of Business.
  • 5.
    Organizations invest strategicallyto compete 1 Invest engineering talent on core competency Buy, outsource, M&A … for everything else 1 https://www.gartner.com/imagesrv/cio-trends/pdf/cio_agenda_2018.pdf
  • 6.
    Growth is thetop priority for investment 1 “New sources of revenue” “Product and service transformation” “Customer focus” 1 https://www.gartner.com/imagesrv/cio-trends/pdf/cio_agenda_2018.pdf
  • 7.
    POLL 1 How faralong is your organization with embedding analytics? A) Haven’t started B) Interested, but haven’t built anything yet C) In the planning phase D) Building, but haven’t launched E) Have analytics embedded for customers already
  • 8.
    New streams ofvalue, faster Higher customer engagement Significant, rapid ROI Outcomes: Leveraging data to fuel growth
  • 9.
    How and Why:Embedded Analytics Interfaces with your Saas Products With Sam Owens & Jessica Ray 8/21/2018
  • 10.
  • 11.
    Namely Platform MODERN HR Aflexible employee database used by everyone, every day. FULL-SERVICE PAYROLL Namely handles your payroll taxes, W-2s, 1099s, and ACA reports. TIME & ATTENDANCE Manage hourly workers and pull hours seamlessly into payroll. BENEFITS ADMINISTRATION Simplify enrollment, and automatically send elections to carriers. TALENT MANAGEMENT Paperless onboarding, goals, performance reviews, and more.
  • 12.
    Namely Mission Help mid-sizedcompanies build a better workplace.
  • 13.
    Product Strategy From OrganicallyGrown to Deliberately Sophisticated
  • 14.
    What Do OurCustomers Want? ● HRIS Reporting (Headcount, Turnover) ● Payroll Reporting (Salary, Salary Changes) ● Point-In-Time (Headcount, Salary) ● Change Reports (Manager) ● Auditing (Roles & Permissions, Banking Info)
  • 15.
    Where Did WeStart? ● HRIS custom reporting Tool ● Some small dashboards delivered in company settings ● Separate payroll & benefits reporting tool
  • 16.
    What Did WeIdentify as Important to Change? ● Centralized reporting and analytics landing page ● Unified custom reporting across products ● Audit logs ● High value dashboards with point-in-time capabilities
  • 17.
    Prioritizing Needs ● LandingPage - Needed More New Functionality ● Unified Custom Reporting - Data is still accessible ● Audit Logs - Not nearly as many requests as other functionality ● Dashboards - Functionality entirely unmet, infrastructure needed for other needs as well.
  • 18.
    What Did WeNeed To Build To Make This Happen? ● Data Infrastructure ● Permissions ● Dashboard Functionality & Design ● Additional Details
  • 19.
    How Do WeDeliver This? Time Scope Cost
  • 20.
    So How DidLooker Help?
  • 21.
  • 22.
    “Reporting is veryfrustrating. I've never worked with a system that did not have an ad hoc reporting tool that pulled from all data sources.” “Reporting isn't visually appealing.” “More reporting abilities” “Your reporting is really bad. it is difficult to get the data I am looking for with time periods and such. it's very confusing…” “Improving functionality with reporting” March 2017 Client Experience Survey, before Namely Analytics Launch
  • 23.
    “Reporting & analytics,I would like to see more graphic report options. I also think determining the date range for the data set needs to be simpler. Try pulling an annual headcount history, thinking about the date filters in terms Of * = * is not as easy as saying show me everything within 1/1/16 to 12/31/16 date range. ” Data Visualization Better Filtering Yearly Headcount report, with a date range Quote from a HR Manager March 2017 Client Experience Survey, before Namely Analytics Launch
  • 24.
    How did weanalyze product feedback? Used Excel Tagged Feedback into topics Tip: Sort Alphabetically so that Extremely Dissatisfied if followed by Extremely Satisfied
  • 25.
  • 26.
    Namely Analytics: Tipof the Data Iceberg Namely Analytics Initial data loads for all new tables Build new data pipelines into the Data Warehouse Collect historical information from multiple sources Migrate existing data pipelines to Apache Airflow Data Warehouse schema architecture and design Build the dashboard and integrate in web application Monitor and notify on failures or performance degradation Design, implement, test, repeat
  • 27.
    Initial Launch: January2018 Headcount Attrition (Turnover) Birthday/ Anniversary Job Changes
  • 28.
    Initial Launch ClientFeedback How did we gather client feedback? Added an additional ‘pop-up’ pulse survey on each dashboard, and set up client feedback calls with our beta clients We realized something critical… Our clients were asking for Point-in-Time reporting, but they actually wanted Effective-Date reporting. We had defined Point-in-Time as how the data was in the system on a given day. Our clients sometimes don’t enter data exactly on the day that it happens. For example, a manager may give an employee a promotion on July 4, effective July 1. The HR Admin may not enter this promotion into our system until July 5. In Namely Analytics, they expected for this change to be reflected as of July 1, but we weren’t showing it until July 5. We adapted and made the next dashboards based on effective dates, and are now in the process of switching the original dashboards to the new date logic.
  • 29.
    Additional Dashboards Launchedin Q2 Salary Salary Changes
  • 30.
    Launched Diversity Dashboardin Q3 Diversity / Expanding on Diversity
  • 31.
    Tracking Metrics Shoutout toAllison Boucher, Namely Product Manager for starting the metrics workbook Objective: Create a Data Centric Product Goal: 80% Monthly Adoption rate of Namely Analytics 6 out of 7 Client Satisfaction
  • 32.
    Understanding Our Users CohortAnalysis, based on size of Employees Small Medium Large Take Away: Clients have different reporting/analytics needs depending on their size Once a user starts using the product, do they use it again the next month? How about the month after that? What about 6 months later? Here is what we did: - # of clients by size, - First month that client used Analytics = their cohort - What percentage of each cohort returned the next month? - What is the average across cohorts?
  • 33.
    Understanding Our Users Trendsin user feedback Not complicated enough! “Would like more customization for output display (attrition % by year and quarter, a date range option) and term reason filter/sum tool” “Definitely going in the right direction, my CEO loves it. Needs some refining and even more areas to get data from, but it's great! More?” “Great start. Wish it was a bit more customizable!” Too complicated! “Great, but slightly confusing. Would have been great to have gotten a tutorial on how to generate the needed data. Time consuming without.” “Do you need a MBA to use this system?” Need to find balance between these two types of users
  • 34.
    Some of ourchallenges: ● Permissions ○ Our application has field level permissions, so clients can configure some users to have access to Gender, not Ethnicity. How we could build a diversity dashboard with that level of granularity in the permissions scheme? ■ Solution: Created a simplified permissions scheme for each dashboard. A user would be able to see all of the data on the dashboard even if they don’t have that field-level permission ■ Future Consideration: Anonymizing Data - if there are only 5 people in a department, should we still populate a diversity dashboard for that department? ● Design ○ Our design team wasn’t 100% on board with using an embedded solution ■ Focused on setting standards for data visualisations that aren’t tool specific. For example: ● All graphs shown as a time-series should be a line graph ○ Lines should be X thickness with ● All graphs showing a % of a total should be a pie chart ○ unless they are showing two dimensions of data, then they should be a bar chart
  • 35.
    What’s Next? New LandingPage Dashboard of Dashboards Additional subject area reports: - Time Off - Performance - Job Tier/Org Chart Getting feedback to integrate into the existing dashboards MOCKUP MOCKUP MOCKUP MOCKUP MOCKUP
  • 36.
  • 37.
    Database Pretty Charts PLANNED TOBUILD Access Control and more… Security Administration Agile Business Logic Scheduling Content Management Ad hoc Reporting Data Delivery REALIZE IS NEEDED
  • 38.
    Options for EmbeddedAnalytics Build Cons Slow to value Distracting Requires maintenance Pros Customizable Modern workflow Data stays in DB
  • 39.
    Options for EmbeddedAnalytics Buy Cons Inflexible Doesn’t scale Data gets copied Complex ETLs Pros Quick to Value Less distracting Complete Build Cons Slow to value Distracting Requires maintenance Pros Customizable Modern workflow Data stays in DB Best of Both Worlds Predictable cost Fast to deploy Easy to maintain Modular and feature-complete No data movement Built to scale Modern workflow
  • 40.
    Q&A Hannah Flynn Moderated by: Namelyand Looker Linkedin page: /company/Namely/ /company/looker/ Website: namely.com looker.com Email: discover@looker.com Site Editor, Product Management Today Linkedin page: in/hannahmichaelflynn Twitter ID: @prodmgmttoday Website: productmanagementtoday.com www.productmanagementtoday.com/webinar-series/modern-product-data-workflows www.projectmanagementupdate.com/webinar-series/modern-product-data-workflows www.businessinnovationbrief.com/webinar-series/modern-product-data-workflows Sam Owens, Jessica Ray, and Daniel Mintz With: