Download to read offline


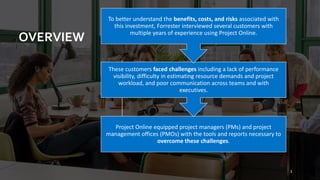


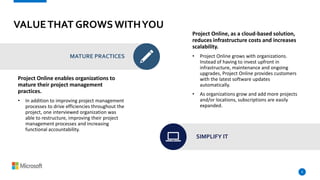
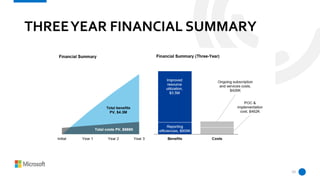


The document outlines the benefits of Project Online as a project and portfolio management (PPM) solution that quantifies improvements in reporting efficiency, resource utilization, and cost management. Forrester's Total Economic Impact report highlights tangible advantages such as a significant reduction in overtime costs, improved on-time delivery rates, and overall enhanced customer satisfaction. The cloud-based platform allows for scalability and reduces infrastructure costs, ultimately enabling organizations to grow their project management practices efficiently.


