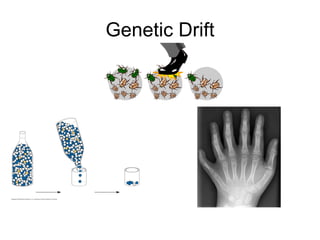
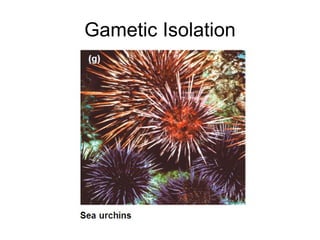
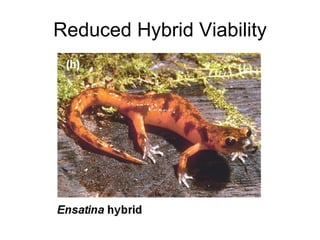
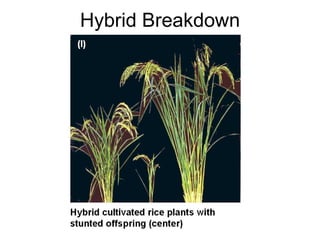
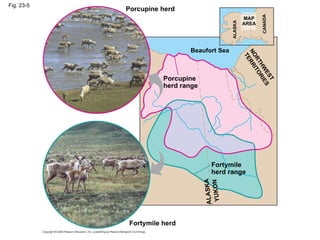
Evolution


Fig. 22-7
 
Descent with modifications


Organisms evolve in order to better suit an environment.  Evolution involves mutations in the genetic information of organisms that lead to changes in the appearance or phenotype of organisms.  Factors from the environment that influence survival, such as availability of food, water and shelter, generate random mutations in organisms.  Many mutations are neutral; they have no effect on the organism’s phenotype.  Some mutations are detrimental and make the organism less likely to survive.  If an organism develops a detrimental mutation, it will not have offspring and so the detrimental mutation will not be passed down.  If an organism has a beneficial mutation, its offspring will have that beneficial mutation and will be better able to survive and reproduce.  This process of random mutation and selection from the environment insures that organisms advance to more and more complex levels of biological structure.
 
Fig. 22-18 Human embryo Chick embryo (LM) Pharyngeal pouches Post-anal tail
 
Fig. 22-19 Hawks and other birds Ostriches Crocodiles Lizards and snakes Amphibians Mammals Lungfishes Tetrapod limbs Amnion Feathers Homologous characteristic Branch point (common ancestor) Tetrapods Amniotes Birds 6 5 4 3 2 1
Convergent Evolution
 
Human Evolution
 
mtDNA Control Region
 
Two Opposing Theories Multiregional Theory Parallel evolution Displacement Theory Out of Africa theory http://news.bbc.co.uk/


Molecular Clock
 
 
Published by AAAS A.  Gibbons  Science  328, 680-684 (2010)
Neandertal Genome Study Reveals That We Have a Little Caveman in Us  Svante Paabo  Europeans and Asians share 1% to 4% of their nuclear DNA with Neandertals. But Africans do not
Published by AAAS A.  Gibbons  Science  328, 680-684 (2010)
 
100 Years 1 bp/sec 17 Minutes


Human mtDNA Haplotypes
 
 
Two Factors Effecting Haplotypes Evolution. Genetic Drift.
Genetic Drift
 
My mtDNA Haplotype
 
Genetic Drift
SNP For each individual they analysed half a million SNPs, and then amalgamated the results mathematically to produce two numbers representing that person. This allowed each individual's genome to be shown as a point on a two-dimensional plot: the bigger the differences in the genomes, the greater the distance between them on the plot.
Reproductive Isolation
Habitat Isolation
Temporal Isolation
Behavioral Isolation
Mechanical Isolation
Gametic Isolation
Reduced Hybrid Viability
Reduced Hybrid Fertility + =
Hybrid Breakdown
Fig. 24-4 Prezygotic barriers Habitat Isolation Individuals of  different species Temporal Isolation Behavioral Isolation Mating attempt Mechanical Isolation Gametic Isolation Fertilization Reduced Hybrid Viability Reduced Hybrid Fertility Postzygotic barriers Hybrid Breakdown Viable, fertile offspring (a) (b) (d) (c) (e) (f) (g) (h) (i) (j) (l) (k)
Fig. 24-5 (a) Allopatric speciation (b) Sympatric speciation
Fig. 24-14-1 Gene flow Population (five individuals are shown) Barrier to gene flow
Fig. 24-14-2 Gene flow Population (five individuals are shown) Barrier to gene flow Isolated population diverges
Fig. 24-14-3 Gene flow Population (five individuals are shown) Barrier to gene flow Isolated population diverges Hybrid zone Hybrid
Fig. 24-14-4 Gene flow Population (five individuals are shown) Barrier to gene flow Isolated population diverges Hybrid zone Hybrid Possible outcomes: Reinforcement OR  OR  Fusion  Stability
Breakdown of Reproductive Barriers
Evolution of Populations
Fig. 23-5 Porcupine herd Porcupine herd range Beaufort Sea NORTHWEST TERRITORIES MAP AREA ALASKA CANADA Fortymile herd range Fortymile herd ALASKA YUKON
Fig. 23-6 Frequencies of alleles Alleles in the population Gametes produced Each egg: Each sperm: 80% chance 80% chance 20% chance 20% chance q  = frequency of p  = frequency of C R  allele  = 0.8 C W  allele  = 0.2
No mutations
Random mating
No natural selection
Extremely Large Populations
No gene flow
 
 
PV92 and the ALU Transposon SINEs, or Short INterspersed Elements  ~300 bp
ALU  Human Evolution all primates showing an  Alu  insertion at a particular locus have inherited it from a common ancestor. This is called identity by descent
100,000 ALUs Retroposon: rt (reverse trancriptase) Identity by descent  ALU Transposons


Fig. 23-9 Original population Bottlenecking event Surviving population
Genetic Drift

Honors ~ Evolution 1011