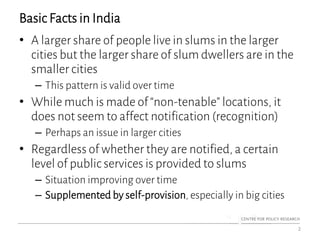
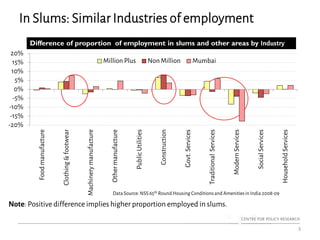
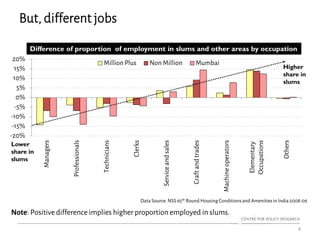
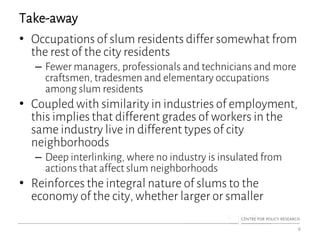
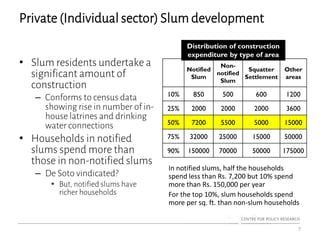
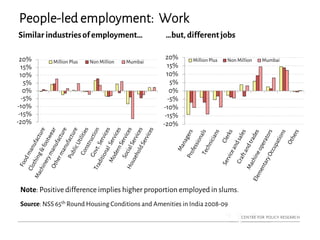
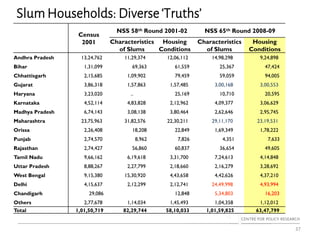
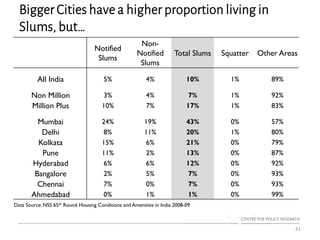
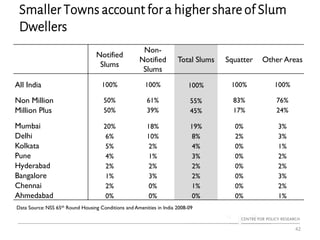
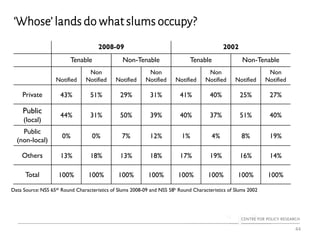
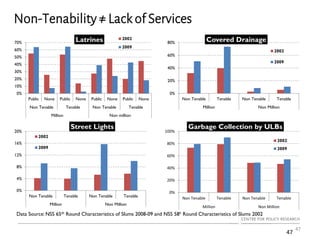
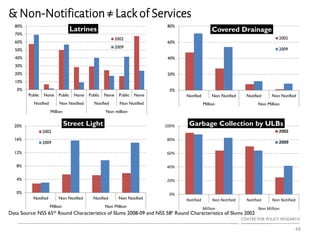
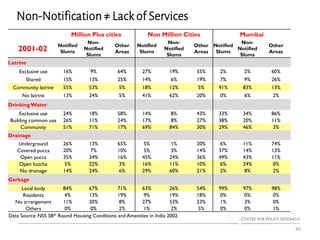
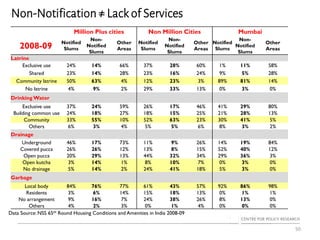
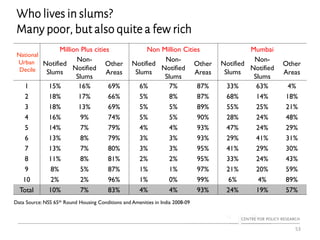
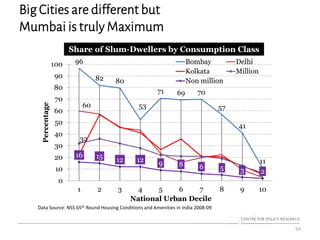
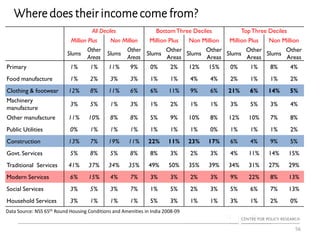
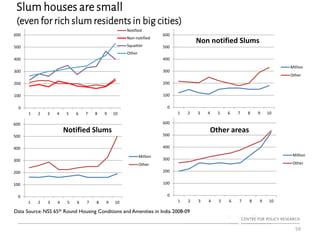
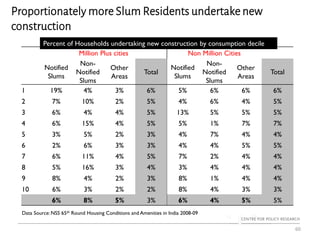
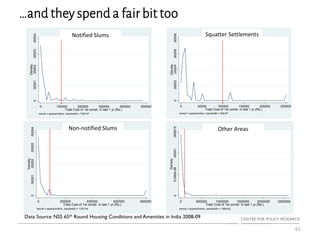
This document summarizes key points from a presentation on informal settlements in India.
1) A larger share of people live in slums in larger cities, but most slum dwellers are in smaller cities. Over time, this pattern has remained valid.
2) Regardless of whether slums are officially notified, a certain level of public services are provided to slums, and the situation is improving over time, supplemented by self-provision.
3) Industries that employ slum residents are not much different from the rest of the city, but occupations differ, with fewer managers/professionals and more craftspeople in slums. This implies different grades of workers live in different city neighborhoods.
Integrating Informal Settlements in Urban Centers, 14-16 December 2016, India -
6th Asian Pacific Ministerial Confernce on Housing and Urban Development
Best Practices in community engagement in slum rehabilitation in India - Rajiv Ranjan Mishra - Third Expert Meeting of the Regional Slum Upgrading Working Group (RSUWG) - 29th. of November to the 1st. of December 2015 in Laleh International Hotel, Tehran, I.R. of Iran
THAILAND COUNTRY-WIDE Slum Upgrading - Ms. Thipparat Noppaladarom - Third Expert Meeting of the Regional Slum Upgrading Working Group (RSUWG) - 29th. of November to the 1st. of December 2015 in Laleh International Hotel, Tehran, I.R. of Iran
Third Expert Meeting of the Regional Slum Upgrading Working Group (RSUWG) - Session IV : Slum Upgrading Indicators - 29th. of November to the 1st. of December 2015 in Laleh International Hotel, Tehran, I.R. of Iran - http://www.ruuwg.org
National Slum Development Program (NSDP) Sumit Ranjan
National Slum Development Program (NSDP)
Housing, 8th sem, B. Arch.
amount, beneficiaries, constraints and recommendations, discription, drawbacks, facilities, financial, funding, government, housing, introduction, managerial, nature, objectives, slums, technical
National Strategy Document on Revitalising, Upgrading, Renovating and Enabling Deteriorated and Underutilised Urban Fabrics - Third Expert Meeting of the Regional Slum Upgrading Working Group (RSUWG) - 29th. of November to the 1st. of December 2015 in Laleh International Hotel, Tehran, I.R. of Iran
Community Participation in Karikalan (India) Street Slum - Third Expert Meeting of the Regional Slum Upgrading Working Group (RSUWG) - 29th. of November to the 1st. of December 2015 in Laleh International Hotel, Tehran, I.R. of Iran
National Policies & Programs for Slum Upgrading in India: Bridging the Gap between Policy & Practices - Rajiv Ranjan Mishra - Third Expert Meeting of the Regional Slum Upgrading Working Group (RSUWG) - 29th. of November to the 1st. of December 2015 in Laleh International Hotel, Tehran, I.R. of Iran
Untapped potential of U-CLTS in tackling the emerging challenges of urban san...IRC
Following an introduction to the differences between the urban and rural, the Kalyani case study from Nadia District, Calcutta, India is explored. This is the first example of the succesful application of the Community Led Total Sanitation (CLTS) approach in an urban context. It shows how this behaviour change approach can help users move up the sanitation technology ladder. Presente by Kamal Kar, CLTS Foundation at the Round Table Discussion on Urban Sanitation in line with ULCTS, 1 July 2015 at The Hague, The Netherlands
Citywide slum upgrading towards the implementation of the SDG 11.1 - Ms. Kerstin Sommer (Slum Upgrading Unit Leader Programme Manager PSUP) - Third Expert Meeting of the Regional Slum Upgrading Working Group (RSUWG) - 29th. of November to the 1st. of December 2015 in Laleh International Hotel, Tehran, I.R. of Iran
Guidance is of a world of learning where resource materials are created, Managed and used in the best interest of students. It is based on the compelling truth that improving quality knowledge is the key to the each and every success.
We are dedicated to provide excellence in education, preparing leaders for a diverse, engaged in research and creative activities that generate new knowledge and applications for effective practice and that foster interdisciplinary approaches to address information challenges.
Sampling and Observation as a Research Tool Dryland Farming and Extension.pptxMunishAlagh1
What is the need and motivation to convert a research idea from literature into a project with data observations and sample surveys is the question i answer in this presentation
Slum economies play a critical role in fulfilling slum dwellers’ livelihood and consumption needs, while also making important contributions to the growing urban economies in developing countries. However, the economic opportunities of slum dwellers are constrained by significant barriers, including unsupportive – and in some cases, hostile – municipal environments, which fail to protect informal workers’ rights and provide sufficient infrastructure in slums; information asymmetries in the labor market that prevent equitable access to jobs; and insufficient access to resources (for example, skills, finance, and markets) that enable growth. These barriers constrain the income generation and economic mobility of slum dwellers, and limit access to affordable goods and services within slums.
Some communities are much better equipped than others to shape the area they live in and to use the new opportunities that the Localism agenda affords to co-design and deliver public services. Whether in terms of human and financial capital or levels of volunteering and prevalence of voluntary organisations, it is the more affluent neighbourhoods and communities that have a head start. If we disregard this fact, the whole localist agenda could inadvertently exacerbate existing inequalities rather than closing the gap.
Economics of slums in developing countries pepo_pepo2000
description of the economics in the developing countries, either why it's exist and why it remains and why does it always contradict with the government strategies in the upgrading with the slums area and it economic in order to make it apart of the community's economic.
Affordable Housing, Slum Redevelopment In Cities of IndiaRavikant Joshi
This PPT delivered to Scholars of Indian School of Public Policy discusses status and issues associated with affordable housing, slum upgradation, slum redevelopment in cities of India
how are the next 100 markets different from the large 8-10 metros and million plus cities? The answer is, of course, very different. The reason has to do with the character of India’s cities. Before I expand on that let me first brief you on how cities have evolved. (for those of you not interested in history, just bear for a couple of minutes).
Almost all major Indian cities are close to large water bodies and located on a trade route. Delhi, Mumbai, Kolkata, Indore, Pune, Jodhpur, Coimbatore, Trivandrum etc. etc. all were some type of trading centres. If we go back in history we find that each of these cities specialized in one of two types of economic activities in their initial phase of growth – whether they were manufactured items, agri commodities, or even services. They were quite specialized at some point. But as a city grew larger and larger, gradually more and more activities got added to the cities’ portfolio. In other words, as a city grew larger and larger, it became less and less specialized. Conversely some cities grew smaller and smaller, and they became more and more specialized.
This is of course a generalization, and there are many idiosyncracies built-in each city. But it helps us a lot in trying to figure how smaller cities are different.
The largest Metros are the least specialized; conversely they have the most heterogenous consumers. And so they are by far the easiest to service because they have enough numbers of all types of consumers. The probability of not finding enough demand is therefore lowest in the larger cities. And for this very reason these cities are the first point of entry for most marketers. This makes them highly competitive markets. In other words, the demand is there, but so is the competition.
Design for Inclusivity: Urban Design Strategies for the Urban Poor at city peripheries - Prof. Arunava Dasgupta (Department of Urban Design, School of Planning and Architecture Delhi) - 14-16 December 2016, India, 6th Asian Pacific Ministerial Conference on Housing and Urban Development
Automation of Intervention Option for Addressing of Slums - , 14-16 December 2016, India, 6th Asian Pacific Ministerial Confernce on Housing and Urban Development
From Seoul to New Delhi: Report of Activities 2014~2016: Regional Slum Upgrading Working Group - Presented by Farzin Fardanesh - Islamic Republic of Iran - 14-16th December 2016, Vigyan Bhawan, New Delhi, India
The APMCHUD7 Bureau Meeting confirmed that the Seventh Asia Pacific Ministerial Conference on Housing and Urban Development will be held in Islamic Republic of Iran in 2018. Find further information on the preparatory activities for the organization of this event on this presentation.
طرح های توانمندسازی در حاشیه نشین های زاهدان
Empowerment Project in Informal Settlement of Zahedan
بنیاد توسعه کارآفرینی زنان و جوانان
همایش بین المللی سکونتگاههای فقیرنشین شهری – سنندج
International Conference on Urban Slums – 4-5 May 2016 – University of Kurdistan – Sanandaj, I.R. of Iran
ساماندهی و توانمندسازی سکونتگاه های غیررسمی در شهر زنجان
(مطالعه موردی: محلّه اسلام آباد)
Organization and improvement of informal settlements in Zanjan city
(case study: Islamabad area)
1- حبیب ملایی یگانه (شهردار زنجان)
2- فاطمه لطفی (کارشناس برنامه ريزي شهري شهرداری زنجان)
3- محمدجواد حیدری (نویسنده مسئول مقاله)
International Conference on Urban Slums – 4-5 May 2016 – University of Kurdistan – Sanandaj, I.R. of Iran
همایش بین المللی سکونتگاههای فقیرنشین شهری – سنندج
استراتژیهای توانمندسازی محلات حاشيهنشين (مطالعه موردی: محلات حاشيهنشين سيلاب، احمدآباد و يانوق دره سی تبريز)
Strategics Empower Margin Dwelling Settlements
(Case Study: Settlements of Seylab, Ahmad Abad and Yanug Darasi of Tabriz)
دکتر سيد سعيد زاهد زاهدانی
دانشيار بخش جامعه شناسی دانشگاه شيراز
حيدر فتح زاده قريبه
دانشجوی دکتری جامعه شناسی
همایش بین المللی سکونتگاههای فقیرنشین شهری – سنندج
International Conference on Urban Slums – 4-5 May 2016 – University of Kurdistan – Sanandaj, I.R. of Iran
مقایسه شاخصهای جمعیتی در سکونتگاههای رسمی و غیررسمی شهر سنندج
سعید خانی، دکترای تخصصی جمعیتشناسی از دانشگاه تهران، مدرس دانشگاههای سنندج.
مسعود سالمی بوکانی، معاونت آمار و اطلاعات سازمان مدیریت و برنامهریزی استان کردستان.
رامین حیدری، کارشناس ارشد اقتصاد، رئیس گروه نقشه و GIS سازمان مدیریت و برنامهریزی استان کردستان.
قربان حسینی، کارشناس ارشد جمعیتشناسی، کارشناس پژوهشی گروه مهاجرت و شهرنشینی مؤسسه مطالعات و مدیریت جامع و تخصصی جمعیت کشور.
عبدالله مفاخری، کارشناس ارشد پژوهش علوم اجتماعی.
همایش بین المللی سکونتگاههای فقیرنشین شهری – سنندج
International Conference on Urban Slums – 4-5 May 2016 – University of Kurdistan – Sanandaj, I.R. of Iran
تاثیر و تاثر اسکان غیررسمی و پراکنش افقی شهر (مطالعه موردی: شهر سنندج)
The mutual effect of informal settlement and city sprawl (a case study of Sanandaj)
ناصح عبدی
دکترسعید زنگنه شهرکی
دکترنفیسه مرصوصی
دکترشاه بخت رستمی
همایش بین المللی سکونتگاههای فقیرنشین شهری – سنندج
International Conference on Urban Slums – 4-5 May 2016 – University of Kurdistan – Sanandaj, I.R. of Iran
بررسی عوامل موثر در فرایند شکل گیری سکونتگاههای خودانگیخته و غیررسمی و تبیین آثار و پیامدهای آن درشهرهای مرزی؛ مطالعه موردی: شهرمریوان
Investigate of Factors influencing the formation of spontaneous settlements and explain the consequences of the border cities, Case study: marivan city
شهرام پشاه آبادی
سامان حیدری
مهسا حاجی
اسعد مرادی
سیده الهام طباطبایی پور
همایش بین المللی سکونتگاههای فقیرنشین شهری – سنندج
International Conference on Urban Slums – 4-5 May 2016 – University of Kurdistan – Sanandaj, I.R. of Iran
مفهوم بهسازی و توانمندسازی در سکونتگاههای فقیرنشین:
تفاوتها، معیارها و شاخصها
The concept of upgrading and enabling in slums: differences, criteria and indexes
مهدی بهاری، حمید اتقایی
همایش بین المللی سکونتگاههای فقیرنشین شهری – سنندج
International Conference on Urban Slums – 4-5 May 2016 – University of Kurdistan – Sanandaj, I.R. of Iran
ضرورت اتخاذ رویکرد پراگماتیستی نسبت به موضوع بازآفرینی شهری در عرصة آموزش آکادمیک
Using pragmatic approach for urban regeneration in academic education
دکتر مرتضی هادی جابری مقدم
مهندس سید حسین میرزاده
همایش بین المللی سکونتگاههای فقیرنشین شهری – سنندج
International Conference on Urban Slums – 4-5 May 2016 – University of Kurdistan – Sanandaj, I.R. of Iran
بازآفرینی سکونتگاههای فقیرنشین شهری بر پایه بازاریابی مکان؛ چشم انداز جهانی
Regeneration of urban slums based on place marketing; International perspective
دکتر مجتبی رفیعیان
فاطمه محمدی آیدغمیش
همایش بین المللی سکونتگاههای فقیرنشین شهری – سنندج
International Conference on Urban Slums – 4-5 May 2016 – University of Kurdistan – Sanandaj, I.R. of Iran
تاثیر فضاهای باز جمعی بر امنیت سکونتگاههای فقیرنشین شهری
نمونه موردی: محله هرندی (دروازه غار) تهران
Impact of Public Open Spaces on Urban Slum's Security
Case Study: Harandi settlement of Tehran
سیدمحسن حبیبی
مهرناز عطاران
همایش بین المللی سکونتگاههای فقیرنشین شهری – سنندج
International Conference on Urban Slums – 4-5 May 2016 – University of Kurdistan – Sanandaj, I.R. of Iran
نقش فضاهای عمومی برای زنان در جهت ارتقاء اجتماع پذیری درسکونتگاه های غیر رسمی (مورد مطالعه: منطقه خضر)
The role of public spaces for women to sociability promotion Informal settlements (case Study: Khazer area)
پریسا منتظری شاد، محمد مهدی گودرزی سروش
همایش بین المللی سکونتگاههای فقیرنشین شهری – سنندج
International Conference on Urban Slums – 4-5 May 2016 – University of Kurdistan – Sanandaj, I.R. of Iran
برنامـه ریـزی شهـری
برای کـم درآمـدها و فقـرا در ايـران
Urban planning for the low-income and poor in Iran
همایش بین المللی سکونتگاههای فقیرنشین شهری
International Conference on Urban Slums – 4-5 May 2016 – University of Kurdistan – Sanandaj, I.R. of Iran
تحلیل راهبردی ظرفیتهای مدیریت شهری مرودشت در فرآیند تهیه و اجرای طرح توانمندسازی سکونتگاههای غیررسمی و ارائه راهکارهای ظرفیت سازی با استفاده از مدل QSPM- SWOT
Strategic Analysis of urban management capacity Marvdasht In the process of preparation and implementation of informal settlement enablement using by
QSPM- SWOT
همایش بین المللی سکونتگاههای فقیرنشین شهری – سنندج
International Conference on Urban Slums – 4-5 May 2016 – University of Kurdistan – Sanandaj, I.R. of Iran
برنامـه ریـزی شهـری
برای کـم درآمـدها و فقـرا در ايـران
Urban planning for the low-income and poor in Iran
عليــرضا محمّــدي
عضو هيئت علمي دانشگاه محقق اردبيلي
همایش بین المللی سکونتگاههای فقیرنشین شهری – سنندج
International Conference on Urban Slums – 4-5 May 2016 – University of Kurdistan – Sanandaj, I.R. of Iran
مشارکت های مردمی درمناطق اسکان غیر رسمی و نظم و امنیت اجتماعی از دید دختران محله کولی آباد کرمانشاه
Public Participation in informal settlements and order and social security The study, girls Kowli Abad district of Kermanshah
ژیلا قزوینه - بی تا حامد- شهپر گراوندی
همایش بین المللی سکونتگاههای فقیرنشین شهری – سنندج
International Conference on Urban Slums – 4-5 May 2016 – University of Kurdistan – Sanandaj, I.R. of Iran
More from Regional Urban Upgrading Working Group (RUUWG) (20)
Presentation by Jared Jageler, David Adler, Noelia Duchovny, and Evan Herrnstadt, analysts in CBO’s Microeconomic Studies and Health Analysis Divisions, at the Association of Environmental and Resource Economists Summer Conference.
ZGB - The Role of Generative AI in Government transformation.pdfSaeed Al Dhaheri
This keynote was presented during the the 7th edition of the UAE Hackathon 2024. It highlights the role of AI and Generative AI in addressing government transformation to achieve zero government bureaucracy
Donate to charity during this holiday seasonSERUDS INDIA
For people who have money and are philanthropic, there are infinite opportunities to gift a needy person or child a Merry Christmas. Even if you are living on a shoestring budget, you will be surprised at how much you can do.
Donate Us
https://serudsindia.org/how-to-donate-to-charity-during-this-holiday-season/
#charityforchildren, #donateforchildren, #donateclothesforchildren, #donatebooksforchildren, #donatetoysforchildren, #sponsorforchildren, #sponsorclothesforchildren, #sponsorbooksforchildren, #sponsortoysforchildren, #seruds, #kurnool
Jennifer Schaus and Associates hosts a complimentary webinar series on The FAR in 2024. Join the webinars on Wednesdays and Fridays at noon, eastern.
Recordings are on YouTube and the company website.
https://www.youtube.com/@jenniferschaus/videos
This session provides a comprehensive overview of the latest updates to the Uniform Administrative Requirements, Cost Principles, and Audit Requirements for Federal Awards (commonly known as the Uniform Guidance) outlined in the 2 CFR 200.
With a focus on the 2024 revisions issued by the Office of Management and Budget (OMB), participants will gain insight into the key changes affecting federal grant recipients. The session will delve into critical regulatory updates, providing attendees with the knowledge and tools necessary to navigate and comply with the evolving landscape of federal grant management.
Learning Objectives:
- Understand the rationale behind the 2024 updates to the Uniform Guidance outlined in 2 CFR 200, and their implications for federal grant recipients.
- Identify the key changes and revisions introduced by the Office of Management and Budget (OMB) in the 2024 edition of 2 CFR 200.
- Gain proficiency in applying the updated regulations to ensure compliance with federal grant requirements and avoid potential audit findings.
- Develop strategies for effectively implementing the new guidelines within the grant management processes of their respective organizations, fostering efficiency and accountability in federal grant administration.
A process server is a authorized person for delivering legal documents, such as summons, complaints, subpoenas, and other court papers, to peoples involved in legal proceedings.
Jennifer Schaus and Associates hosts a complimentary webinar series on The FAR in 2024. Join the webinars on Wednesdays and Fridays at noon, eastern.
Recordings are on YouTube and the company website.
https://www.youtube.com/@jenniferschaus/videos
Understanding the Challenges of Street ChildrenSERUDS INDIA
By raising awareness, providing support, advocating for change, and offering assistance to children in need, individuals can play a crucial role in improving the lives of street children and helping them realize their full potential
Donate Us
https://serudsindia.org/how-individuals-can-support-street-children-in-india/
#donatefororphan, #donateforhomelesschildren, #childeducation, #ngochildeducation, #donateforeducation, #donationforchildeducation, #sponsorforpoorchild, #sponsororphanage #sponsororphanchild, #donation, #education, #charity, #educationforchild, #seruds, #kurnool, #joyhome
Russian anarchist and anti-war movement in the third year of full-scale warAntti Rautiainen
Anarchist group ANA Regensburg hosted my online-presentation on 16th of May 2024, in which I discussed tactics of anti-war activism in Russia, and reasons why the anti-war movement has not been able to make an impact to change the course of events yet. Cases of anarchists repressed for anti-war activities are presented, as well as strategies of support for political prisoners, and modest successes in supporting their struggles.
Thumbnail picture is by MediaZona, you may read their report on anti-war arson attacks in Russia here: https://en.zona.media/article/2022/10/13/burn-map
Links:
Autonomous Action
http://Avtonom.org
Anarchist Black Cross Moscow
http://Avtonom.org/abc
Solidarity Zone
https://t.me/solidarity_zone
Memorial
https://memopzk.org/, https://t.me/pzk_memorial
OVD-Info
https://en.ovdinfo.org/antiwar-ovd-info-guide
RosUznik
https://rosuznik.org/
Uznik Online
http://uznikonline.tilda.ws/
Russian Reader
https://therussianreader.com/
ABC Irkutsk
https://abc38.noblogs.org/
Send mail to prisoners from abroad:
http://Prisonmail.online
YouTube: https://youtu.be/c5nSOdU48O8
Spotify: https://podcasters.spotify.com/pod/show/libertarianlifecoach/episodes/Russian-anarchist-and-anti-war-movement-in-the-third-year-of-full-scale-war-e2k8ai4
Transit-Oriented Development Study Working Group Meeting
Hippocrates and the Beatles Lessons for Informal Settlements
1. Working Group II: Session III
Hippocrates and the Beatles
Lessons for Informal Settlements
Partha Mukhopadhyay
Centre for Policy Research
2. Basic Facts in India
• A larger share of people live in slums in the larger
cities but the larger share of slum dwellers are in the
smaller cities
– This pattern is valid over time
• While much is made of “non-tenable” locations, it
does not seem to affect notification (recognition)
– Perhaps an issue in larger cities
• Regardless of whether they are notified, a certain
level of public services is provided to slums
– Situation improving over time
– Supplemented by self-provision, especially in big cities
2
3. In Slums: Similar Industries of employment
3
Difference of proportion of employment in slums and other areas by Industry
-20%
-15%
-10%
-5%
0%
5%
10%
15%
20%
Foodmanufacture
Clothing&footwear
Machinerymanufacture
Othermanufacture
PublicUtilities
Construction
Govt.Services
TraditionalServices
ModernServices
SocialServices
HouseholdServices
Million Plus Non Million Mumbai
Note: Positive difference implies higher proportion employed in slums.
Data Source: NSS 65th Round Housing Conditionsand Amenitiesin India 2008-09
5. Take-away
• Industries of employment of slum residents not much
different from the rest of the city
– Clothing and Footwear is more “slum-intensive”
e.g., see Pani and Singh (2010)
• Employs a lot of the richer slum residents
– Construction employs a lot of poorer slum residents
• Traditional Services, i.e., trade, hotels, retail and
transportation is a big employer
– Household services not a huge number, despite the popular
perception
• Slums are important for the city, not just for the personal comfort of
richer city dwellers
• Modern services is not insulated from employees who live
in slums
5
6. Take-away
• Occupations of slum residents differ somewhat from
the rest of the city residents
– Fewer managers, professionals and technicians and more
craftsmen, tradesmen and elementary occupations
among slum residents
• Coupled with similarity in industries of employment,
this implies that different grades of workers in the
same industry live in different types of city
neighborhoods
– Deep interlinking, where no industry is insulated from
actions that affect slum neighborhoods
• Reinforces the integral nature of slums to the
economy of the city, whether larger or smaller
6
7. Private (Individual sector) Slum development
• Slum residents undertake a
significant amount of
construction
– Conforms to census data
showing rise in number of in-
house latrines and drinking
water connections
• Households in notified
slums spend more than
those in non-notified slums
– De Soto vindicated?
• But, notified slums have
richer households
Notified
Slum
Non-
notified
Slum
Squatter
Settlement
Other
areas
10% 850 500 600 1200
25% 2000 2000 2000 3600
50% 7200 5500 5000 15000
75% 32000 25000 15000 50000
90% 150000 70000 50000 175000
7
In notified slums, half the households
spend less than Rs. 7,200 but 10% spend
more than Rs. 150,000 per year
For the top 10%, slum households spend
more per sq. ft. than non-slum households
Distribution of construction
expenditure by type of area
11. Reasons for slum removal do not hold
Untenable
• Slums in “non-tenable” areas are notified
and provided services
– Assumption that these sites cannot be
provided services is invalid
– Services improving over time
• Difficult to defend the argument that the
locations are unfit for human habitation
• Untenability is not a valid reason for slum
removal in many cases
– If notified, regardless of location,
Located in an area classified as
“Others (non-Hazardous/Non-
Objectionable)”, even if not notified
If at least 10% of households in the
slum report having patta, possession
certificateor occupancy rights, even if
it is not notified and not located in an
area classified as “Others (non-
Hazardous/Non-Objectionable)”.
– Only 4.1% are left ‘untenable’
Unproductive
• Slum residents work in similar
industries as non-slum residents,
albeit in different occupations in
the industry
– Integral to city’s productivity
• Both non-notified and notified
slum residents invest in housing
proportionately more than non-
slum residents
• Unproductivity is not a valid
reason for slum removal
– Slums residents are largely
productive investing citizens
11
12. Hippocrates and Beatles
• There is a case for looking
to Hippocrates and Beatles
– Never do harm
– Let it be
• The extent of service
provision in slums is better
than popular perception
and (more importantly) can
be and is being improved
– Slum improvement is an
ongoing (and viable?)
strategy
• Inconsistencies in the
process of notification send
out confusing signals about
what is tenable
– Induces a sense of (false?)
promise and prompts more
self-investment, which can
increase reluctance to
change location later
• Land based financing
ignores the contribution of
existing use of land
12
13. Local / National
• Less policy, more politics
– Local solutions
– Variation in the nature of the
problem
• A smaller city focus on
improvement may have
more bang for the buck
• More tractable scale
• Higher need for better
amenities
– Lower abilityto self-
provide
• Problem: Local does not
control much
– Where does change start?
• New cities
– Governance
• Non-Elected
– Private land and public
goods
• Earmarking by regulation?
• Implications for land
acquisition
– Keeping the settlements out
of the acquisition?
• lal dora, gaothan
– Current Chinese practice
13
14. Going forward…
• What is the slum the solution to and what would
slum-free-ness be the solution to?
• I owe the phrasing of this question to Raka Ray of Berkeley
• Recognize slum ≠ poor ≠ unproductive
– Focusing on slums leaves out much of the poor
– Understanding the slum economy and its linkages
• Livelihood related social protection issues
– Functionality of the city
• What is the nature of housing that is being
demanded?
– Quality
– Rental
14
18. Urban growth under
rural administration is a
national phenomenon
This Census town
phenomenon is not confined
to a few states, though it is
much more in some states
(where administrative
thresholds for becoming
urban are high) than others.
It is not clear what planning
standards to use for them
Only a third of these census
towns are close to a large
(more than 100,000) city – it
is not just a periphery issue
18
India: 32.8%
97%
69%
45%
39%
39%
33%
30%
24%
22%
21%
21%
18%
14%
13%
13%
10%
4%
0% 20% 40% 60% 80% 100%
Kerala
West Bengal
Jharkhand
Orissa
Tamil Nadu
NCT of Delhi
Andhra Pradesh
Punjab
Uttar Pradesh
Rajasthan
Maharashtra
Haryana
Bihar
Gujarat
Karnataka
Madhya Pradesh
Chhattisgarh
Shareof urban growthdueto censustowns
Source: Census of India 2011, 2001
Informal settlements in Indian Cities Coimbatore Sept 2016
19. Gorard’s Index of Segregation
% of Households that need to move across wards for a uniform distribution across wards
Gender
Male
Literacy
SC/ST
In-house
drinking
water
In-house
latrine
Two
wheeler
Delhi 1.0% 9.7% 25.3% 35.9% 47.8% 12.0%
Mumbai 1.6% 7.6% 19.6% 21.4% 17.7% 16.0%
Bangalore 1.1% 8.3% 20.2% 34.5% 35.9% 11.0%
Hyderabad 0.6% 8.7% 22.8% 32.1% 43.1% 8.5%
Ahmedabad 0.8% 7.7% 28.2% 24.2% 35.4% 13.3%
Chennai 0.7% 8.6% 27.7% 27.9% 43.7% 9.9%
Kolkata 2.3% 16.6% 35.0% 24.3% 37.3% 15.5%
Surat 3.4% 6.6% 28.8% 39.0% 37.9% 19.2%
Pune 1.2% 9.4% 25.0% 29.2% 36.5% 8.3%
Jaipur 0.6% 12.7% 25.0% 41.3% 53.1% 10.0%
The level of ‘segregation’ for SC/ST is less than that observed for race in the United States
‘Segregation’ is even higher for amenities like in-house latrines and water
21. State-led: Ten Inequality Producing Actions in Delhi
• First, DDA builds for the relatively rich
and not for the poor
• Second,people cannot formally develop
land for housing
• Third, courts often do not recognise
rights of residents of JJCs. By one
reading, courts in Delhi have been a
demolition machine
• Fourth, the state uses the law to
constrict employment options, by
relocation of industry
• Fifth,it impedes the progress of even
the few relocated JJC residents by
peripheralising the location and
reducing the plot size in RCs
• Sixth,services remain poor in RCs,
despite being legal and planned
settlements,
• Seventh,in some UACs, the residents
have to depend on an extensive private
piped network; distributing water from
borewells, which is more expensive,
poorer in quality and limited in supply
• Eighth, JJCs in Delhi that are often
demolished to ostensibly build
infrastructure like roads, flyovers and the
Delhi metro rail bear the brunt of the
costs, but the benefits disproportionately
accrue to privileged households
• Ninth, agencies like DJB exclude existing
UACs and JJCs from their network plans,
due to their ‘illegal’ status
• Tenth, transport investment in Delhi is
skewed towards the metro railway, which
accounted for 86% of the plan investment
in sector in 2013-14
21
Source: StateProducedInequalityin an IndianCitySeminarAugust 2015 PATRICK HELLER and PARTHA MUKHOPADHYAY
22. People-led transport: smart?
Bus services uncommon
Paratransit is a common mode
of public transport
Usually licensed by
district authorities
Little organisation
Shared use, per seat fare
instead of per vehicle fare
Usually, detested by
authorities
Does not have to be this way
Kolkata started with
metered auto rickshaws
Soon moved to point to
point service
Organized into point to
point routes by unions
Routes recognised by
transport authorities
23. People-led employment: Work
Similar industriesofemployment…
-20%
-15%
-10%
-5%
0%
5%
10%
15%
20% Million Plus Non Million Mumbai
…but, differentjobs
-20%
-15%
-10%
-5%
0%
5%
10%
15%
20% Million Plus Non Million Mumbai
Source: NSS 65th Round Housing Conditions and Amenities in India 2008-09
Note: Positive difference implies higher proportion employed in slums.
24. 24
Where do urban men work? Formal and Informal
0%
5%
10%
15%
20%
25%
30%
35%
40%
M
iningM
anfufacturing
U
tilitiesC
onstruction
TradeFood
service
Transportand
Com
m
unications
FinancialInterm
ediation
R
ealEsate
G
overnm
ent
Education
H
ealth
O
therC
om
m
unity
Private
H
ouseholds
25. 25
Where do urban women work? Formal and Informal
0%
5%
10%
15%
20%
25%
30%
35%
40%
M
ining
M
anfufacturing
U
tilitiesC
onstruction
TradeFood
service
Transportand
Com
m
unications
FinancialInterm
ediation
R
ealEsateG
overnm
ent
Education
H
ealth
O
therC
om
m
unity
Private
Households
26. People-led: Housing (45 cities of more than 1mn)
One room or no room Two or less rooms
2
13 15
9
6
0
2
4
6
8
10
12
14
No.ofCities
PercentageofHouseholds
In43or45cities,more
thanhalfthehouseholds
liveintwoorlessrooms
3
14
13
10
5
0
2
4
6
8
10
12
14
No.ofCities
Percentageofhouseholds
Informal settlements in Indian Cities Coimbatore Sept 2016
Source: Census of India 2011
28. Is this Idealistic?
• Planning and especially, Architecture, are professions
– Is it worth looking at households who will not be clients?
• Responses at a number of levels
– Simplest is to think of public agencies as clients
• Compared even to cities in China, where planning is a relatively
recent discipline, public agencies in India are very small and
poorly staffed – this can change…
– Singapore Housing and Development Board, Shenzhen Urban
Planning and Design Institute
– Economic growth requires this mixture of population
• “Clients” would not exist without this population
– Moral
29. Professional relevance
• Is the profession relevant
for :
– A household in a two-room
house
+ Sharing the house with
another couple
+ Sharing a toilet with another
household
+ In an area that is not planned
+ In which three fourths of the
population lives
• Or for
– A household in a “village”
that has given up farming,
but is relatively far from a
large town
• This is as much an issue of
analysis
– What is driving these forms
of urbanisation
• Within the city?
• In the census towns?
• As design
– Can we do in-situ service
provision (not just demolish
and redevelop on site) of
settlements?
– Can we work with non-
network solutions that build
on individual’s investments?
• How do you deal with rising
investment in septic tanks?
30. So,…
Pieces of Putty
• Can cities be remoulded?
• If so, by whom?
– SPVs
– Chief Ministers
– Municipality
– Or…
• If so, how?
– Planning
– Investment in
infrastructure
– Or…
Places of Protest
• Protesting by Voice
– Estamos presentes
• The right to stay put in
Mumbai
• Protesting by Action
– By building
• Unauthorised colonies
in Delhi
– By providing services
• Paratransit in Kolkata
– By working
32. Does “Chindia” matter/ make
sense?
To keep the planet warming more
than 2 degrees, we have a budget of
roughly 3700 bn. tons of CO2
emissions. We have spent 2200 bn.
Currently, the world is emitting 35 bn.
tons a year – which means we exhaust
our budget around 2060…
85% of China’s emissions and 55% of
India’s emissions are from cities
Numbers may hide as much as they
reveal. Consumption and population
(China)
0
5
10
15
20
25
CO2 emissions per capita
May not be as high
May not be as low
34. ‘Reasons’ for Slum Removal
Untenable
• Slums are on land unfit for
human habitation
– Hazard for slum dwellers and
public health
• Implicit assumption that site
cannot be provided services
• Q. Is this true and what is
happening on the ground?
Unproductive
• Land is needed for more
productive use
– Implicit assumption of slum use
being low/ zero productivity
• Use of land after slum
removal
• Q. Who lives in slums and are
they productive?
34
35. Plan of Presentation
• Definitions and Data Sources
– Comparability of different sources
• Tenability
– Where are the slums?
• Location
– Amenities in slums
• Do services differ by tenability/ notification?
• Productivity
– Who are the people living in slums?
– What do they do?
• Occupation
– How do they view their future?
• Investment in housing
• How well do the reasons for removal hold?
35
36. Definitions and Data Sources
• Slum: A slum is a compact area …with a collection of poorly built
tenements, mostly of temporary nature, crowded together usually with
inadequate sanitary and drinking water facilities in unhygienic
conditions... Such an area will be considered as a slum if at least 20
households live in that area for the purpose of this survey. Certain areas
notified as slums by the respective municipalities, corporations, local
bodies or development authorities will be treated as ‘notified slums’.
Slum will be considered in urban areas only. An area having at least 20
households of notified slum …will always be considered as a slum.
• Squatter settlement: Sometimes an area develops into an unauthorised
settlement with unauthorised structures put up by “squatters”. Squatter
settlement will include all slum like settlements which do not have the
stipulated number of 20 households to be classified as a slum
36
38. Data Used in Analysis
• Different sources can provide wide variation
– Some estimates are patently absurd
• Delhi, Chandigarh
• Analysis uses
– Characteristics of Slum data to investigate issues of
tenability and relationship to service provision
– Housing condition data for household level analysis and
comparison of slum with rest of city
– Three broad categories
• Million plus cities
• Other cities
• Specific cities
38
44. ‘Whose’ lands do what slums occupy?
44
2008-09 2002
Tenable Non-Tenable Tenable Non-Tenable
Notified
Non
Notified Notified
Non
Notified Notified
Non
Notified Notified
Non
Notified
Private 43% 51% 29% 31% 41% 40% 25% 27%
Public
(local)
44% 31% 50% 39% 40% 37% 51% 40%
Public
(non-local)
0% 0% 7% 12% 1% 4% 8% 19%
Others 13% 18% 13% 18% 17% 19% 16% 14%
Total 100% 100% 100% 100% 100% 100% 100% 100%
Data Source: NSS 65th Round Characteristics of Slums 2008-09 and NSS 58h Round Characteristics of Slums 2002
45. Location: Dharavi
45
• The location of Dharavi is integral to the intensity of efforts to ‘redevelop’ the
area.
BKC
46. Non-Tenability ≠ Non-Notification
46
8%
16%
9%
8%
13%
14% 14%
18%
0%
5%
10%
15%
20%
Non
Tenable
Tenable Non
Tenable
Tenable Non
Tenable
Tenable Non
Tenable
Tenable
Notified Non Notified Notified Non Notified
Million Non million
ShareofSlumsinIndia
Data Source: NSS 65th Round Characteristics of Slums 2008-09
47. Non-Tenability ≠ Lack of Services
47
0%
10%
20%
30%
40%
50%
60%
70%
Public None Public None Public None Public None
Non Tenable Tenable Non Tenable Tenable
Million Non million
Latrines 2002
2009
0%
4%
8%
12%
16%
20%
Non Tenable Tenable Non Tenable Tenable
Million Non Million
Street Lights
2002
2009
0%
20%
40%
60%
80%
Non Tenable Tenable Non Tenable Tenable
Million Non Million
Covered Drainage
2002
2009
0%
20%
40%
60%
80%
100%
Non Tenable Tenable Non Tenable Tenable
Million Non Million
Garbage Collection by ULBs
2002
2009
Data Source: NSS 65th Round Characteristics of Slums 2008-09 and NSS 58h Round Characteristics of Slums 2002
47
48. & Non-Notification ≠ Lack of Services
48
0%
4%
8%
12%
16%
20%
Notified Non Notified Notified Non Notified
Million Non Million
Street Light
2002
2009
0%
10%
20%
30%
40%
50%
60%
70%
80%
Public None Public None Public None Public None
Notified Non Notified Notified Non Notified
Million Non million
Latrines
2002
2009
0%
20%
40%
60%
80%
Notified Non Notified Notified Non Notified
Million Non Million
Covered Drainage
2002
2009
0%
20%
40%
60%
80%
100%
Notified Non Notified Notified Non Notified
Million Non Million
Garbage Collection by ULBs
2002
2009
Data Source: NSS 65th Round Characteristics of Slums 2008-09 and NSS 58h Round Characteristics of Slums 2002
49. Non-Notification ≠ Lack of Services
49
Million Plus cities Non Million Cities Mumbai
2001-02
Notified
Slums
Non-
Notified
Slums
Other
Areas
Notified
Slums
Non-
Notified
Slums
Other
Areas
Notified
Slums
Non-
Notified
Slums
Other
Areas
Latrine
Exclusive use 16% 9% 64% 27% 19% 55% 2% 2% 60%
Shared 15% 13% 25% 14% 6% 19% 7% 9% 26%
Community latrine 55% 53% 5% 18% 12% 5% 91% 83% 13%
No latrine 13% 24% 5% 41% 62% 20% 0% 6% 2%
Drinking Water
Exclusive use 24% 18% 58% 14% 8% 43% 33% 34% 86%
Building common use 26% 11% 24% 17% 8% 27% 38% 20% 11%
Community 51% 71% 17% 69% 84% 30% 29% 46% 3%
Drainage
Underground 26% 13% 65% 5% 1% 20% 6% 11% 74%
Covered pucca 20% 7% 10% 5% 3% 14% 37% 14% 13%
Open pucca 35% 34% 16% 45% 24% 36% 49% 43% 11%
Open kutcha 5% 22% 3% 16% 11% 10% 6% 24% 0%
No drainage 14% 24% 6% 29% 60% 21% 2% 8% 2%
Garbage
Local body 84% 67% 71% 63% 26% 54% 99% 97% 98%
Residents 4% 13% 19% 9% 19% 18% 0% 0% 0%
No arrangement 11% 20% 8% 27% 53% 23% 1% 3% 0%
Others 0% 0% 2% 1% 2% 5% 0% 0% 1%
Data Source: NSS 58th Round Housing Conditions and Amenities in India 2002
50. Non-Notification ≠ Lack of Services
50
Million Plus cities Non Million Cities Mumbai
2008-09
Notified
Slums
Non-
Notified
Slums
Other
Areas
Notified
Slums
Non-
Notified
Slums
Other
Areas
Notified
Slums
Non-
Notified
Slums
Other
Areas
Latrine
Exclusive use 24% 14% 66% 37% 28% 60% 1% 11% 58%
Shared 23% 14% 28% 23% 16% 24% 9% 5% 28%
Community latrine 50% 63% 4% 12% 23% 3% 89% 81% 14%
No latrine 4% 9% 2% 29% 33% 13% 0% 3% 0%
Drinking Water
Exclusive use 37% 24% 59% 26% 17% 46% 41% 29% 80%
Building common use 24% 18% 27% 18% 15% 25% 21% 28% 13%
Community 33% 55% 10% 52% 63% 23% 30% 41% 5%
Others 6% 3% 4% 5% 5% 6% 8% 3% 2%
Drainage
Underground 46% 17% 73% 11% 9% 26% 14% 19% 84%
Covered pucca 26% 26% 12% 13% 8% 15% 52% 40% 12%
Open pucca 20% 29% 13% 44% 32% 34% 29% 36% 3%
Open kutcha 3% 14% 1% 8% 10% 7% 0% 3% 0%
No drainage 5% 14% 2% 24% 41% 18% 5% 3% 0%
Garbage
Local body 84% 76% 77% 61% 43% 57% 92% 86% 98%
Residents 3% 6% 14% 15% 18% 13% 0% 1% 1%
No arrangement 9% 16% 7% 24% 38% 26% 8% 13% 0%
Others 4% 2% 3% 0% 1% 4% 0% 0% 0%
Data Source: NSS 65th Round Housing Conditions and Amenities in India 2008-09
53. Who lives in slums?
Many poor, but also quite a few rich
53
National
Urban
Decile
Million Plus cities Non Million Cities Mumbai
Notified
Slums
Non-
Notified
Slums
Other
Areas
Notified
Slums
Non-
Notified
Slums
Other
Areas
Notified
Slums
Non-
Notified
Slums
Other
Areas
1 15% 16% 69% 6% 7% 87% 33% 63% 4%
2 18% 17% 66% 5% 8% 87% 68% 14% 18%
3 18% 13% 69% 5% 5% 89% 55% 25% 21%
4 16% 9% 74% 5% 5% 90% 28% 24% 48%
5 14% 7% 79% 4% 4% 93% 47% 24% 29%
6 13% 8% 79% 3% 3% 93% 29% 41% 31%
7 13% 7% 80% 3% 3% 95% 41% 29% 30%
8 11% 8% 81% 2% 2% 95% 33% 24% 43%
9 8% 5% 87% 1% 1% 97% 21% 20% 59%
10 2% 2% 96% 1% 0% 99% 6% 4% 89%
Total 10% 7% 83% 4% 4% 93% 24% 19% 57%
Data Source: NSS 65th Round Housing Conditions and Amenities in India 2008-09
54. Big Cities are different but
Mumbai is truly Maximum
54
96
82 80
53
71 69 70
57
41
11
60
32
16 15 12 12 9 8 6 5 3 2
0
10
20
30
40
50
60
70
80
90
100
1 2 3 4 5 6 7 8 9 10
Percentage
National Urban Decile
Bombay Delhi
Kolkata Million
Non million
Data Source: NSS 65th Round Housing Conditions and Amenities in India 2008-09
Share of Slum-Dwellers by Consumption Class
56. Where does their income come from?
56
All Deciles BottomThree Deciles TopThree Deciles
Million Plus Non Million Million Plus Non Million Million Plus Non Million
Slums
Other
Areas
Slums
Other
Areas
Slums
Other
Areas
Slums
Other
Areas
Slums
Other
Areas
Slums
Other
Areas
Primary 1% 1% 11% 9% 0% 2% 12% 15% 0% 1% 8% 4%
Food manufacture 1% 2% 3% 3% 1% 1% 4% 4% 2% 1% 1% 2%
Clothing & footwear 12% 8% 11% 6% 6% 11% 9% 6% 21% 6% 14% 5%
Machinery
manufacture
3% 5% 1% 3% 1% 2% 1% 1% 3% 5% 3% 4%
Other manufacture 11% 10% 8% 8% 5% 9% 10% 8% 12% 10% 7% 8%
Public Utilities 0% 1% 1% 1% 1% 1% 1% 0% 1% 1% 1% 2%
Construction 13% 7% 19% 11% 22% 11% 23% 17% 6% 4% 9% 5%
Govt. Services 5% 8% 5% 8% 8% 3% 2% 3% 4% 11% 14% 15%
Traditional Services 41% 37% 34% 35% 49% 50% 35% 39% 34% 31% 27% 29%
Modern Services 6% 15% 4% 7% 3% 3% 2% 3% 9% 22% 8% 13%
Social Services 3% 5% 3% 7% 1% 5% 2% 3% 5% 6% 7% 13%
Household Services 3% 1% 1% 1% 5% 3% 1% 1% 3% 1% 2% 0%
Data Source: NSS 65th Round Housing Conditions and Amenities in India 2008-09
57. What kind of jobs do they do?
57
All Deciles BottomThree Deciles TopThree Deciles
Million Plus Non Million Million Plus Non Million Million Plus Non Million
Slums
Other
Areas
Slums
Other
Areas
Slums
Other
Areas
Slums
Other
Areas
Slums
Other
Areas
Slums
Other
Areas
Managers 4% 18% 6% 13% 4% 12% 6% 7% 3% 23% 9% 18%
Professionals 9% 13% 4% 11% 6% 5% 2% 4% 14% 19% 9% 21%
Technicians 2% 8% 3% 6% 0% 2% 1% 2% 5% 11% 10% 11%
Clerks 5% 7% 2% 6% 1% 1% 1% 2% 6% 10% 5% 10%
Service and sales 17% 13% 12% 15% 14% 15% 10% 15% 17% 12% 13% 14%
Craft and trades 22% 17% 27% 18% 13% 23% 28% 23% 30% 12% 23% 11%
Machine operators 13% 10% 10% 8% 10% 13% 6% 8% 10% 7% 14% 6%
Elementary
Occupations
27% 12% 32% 18% 52% 28% 41% 32% 14% 5% 15% 6%
Others 1% 1% 4% 5% 0% 1% 5% 7% 0% 1% 2% 3%
Data Source: NSS 65th Round Housing Conditions and Amenities in India 2008-09
59. Slum houses are small
(even for rich slum residents in big cities)
59
0
100
200
300
400
500
600
1 2 3 4 5 6 7 8 9 10
Notified
Non-notified
Squatter
Other
0
100
200
300
400
500
600
1 2 3 4 5 6 7 8 9 10
Notified Slums
Million
Other
0
100
200
300
400
500
600
1 2 3 4 5 6 7 8 9 10
Non notified Slums
Million
Other
0
100
200
300
400
500
600
1 2 3 4 5 6 7 8 9 10
Other areas
Million
Other
Data Source: NSS 65th Round Housing Conditions and Amenities in India 2008-09
60. Proportionately more Slum Residents undertake new
construction
60
Million Plus cities Non Million Cities
Notified
Slums
Non-
Notified
Slums
Other
Areas
Total
Notified
Slums
Non-
Notified
Slums
Other
Areas
Total
1 19% 4% 3% 6% 5% 6% 6% 6%
2 7% 10% 2% 5% 4% 6% 4% 5%
3 6% 4% 4% 5% 13% 5% 5% 5%
4 6% 15% 4% 5% 5% 1% 7% 7%
5 3% 5% 2% 3% 4% 7% 4% 4%
6 2% 6% 3% 3% 4% 4% 5% 5%
7 6% 11% 4% 5% 7% 2% 4% 4%
8 5% 16% 3% 4% 3% 4% 4% 4%
9 8% 4% 2% 3% 8% 1% 4% 4%
10 6% 3% 2% 2% 8% 4% 3% 3%
6% 8% 5% 3% 6% 4% 5% 5%
Data Source: NSS 65th Round Housing Conditions and Amenities in India 2008-09
Percent of Households undertaking new construction by consumption decile
61. …and they spend a fair bit too
61
05.000e-06.00001.000015
Density
0 500000 1000000 1500000 2000000 2500000
Total Cost of 1st constr. in last 1 yr.(Rs.)
kernel = epanechnikov, bandwidth = 1598.82
Kernel density estimate
0.00002.00004.00006.00008
Density
0 50000 100000 150000 200000 250000
Total Cost of 1st constr. in last 1 yr.(Rs.)
kernel = epanechnikov, bandwidth = 840.67
Kernel density estimate0.00001.00002.00003.00004
Density
0 200000 400000 600000 800000
Total Cost of 1st constr. in last 1 yr.(Rs.)
kernel = epanechnikov, bandwidth = 1370.34
Kernel density estimate
0.00001.00002.00003.00004
Density
0 100000 200000 300000 400000 500000
Total Cost of 1st constr. in last 1 yr.(Rs.)
kernel = epanechnikov, bandwidth = 1243.57
Kernel density estimateNotified Slums
Non-notified Slums
Squatter Settlements
Other Areas
Data Source: NSS 65th Round Housing Conditions and Amenities in India 2008-09
62. How can 5% of slum
households be ‘managers’?
in million
Share of
Owners
Managers 12.3 7.9 64%
Professionals 9.3 3.5 38%
Technicians 6.5 1.0 16%
Clerks 5.3 0.1 2%
Service and sales 14.0 4.6 33%
Craft and trades 4.0 0.6 15%
Machine operators 17.9 4.5 25%
Elementary Occupations 7.4 1.7 23%
Managers 17.7 2.8 16%
X 0.1 0.0 21%
Total 94.4 26.7 28%
From the NSS 66th Round
‘Employment & Unemployment
Survey’ (EUS) in 2009-10, we find a
large majority of senior officials/
managers are ‘Owners’ Their share
is 64%
Owners are defined as those
working in partnerships or
proprietorship and self-employed.
Note: EUS is individual level data
and cannot be separated by those
living in slums and non slums.
62
63. Where is the Indian City?
Working Group I: SessionII
Integrated Planning, Management and Governance Structure Imperatives
64. Where?
Urban India is more about morphing places, than about moving people
64
24.3% 25.3%
8.2%
25.6%
6.7% 2.6%
6.4%
0.9%
25.6%
34.1%
7.4%
32.9%
0%
5%
10%
15%
20%
25%
30%
35%
40%
Million Plus
Towns
1L - 10L
Towns
Census
Towns
Other
Urban Areas
ShareofUrbanPopulationby TypeofUrban Area
2001 2011_New 2011_Old
Census towns are functionally urban (share of non-farm work more than 75%) and large
(more than 5000 people) villages, that continue to be administered by rural authorities.
The new scheme, SP Mukherji RURBAN Mission, in the Ministry of Rural Development
Source: Census of India 2011, 2001
65. The spread of majority Non-farm
(50%+) Villages over time
Villages with ‘better sanitation’
than smaller towns in the state
66. What drives urban
population growth?
The growth of urban population can
be decomposed into natural
population growth in existing urban
areas, boundary expansion,
changes in classification from rural
to urban (for both statutory and
‘censustowns’ ) and net migration.
The chart shows that the share of
change in classification (35%) – see
census towns in previous slide – is
more than net migration (23%),
though gross rural urban flows
(36%) are comparable.
Over 1999-2001, natural population
growth in existing urban areas
accounted for 69%, compared to
42% over 2001-11
20.6
38.5
31.8
-11.5
-15 0 15 30 45 60 75 90
Components of Urban Population Growth (mn.)
Net Rural Urban Migration Natural Growth and expansion
Change in Classification Urban Rural Migration
32.1 TotalRuralUrbanMigration