Finding the insights
hidden in your graph
data.
SAS founded in 2013 in Paris | http://linkurio.us | @linkurious
Introduction.
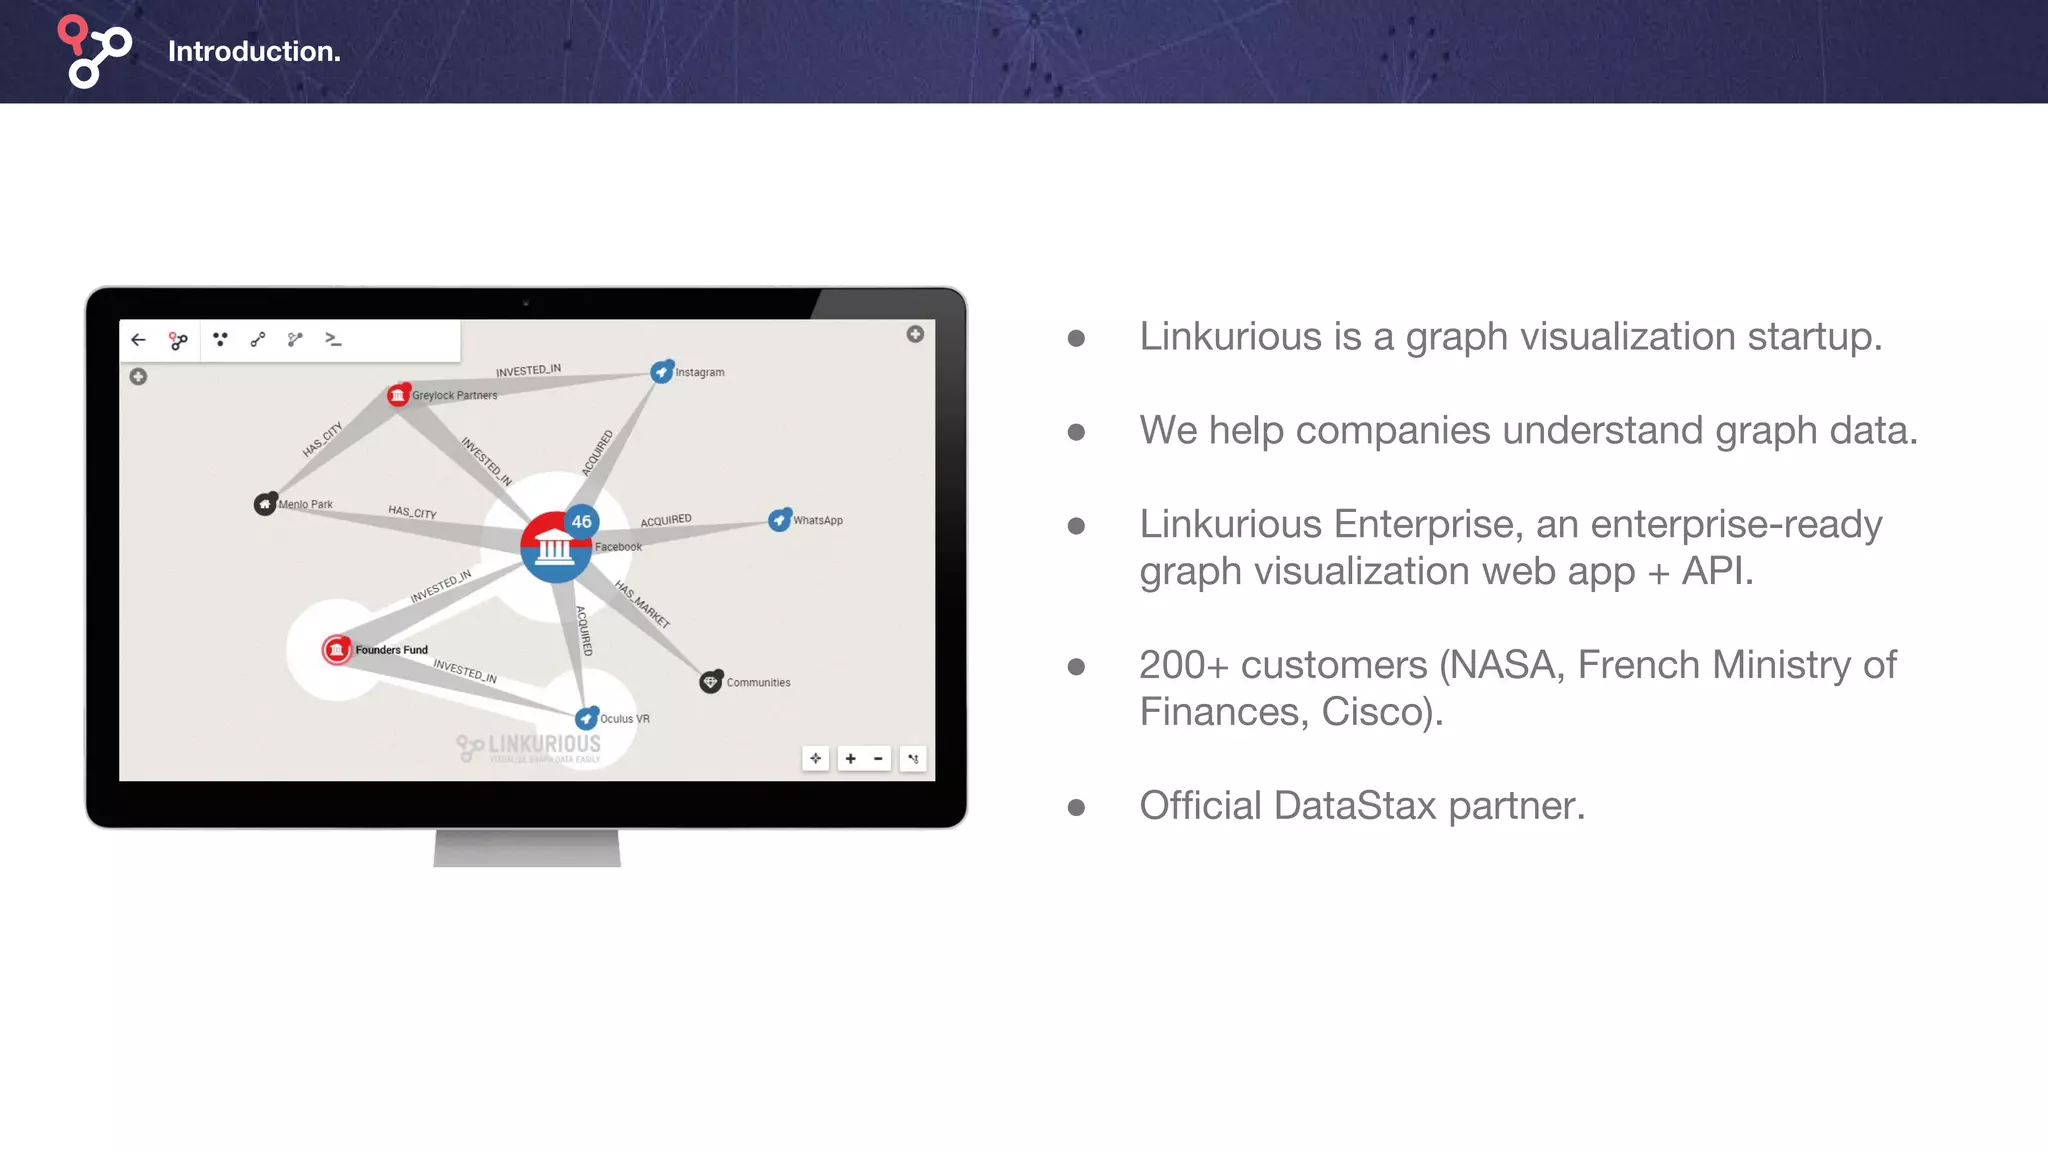
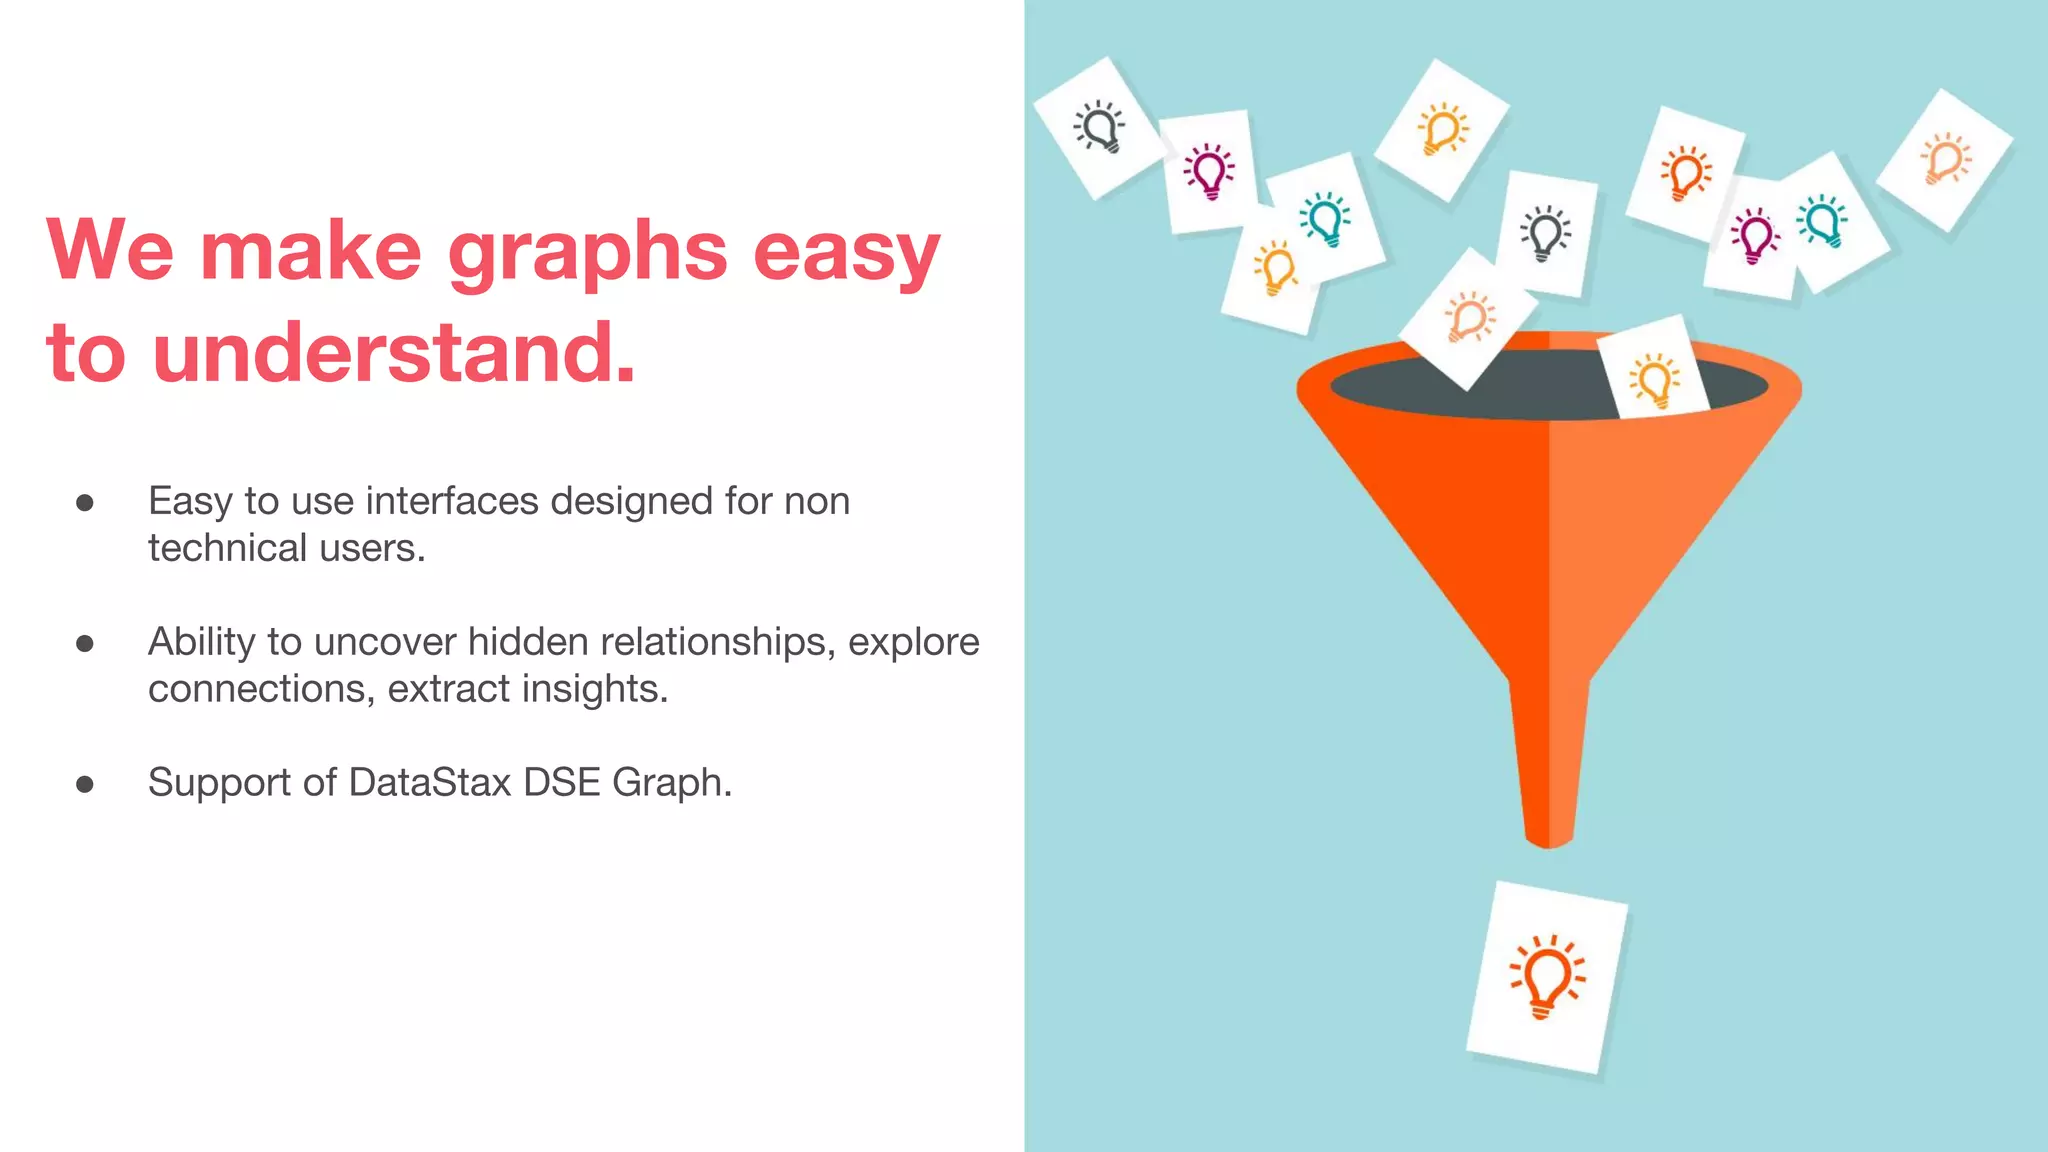
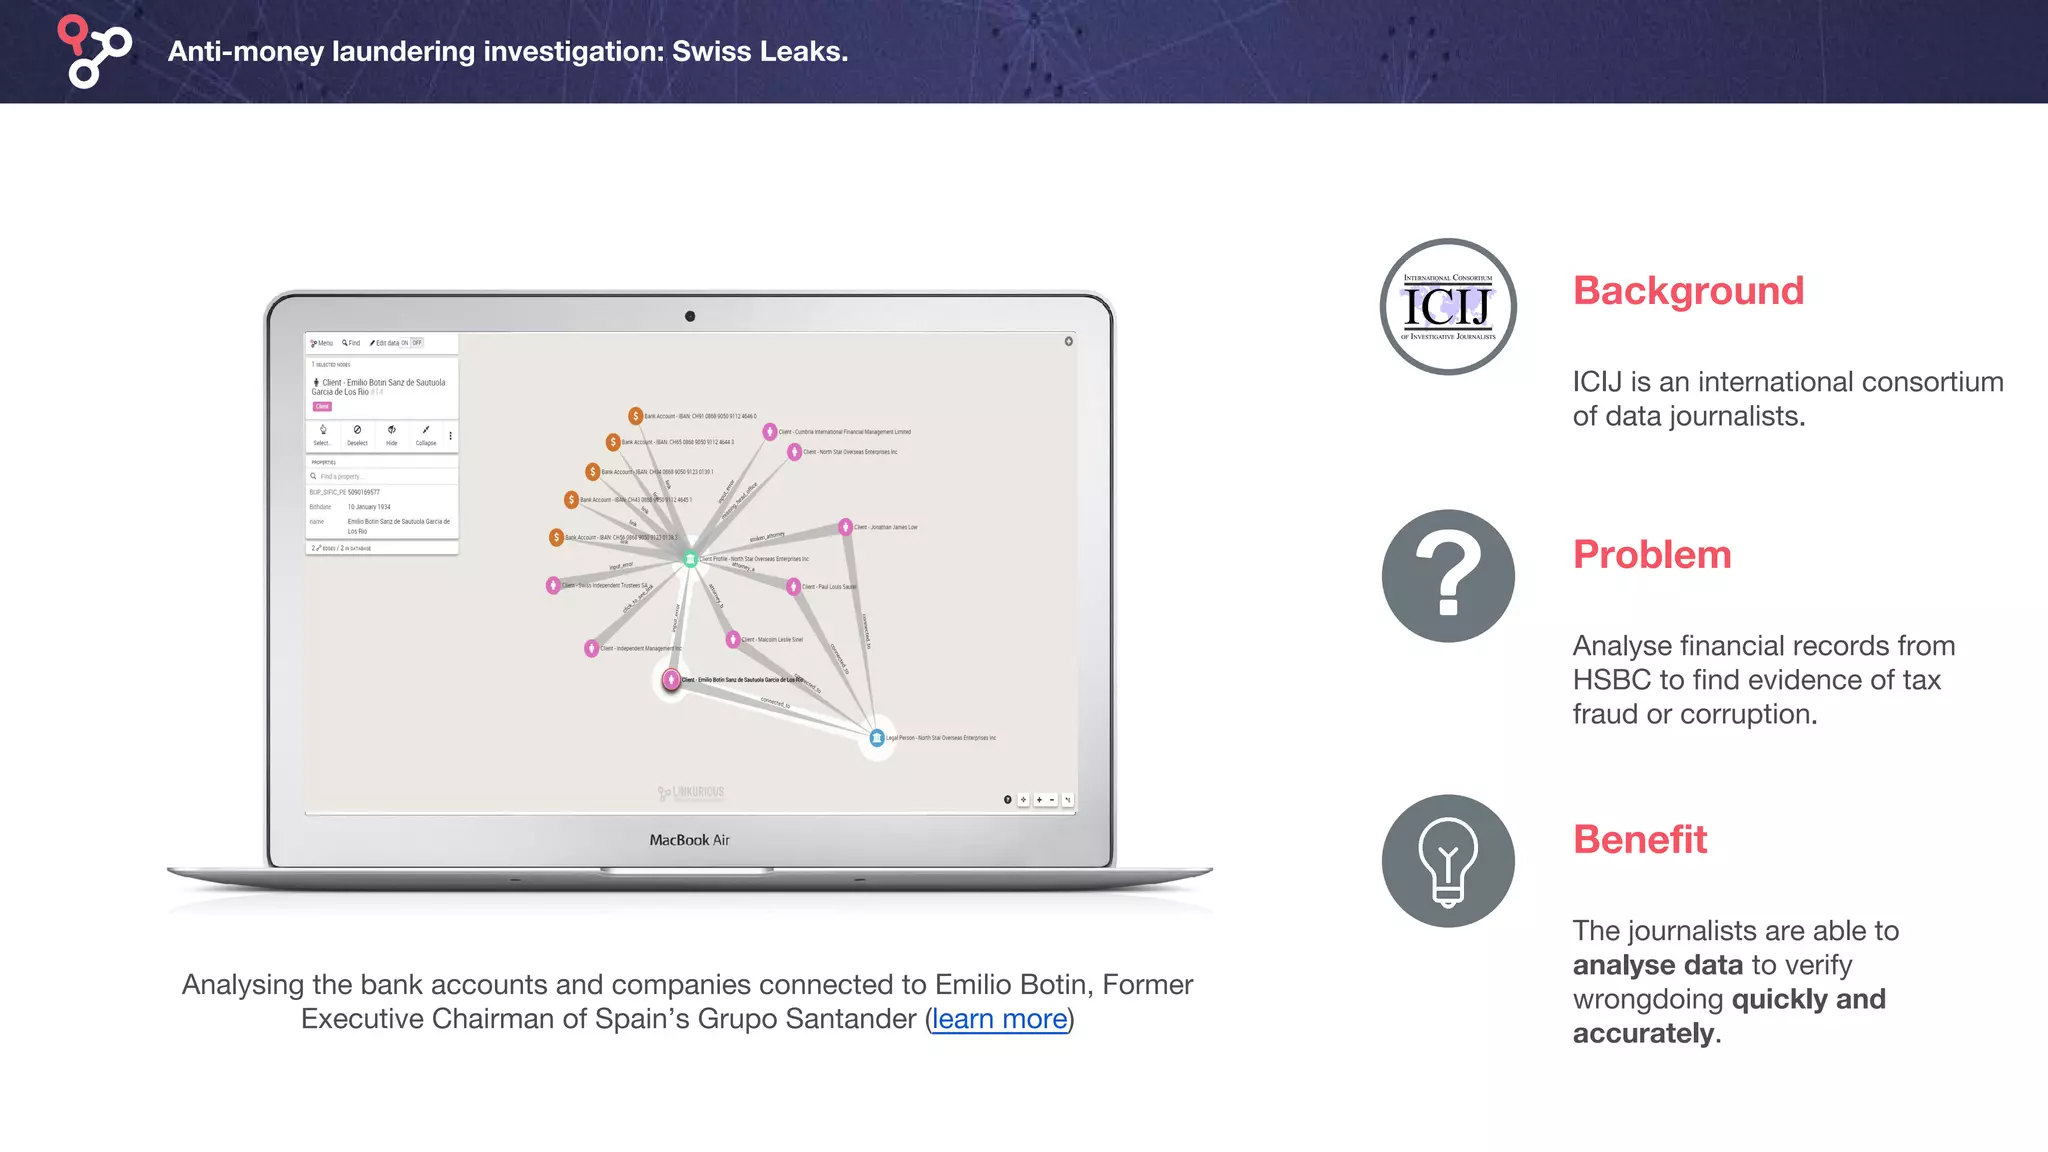
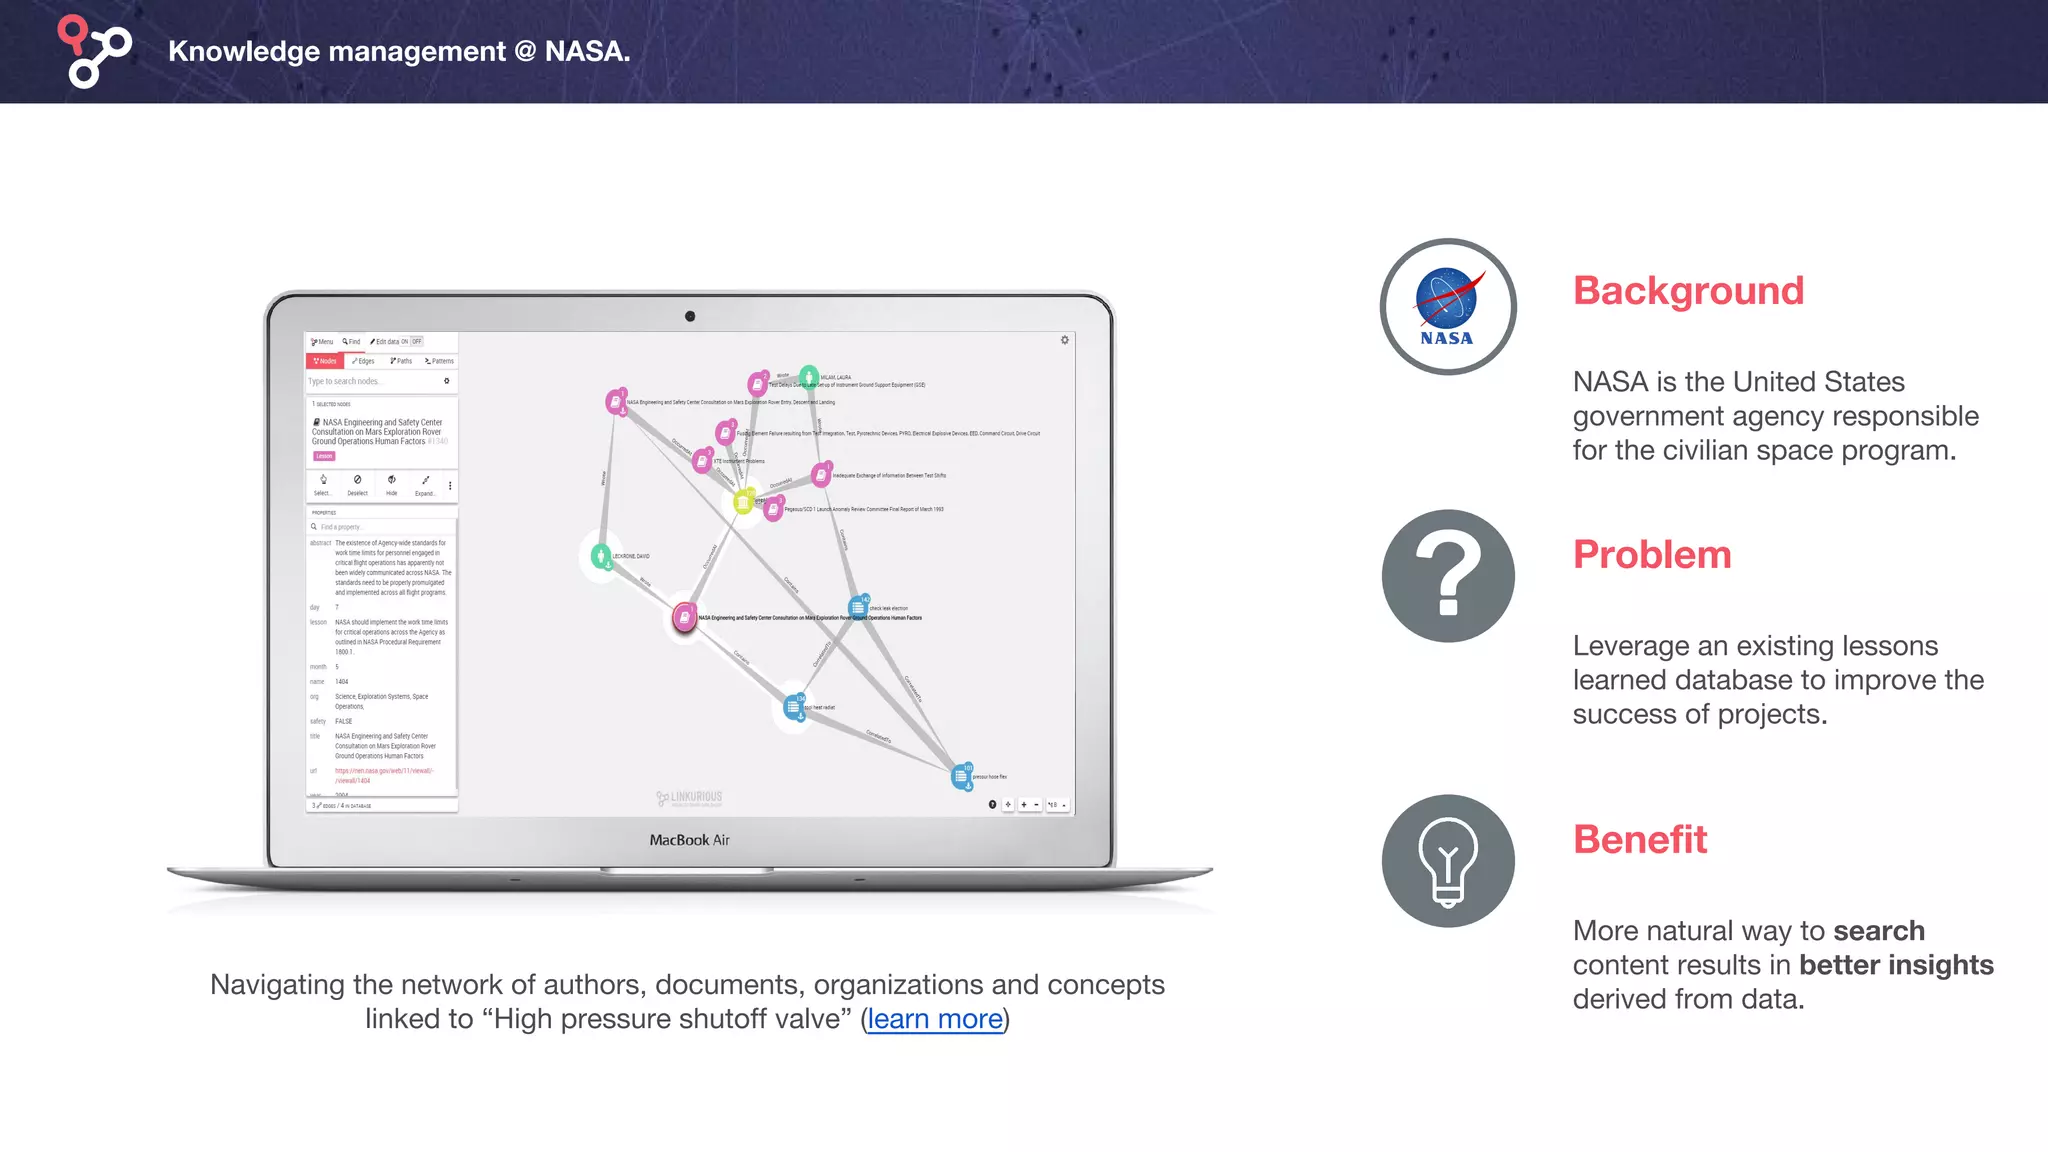
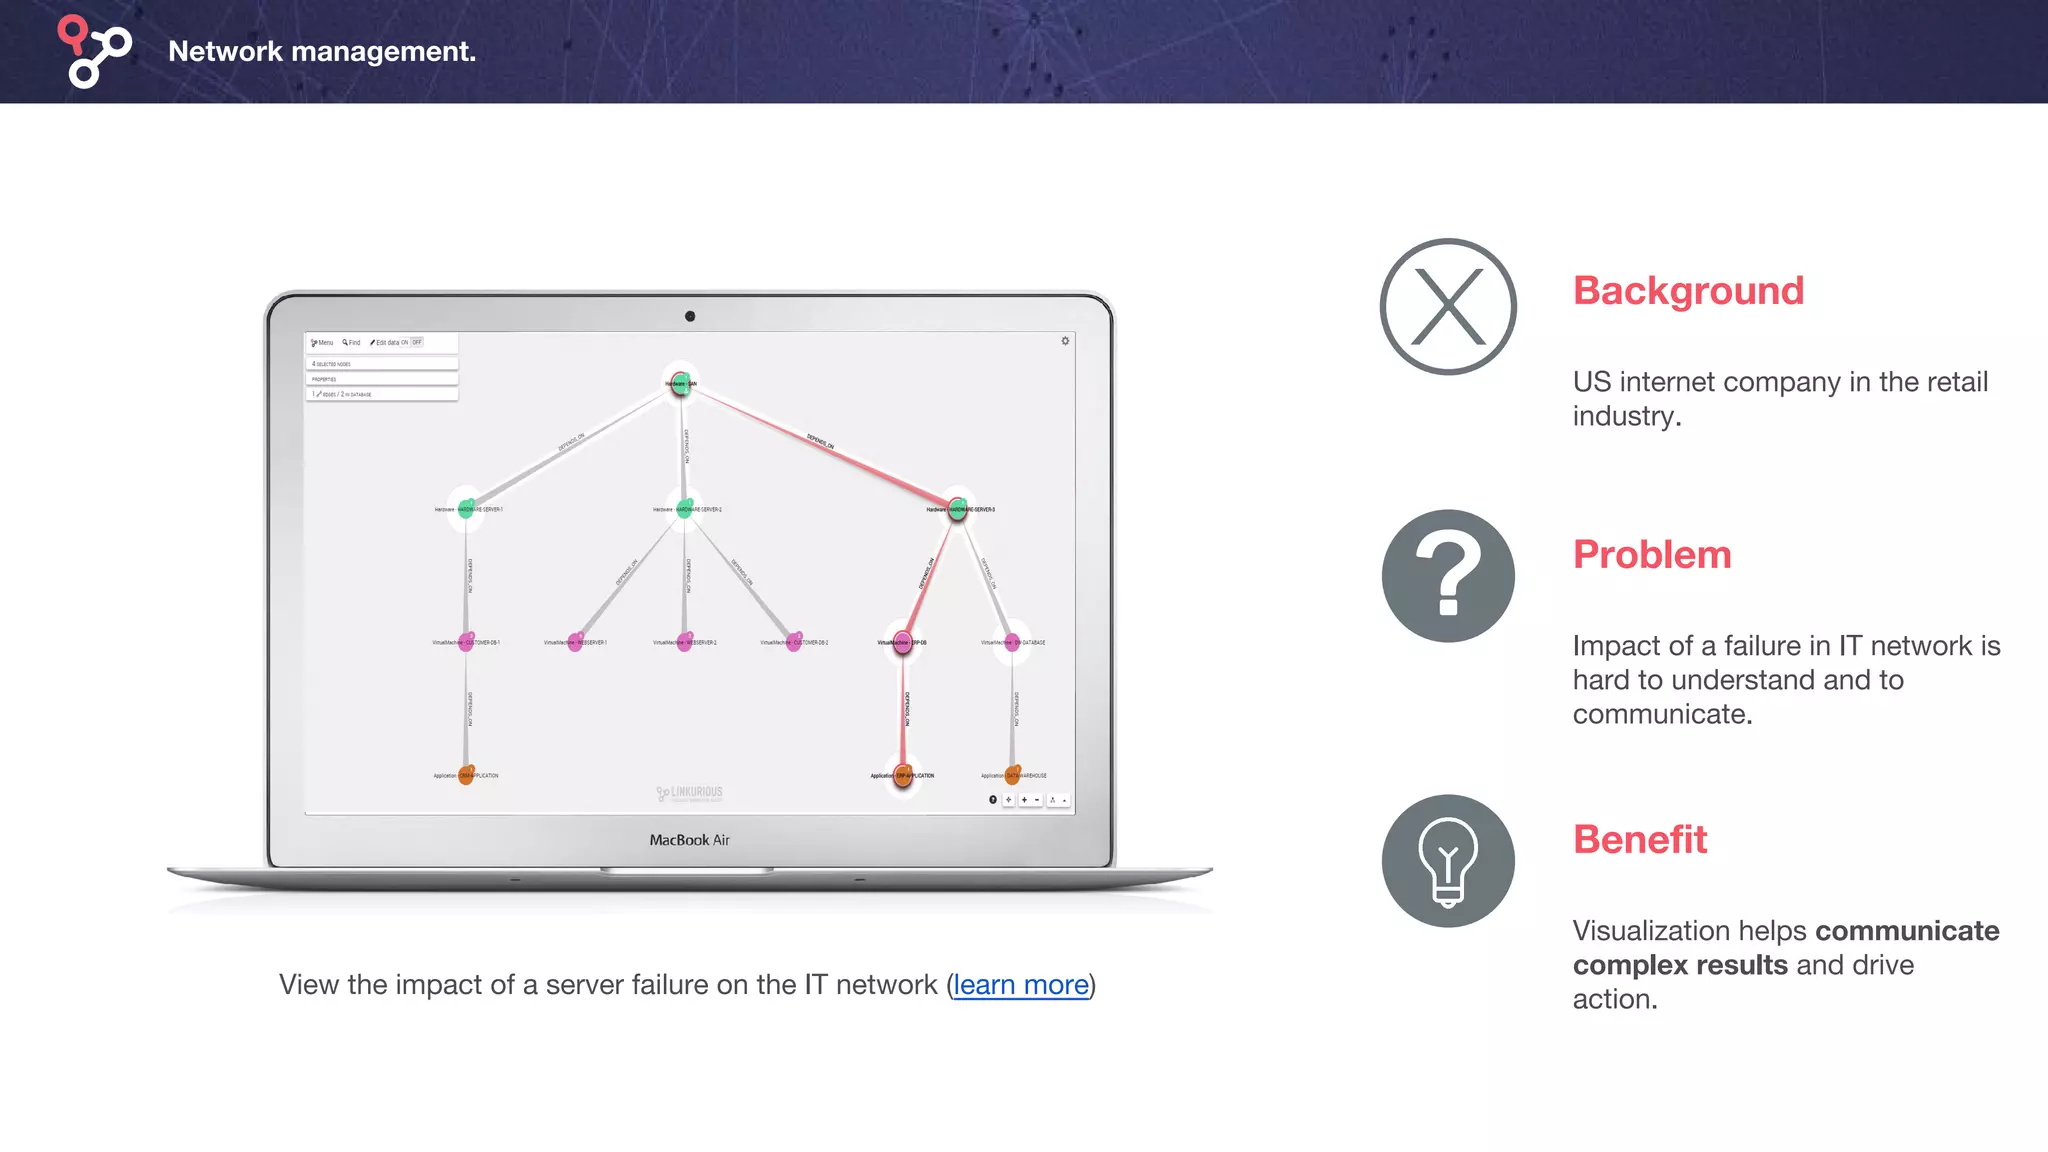
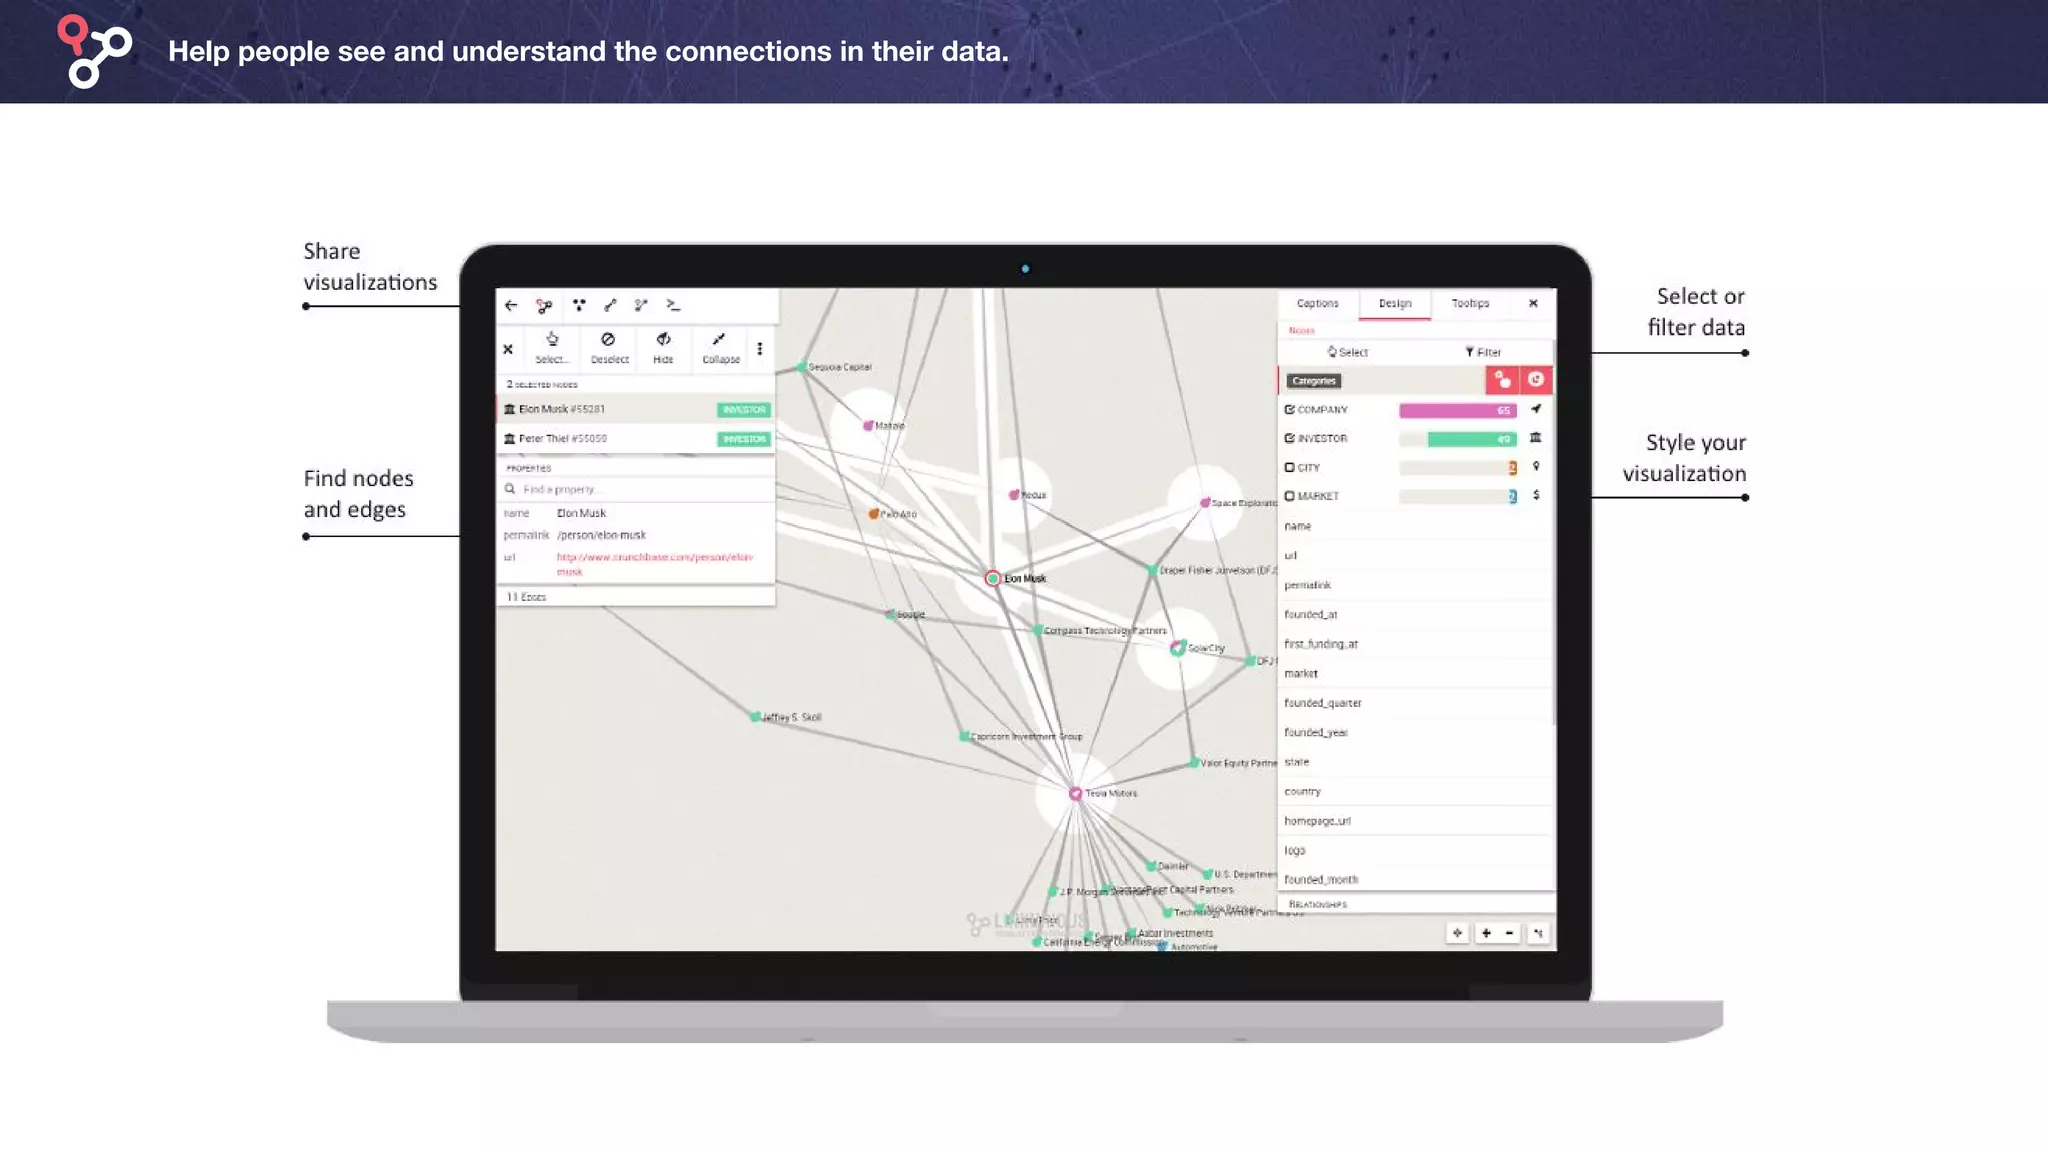
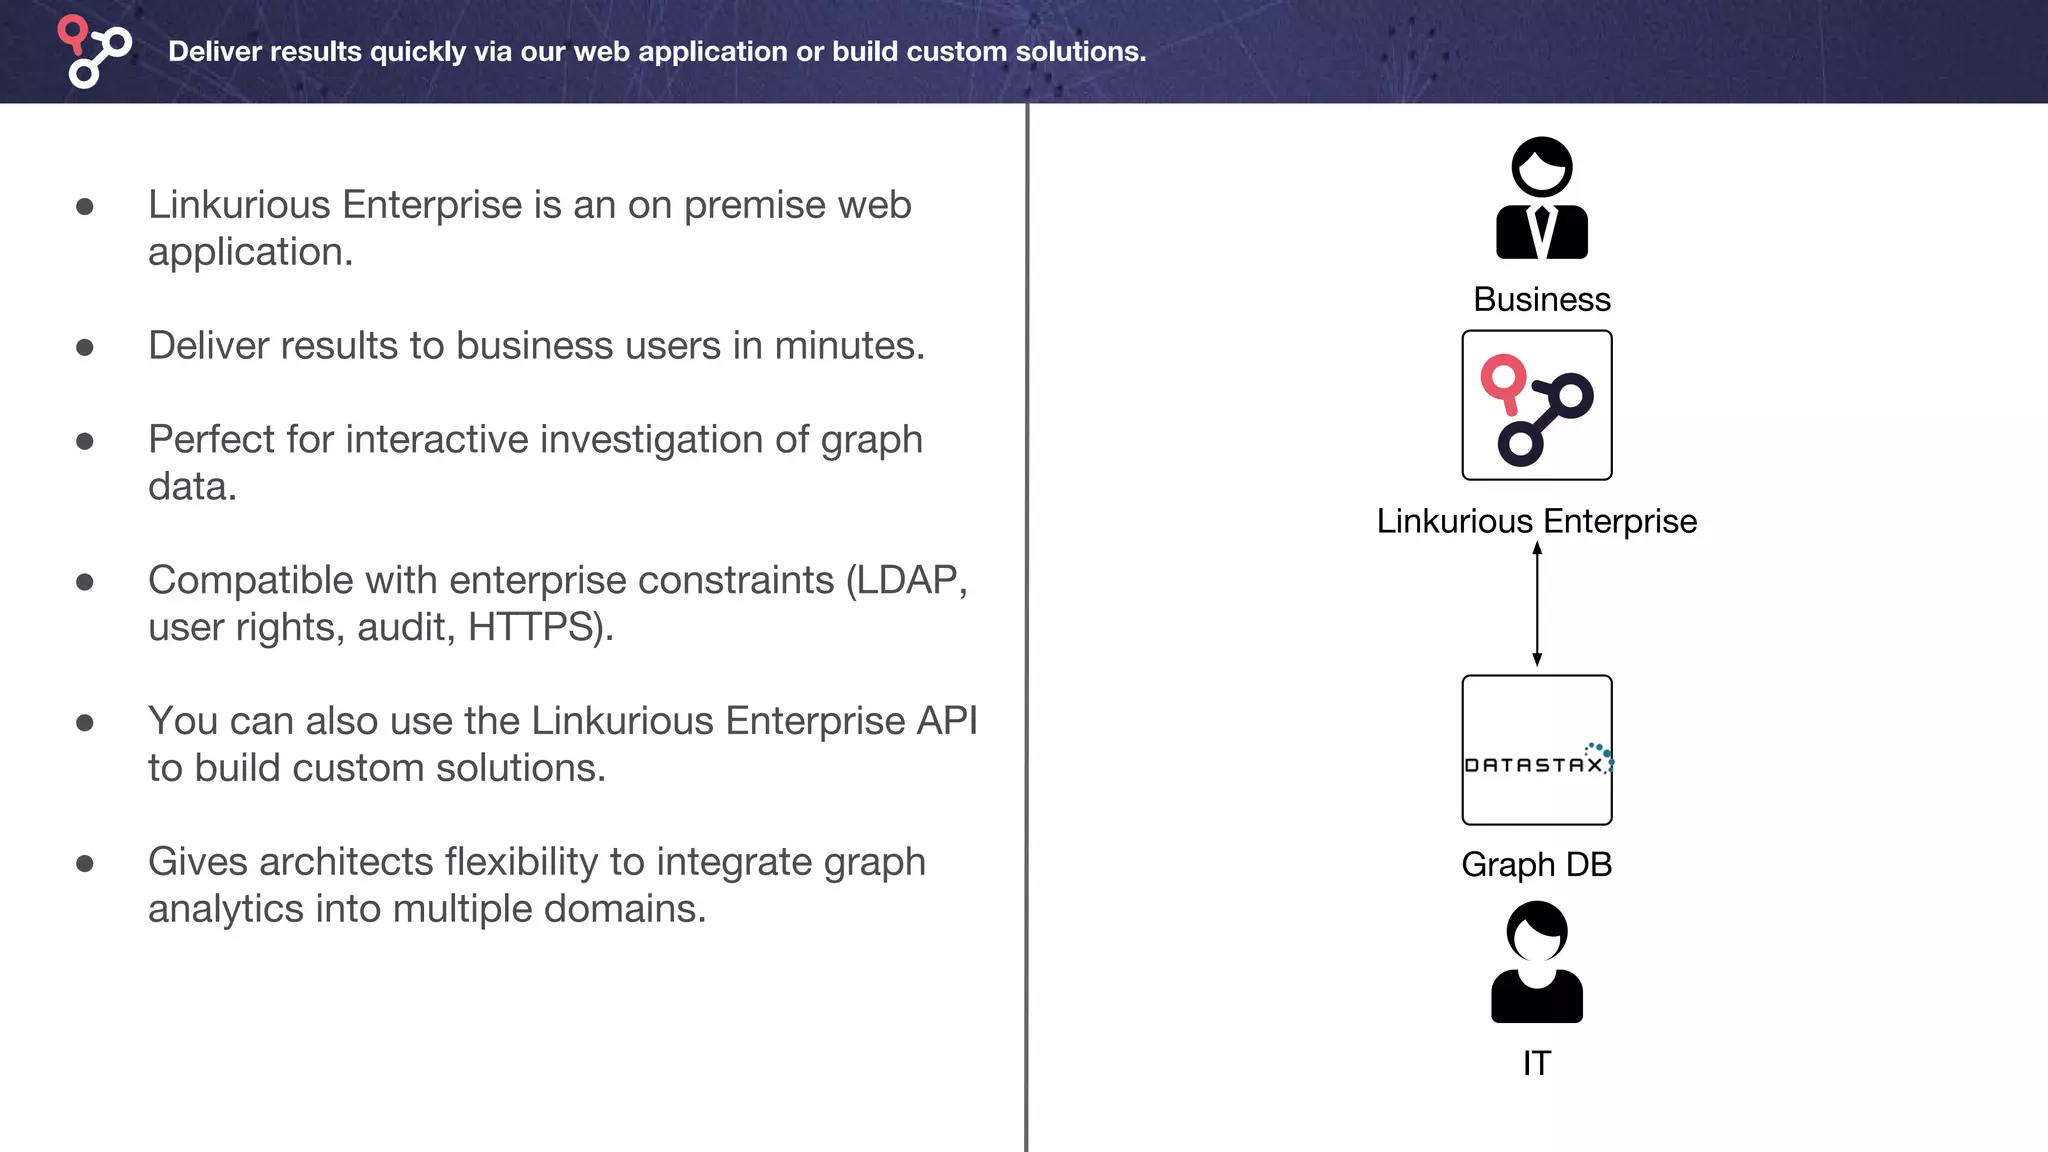
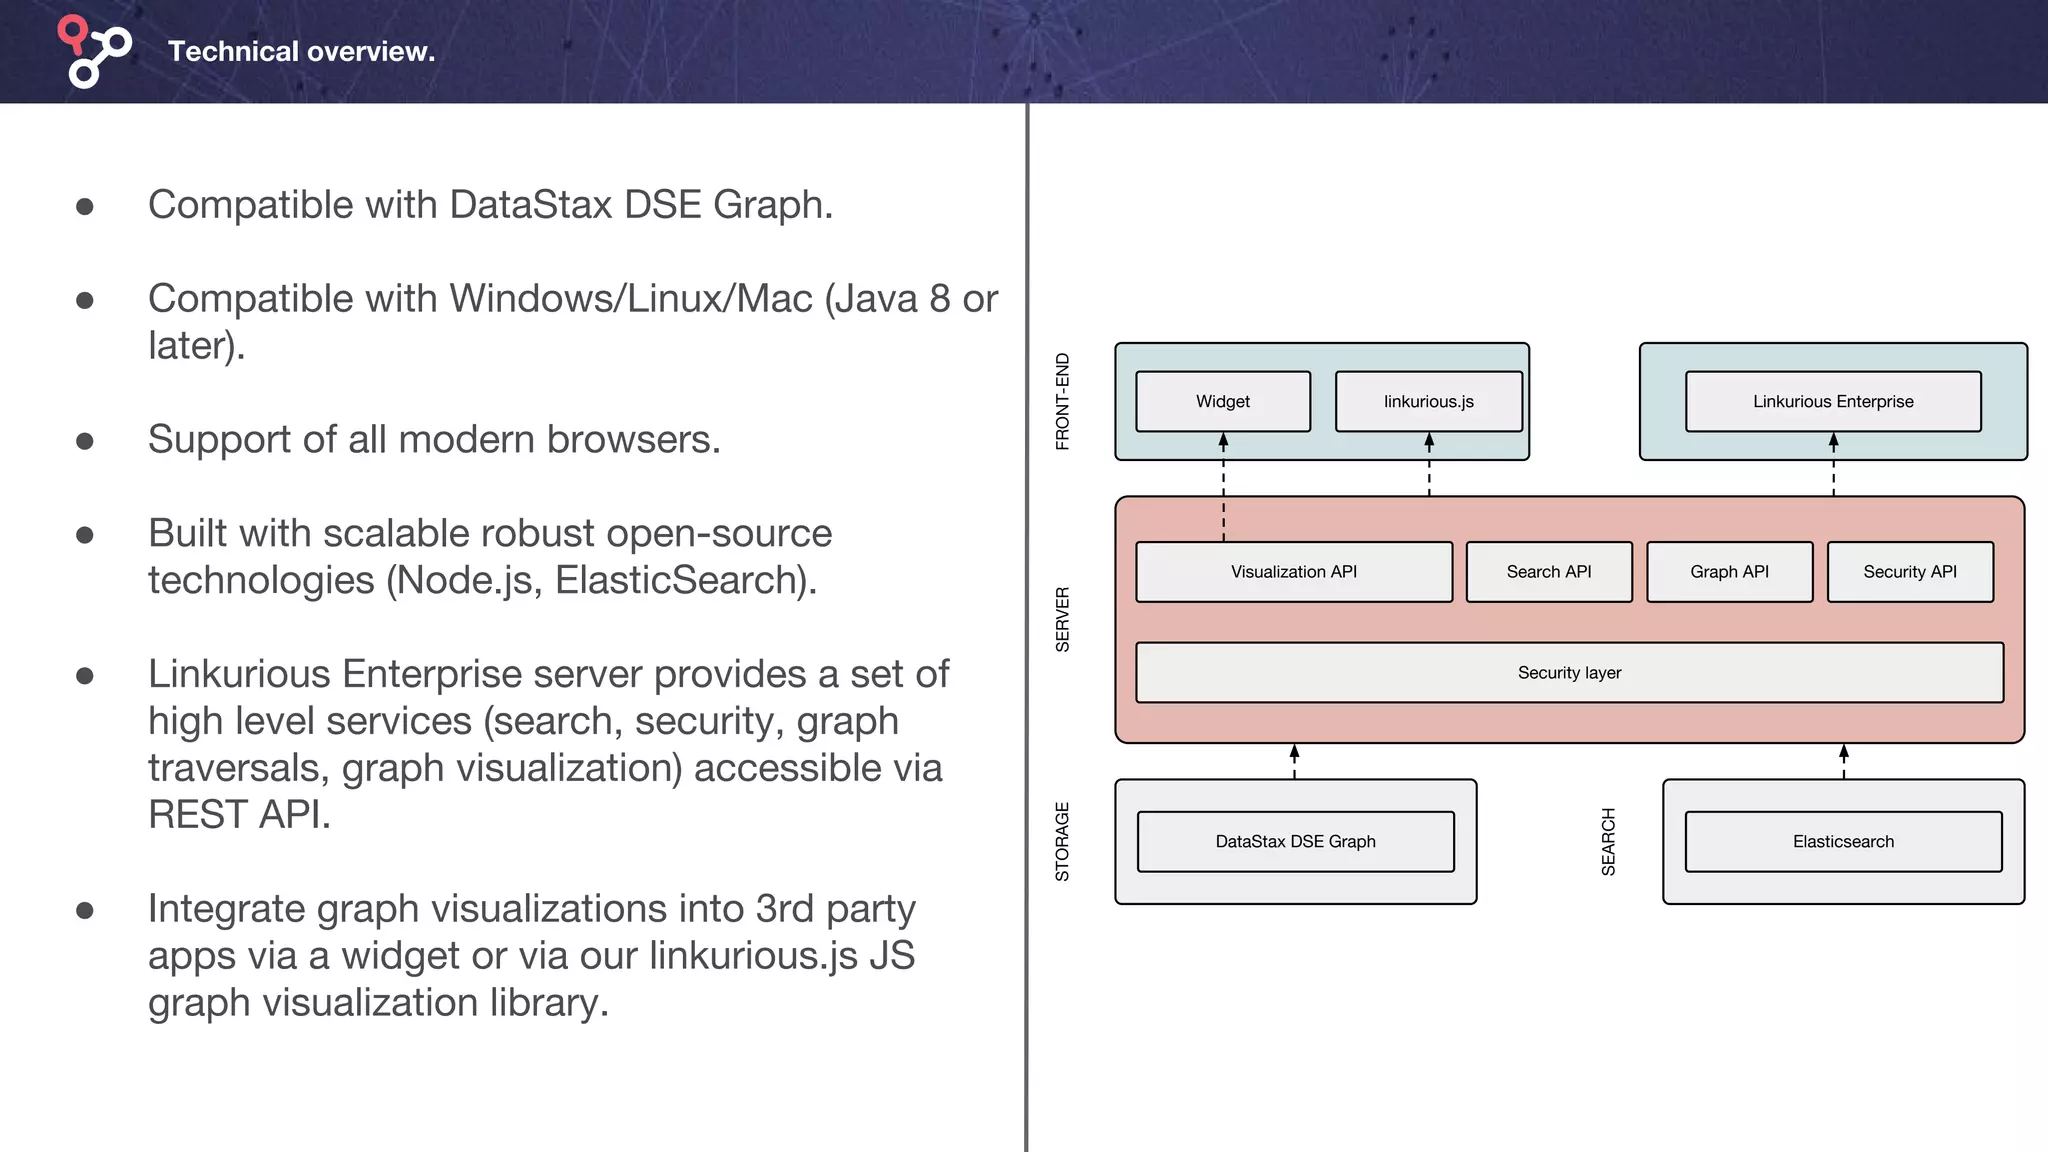
● Linkurious is a graph visualization startup.
● We help companies understand graph data.
● Linkurious Enterprise, an enterprise-ready
graph visualization web app + API.
● 200+ customers (NASA, French Ministry of
Finances, Cisco).
● Official DataStax partner.
DSE graph unlock
connected data.
● The graph schema is a natural fit for highly
connected, evolving datasets.
● Fast traversal performances.
● Languages dedicated to graph queries
(Gremlin).
● Cybersecurity, medical research, fraud, anti-
terrorism, network management, etc.
But current tools are
not adapted.
● Traditional BI and data visualizations solutions
are not compatible with graph databases.
● Representing data as pie charts and histograms
doesn’t provide insights into connections.
● There are graph tools designed for
developers/data scientists but no tools for
business users.
We make graphs easy
to understand.
● Easy to use interfaces designed for non
technical users.
● Ability to uncover hidden relationships, explore
connections, extract insights.
● Support of DataStax DSE Graph.
Anti-money laundering investigation: Swiss Leaks.
Background
Analysing the bank accounts and companies connected to Emilio Botin, Former
Executive Chairman of Spain’s Grupo Santander (learn more)
ICIJ is an international consortium
of data journalists.
Problem
Analyse financial records from
HSBC to find evidence of tax
fraud or corruption.
Benefit
The journalists are able to
analyse data to verify
wrongdoing quickly and
accurately.
Knowledge management @ NASA.
Background
Navigating the network of authors, documents, organizations and concepts
linked to “High pressure shutoff valve” (learn more)
NASA is the United States
government agency responsible
for the civilian space program.
Problem
Leverage an existing lessons
learned database to improve the
success of projects.
Benefit
More natural way to search
content results in better insights
derived from data.
Network management.
Background
View the impact of a server failure on the IT network (learn more)
US internet company in the retail
industry.
Problem
Impact of a failure in IT network is
hard to understand and to
communicate.
Benefit
Visualization helps communicate
complex results and drive
action.
Help people see and understand the connections in their data.
Deliver results quickly via our web application or build custom solutions.
● Linkurious Enterprise is an on premise web
application.
● Deliver results to business users in minutes.
● Perfect for interactive investigation of graph
data.
● Compatible with enterprise constraints (LDAP,
user rights, audit, HTTPS).
● You can also use the Linkurious Enterprise API
to build custom solutions.
● Gives architects flexibility to integrate graph
analytics into multiple domains.
Business
Graph DB
Linkurious Enterprise
IT
● Compatible with DataStax DSE Graph.
● Compatible with Windows/Linux/Mac (Java 8 or
later).
● Support of all modern browsers.
● Built with scalable robust open-source
technologies (Node.js, ElasticSearch).
● Linkurious Enterprise server provides a set of
high level services (search, security, graph
traversals, graph visualization) accessible via
REST API.
● Integrate graph visualizations into 3rd party
apps via a widget or via our linkurious.js JS
graph visualization library.
Technical overview.
STORAGESERVER
Visualization API Search API Graph API
Security layer
DataStax DSE Graph
FRONT-END
Widget linkurious.js
Security API
SEARCH
Elasticsearch
Linkurious Enterprise
Conclusion.
Question?

Finding the insights hidden in your graph data

  • 1.
    Finding the insights hiddenin your graph data. SAS founded in 2013 in Paris | http://linkurio.us | @linkurious
  • 2.
    Introduction. ● Linkurious isa graph visualization startup. ● We help companies understand graph data. ● Linkurious Enterprise, an enterprise-ready graph visualization web app + API. ● 200+ customers (NASA, French Ministry of Finances, Cisco). ● Official DataStax partner.
  • 3.
    DSE graph unlock connecteddata. ● The graph schema is a natural fit for highly connected, evolving datasets. ● Fast traversal performances. ● Languages dedicated to graph queries (Gremlin). ● Cybersecurity, medical research, fraud, anti- terrorism, network management, etc.
  • 4.
    But current toolsare not adapted. ● Traditional BI and data visualizations solutions are not compatible with graph databases. ● Representing data as pie charts and histograms doesn’t provide insights into connections. ● There are graph tools designed for developers/data scientists but no tools for business users.
  • 5.
    We make graphseasy to understand. ● Easy to use interfaces designed for non technical users. ● Ability to uncover hidden relationships, explore connections, extract insights. ● Support of DataStax DSE Graph.
  • 6.
    Anti-money laundering investigation:Swiss Leaks. Background Analysing the bank accounts and companies connected to Emilio Botin, Former Executive Chairman of Spain’s Grupo Santander (learn more) ICIJ is an international consortium of data journalists. Problem Analyse financial records from HSBC to find evidence of tax fraud or corruption. Benefit The journalists are able to analyse data to verify wrongdoing quickly and accurately.
  • 7.
    Knowledge management @NASA. Background Navigating the network of authors, documents, organizations and concepts linked to “High pressure shutoff valve” (learn more) NASA is the United States government agency responsible for the civilian space program. Problem Leverage an existing lessons learned database to improve the success of projects. Benefit More natural way to search content results in better insights derived from data.
  • 8.
    Network management. Background View theimpact of a server failure on the IT network (learn more) US internet company in the retail industry. Problem Impact of a failure in IT network is hard to understand and to communicate. Benefit Visualization helps communicate complex results and drive action.
  • 9.
    Help people seeand understand the connections in their data.
  • 10.
    Deliver results quicklyvia our web application or build custom solutions. ● Linkurious Enterprise is an on premise web application. ● Deliver results to business users in minutes. ● Perfect for interactive investigation of graph data. ● Compatible with enterprise constraints (LDAP, user rights, audit, HTTPS). ● You can also use the Linkurious Enterprise API to build custom solutions. ● Gives architects flexibility to integrate graph analytics into multiple domains. Business Graph DB Linkurious Enterprise IT
  • 11.
    ● Compatible withDataStax DSE Graph. ● Compatible with Windows/Linux/Mac (Java 8 or later). ● Support of all modern browsers. ● Built with scalable robust open-source technologies (Node.js, ElasticSearch). ● Linkurious Enterprise server provides a set of high level services (search, security, graph traversals, graph visualization) accessible via REST API. ● Integrate graph visualizations into 3rd party apps via a widget or via our linkurious.js JS graph visualization library. Technical overview. STORAGESERVER Visualization API Search API Graph API Security layer DataStax DSE Graph FRONT-END Widget linkurious.js Security API SEARCH Elasticsearch Linkurious Enterprise
  • 12.