Downloaded 432 times
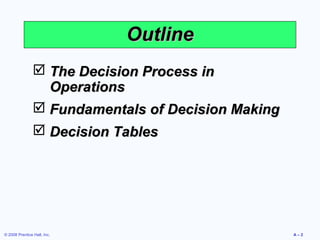
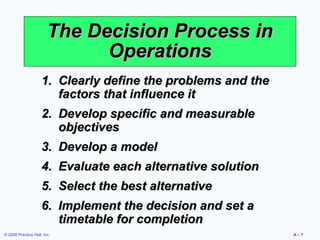
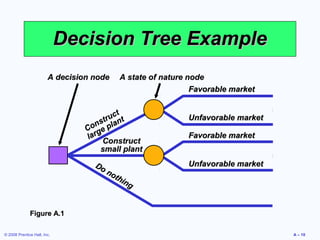
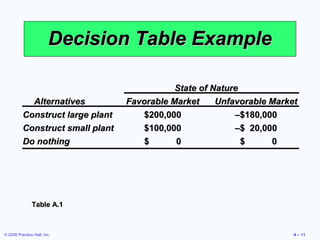
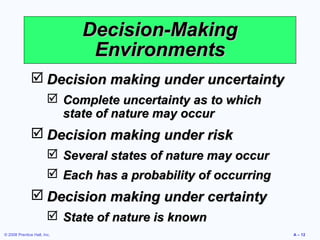
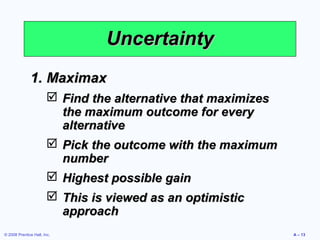
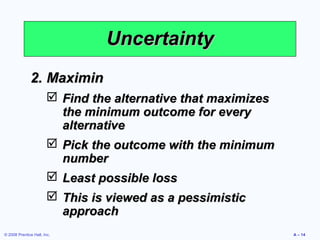


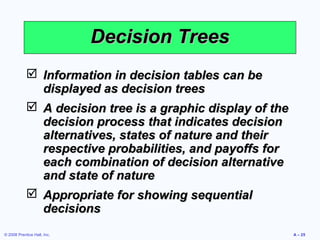


This document outlines the key topics and tools covered in a module on operations management decision-making. It includes an introduction to decision trees, decision tables, and the three types of decision-making environments: uncertainty, risk, and certainty. Formulas for expected monetary value, maximum, minimum and equally likely choices under uncertainty are provided. The document concludes with learning objectives and examples of using decision trees to evaluate sequential and ethical decisions.