Downloaded 329 times
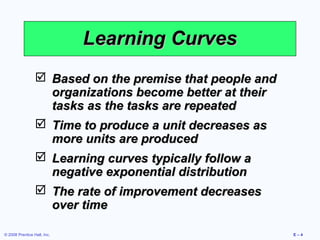
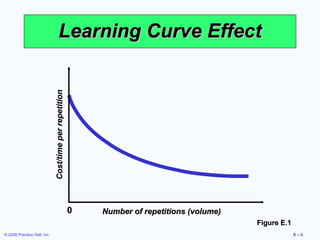
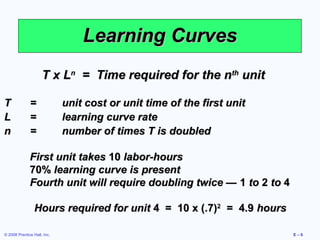
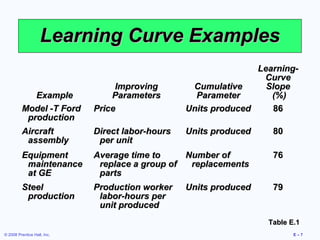
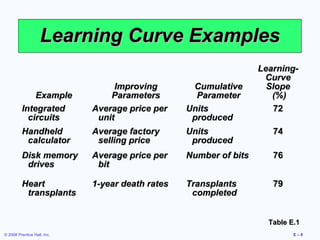
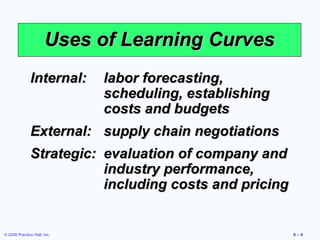
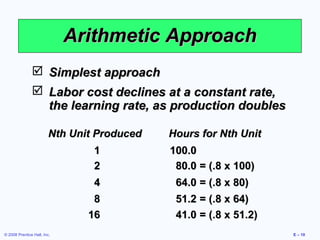
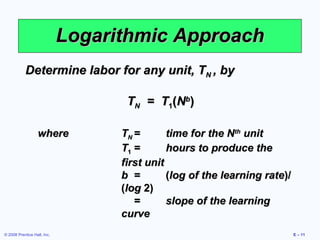
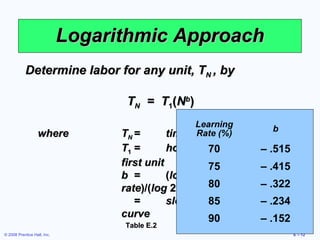
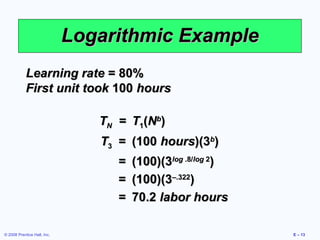
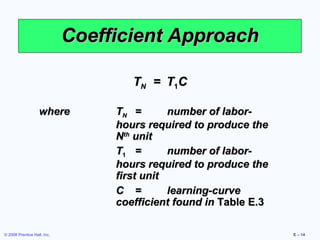
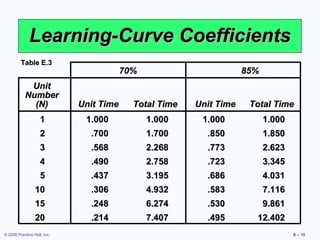
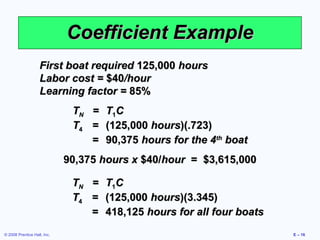
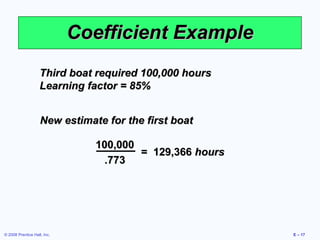

This document discusses learning curves in operations management. It contains 3 learning objectives: 1) define a learning curve, 2) use arithmetic concepts to estimate times, and 3) compute learning curve effects using logarithmic and learning coefficient approaches. It then provides an outline of topics, examples of industries with learning curves, and explanations of the arithmetic, logarithmic, and learning coefficient approaches for estimating costs and times with experience.


