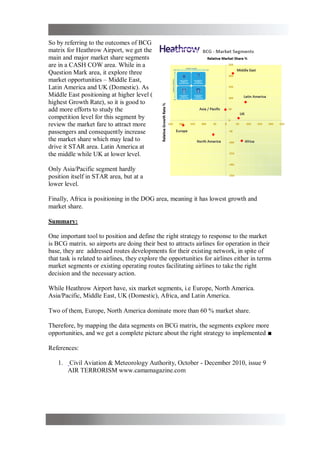
MARKET Segment Analysis Using BCG matrix
Most of Airlines and Airports are seeking for the right strategy to evaluate the
competitive environment. while some of them using BCG matrix as effective tool to
define and develop the right decision, as reinforcing, sustaining, surviving or drawing
out of the market.
In the beginning of 1970 BCG – Boston Consulting Group developed different
patterns of working units for the bigger production lines, they developed BCG- matrix
addressing GROWTH RATE and MARKET SHARE.
So addressing Airline Industry for different working units as airlines or airport
authorities, BCG concept can be mapping on a low –
high graphic scale. While airports try to compare their
performance with one to the others. They are
implementing open sky policy, facilitating procedures
to improve their share in the region, and consequently it
will be easy to compare analysis and conclude for
positioning the airports in competitive environments.
Accordingly, decisions are hold and solution are
delivered to support the right strategy to improve the
quality of service and performance. Therefore, in
aviation industry these strategies reflects the
competitive situation for regions, operating routes and
segments, usually for airlines activities at airports, such
as Traffic, Cycles and Freight.
By: Eng. Rana M. Salem
Researcher
Therefore, matrix BCG matrix is the most effective and well known as it is mentioned
before. The method is a tool to manage and develop decision; it is defining the right
strategy in terms of growth rates and market share. It is established based on a
production theory. Therefore, BCG matrix can be define the airport market situation
by one of these possible outcomes:
1- STARS: High status growth, Bigger Market Share find the priorities for doing
productivities of unit.
2- CASH COW: Low status growth, work. Beside to ensure a long-term
performance, Bigger Market Share. Company should secure all the productive
units.
3- DOGS: Low status growth, Small Market Share.
4- QUESTION MARK: High statuses also for low growth rate of productive
units for the growth, Small Market Share. Needs of cash flow.
Case Study – Heathrow Airport:
Heathrow Airport is ranking among top ten airports in world by traffic volume. It is
well defined as the Main Gate to North America. Moreover, that can be noted by
study the segments for North America and Europe as shown in the table.
Analysis:
Heathrow Airport have six market
segments, i.e Europe, North America.
Asia/Pacific, Middle East, UK
(Domestic), Africa, and Latin America.
According to the Pie Chart analysis for
the various market segments of
Heathrow Airport, the majority is
Europe followed by North America.
Since Heathrow airport is the Hub of
BA British Airways, so more than 60 %
is only a share of two-traffic segments
i.e Europe and North America, i.e why it is called the main gate to North America.
The other traffic segments are Asia/Pacific, Middle East, UK (Domestic), Africa, and
Latin America.
By using the concept of BCG matrix for 2017, the data can be defined by the right
strategy for improving airport operation. Off course, the traffic is related to the
operated airlines (BA and Virgin Atlantic), while Heathrow Airport Authority support
and facilitate the services for Airlines.
So by referring to the outcomes of BCG
matrix for Heathrow Airport, we get the
main and major market share segments
are in a CASH COW area. While in a
Question Mark area, it explore three
market opportunities – Middle East,
Latin America and UK (Domestic). As
Middle East positioning at higher level (
highest Growth Rate), so it is good to
add more efforts to study the
competition level for this segment by
review the market fare to attract more
passengers and consequently increase
the market share which may lead to
drive it STAR area. Latin America at
the middle while UK at lower level.
Only Asia/Pacific segment hardly
position itself in STAR area, but at a
lower level.
Finally, Africa is positioning in the DOG area, meaning it has lowest growth and
market share.
Summary:
One important tool to position and define the right strategy to response to the market
is BCG matrix. so airports are doing their best to attracts airlines for operation in their
base, they are addressed routes developments for their existing network, in spite of
that task is related to airlines, they explore the opportunities for airlines either in terms
market segments or existing operating routes facilitating airlines to take the right
decision and the necessary action.
While Heathrow Airport have, six market segments, i.e Europe, North America.
Asia/Pacific, Middle East, UK (Domestic), Africa, and Latin America.
Two of them, Europe, North America dominate more than 60 % market share.
Therefore, by mapping the data segments on BCG matrix, the segments explore more
opportunities, and we get a complete picture about the right strategy to implemented ■
References:
1. Civil Aviation & Meteorology Authority, October - December 2010, issue 9
AIR TERRORISM www.camamagazine.com

Heathrow Airport - BCG case study

  • 1.
    MARKET Segment AnalysisUsing BCG matrix Most of Airlines and Airports are seeking for the right strategy to evaluate the competitive environment. while some of them using BCG matrix as effective tool to define and develop the right decision, as reinforcing, sustaining, surviving or drawing out of the market. In the beginning of 1970 BCG – Boston Consulting Group developed different patterns of working units for the bigger production lines, they developed BCG- matrix addressing GROWTH RATE and MARKET SHARE. So addressing Airline Industry for different working units as airlines or airport authorities, BCG concept can be mapping on a low – high graphic scale. While airports try to compare their performance with one to the others. They are implementing open sky policy, facilitating procedures to improve their share in the region, and consequently it will be easy to compare analysis and conclude for positioning the airports in competitive environments. Accordingly, decisions are hold and solution are delivered to support the right strategy to improve the quality of service and performance. Therefore, in aviation industry these strategies reflects the competitive situation for regions, operating routes and segments, usually for airlines activities at airports, such as Traffic, Cycles and Freight. By: Eng. Rana M. Salem Researcher
  • 2.
    Therefore, matrix BCGmatrix is the most effective and well known as it is mentioned before. The method is a tool to manage and develop decision; it is defining the right strategy in terms of growth rates and market share. It is established based on a production theory. Therefore, BCG matrix can be define the airport market situation by one of these possible outcomes: 1- STARS: High status growth, Bigger Market Share find the priorities for doing productivities of unit. 2- CASH COW: Low status growth, work. Beside to ensure a long-term performance, Bigger Market Share. Company should secure all the productive units. 3- DOGS: Low status growth, Small Market Share. 4- QUESTION MARK: High statuses also for low growth rate of productive units for the growth, Small Market Share. Needs of cash flow. Case Study – Heathrow Airport: Heathrow Airport is ranking among top ten airports in world by traffic volume. It is well defined as the Main Gate to North America. Moreover, that can be noted by study the segments for North America and Europe as shown in the table. Analysis: Heathrow Airport have six market segments, i.e Europe, North America. Asia/Pacific, Middle East, UK (Domestic), Africa, and Latin America. According to the Pie Chart analysis for the various market segments of Heathrow Airport, the majority is Europe followed by North America. Since Heathrow airport is the Hub of BA British Airways, so more than 60 % is only a share of two-traffic segments i.e Europe and North America, i.e why it is called the main gate to North America. The other traffic segments are Asia/Pacific, Middle East, UK (Domestic), Africa, and Latin America. By using the concept of BCG matrix for 2017, the data can be defined by the right strategy for improving airport operation. Off course, the traffic is related to the operated airlines (BA and Virgin Atlantic), while Heathrow Airport Authority support and facilitate the services for Airlines.
  • 3.
    So by referringto the outcomes of BCG matrix for Heathrow Airport, we get the main and major market share segments are in a CASH COW area. While in a Question Mark area, it explore three market opportunities – Middle East, Latin America and UK (Domestic). As Middle East positioning at higher level ( highest Growth Rate), so it is good to add more efforts to study the competition level for this segment by review the market fare to attract more passengers and consequently increase the market share which may lead to drive it STAR area. Latin America at the middle while UK at lower level. Only Asia/Pacific segment hardly position itself in STAR area, but at a lower level. Finally, Africa is positioning in the DOG area, meaning it has lowest growth and market share. Summary: One important tool to position and define the right strategy to response to the market is BCG matrix. so airports are doing their best to attracts airlines for operation in their base, they are addressed routes developments for their existing network, in spite of that task is related to airlines, they explore the opportunities for airlines either in terms market segments or existing operating routes facilitating airlines to take the right decision and the necessary action. While Heathrow Airport have, six market segments, i.e Europe, North America. Asia/Pacific, Middle East, UK (Domestic), Africa, and Latin America. Two of them, Europe, North America dominate more than 60 % market share. Therefore, by mapping the data segments on BCG matrix, the segments explore more opportunities, and we get a complete picture about the right strategy to implemented ■ References: 1. Civil Aviation & Meteorology Authority, October - December 2010, issue 9 AIR TERRORISM www.camamagazine.com