This document provides guidance on conducting a hazards and operability (HAZOP) study. It describes the key steps, which include:
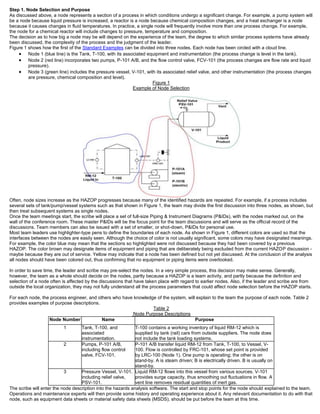
1. Defining nodes within the process to focus the analysis. Nodes represent sections where conditions undergo significant change.
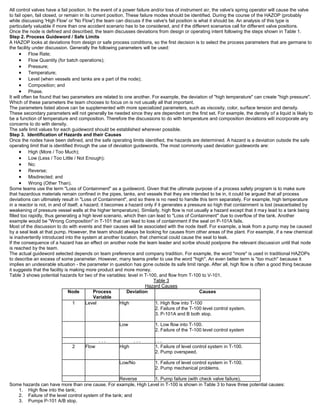
2. Identifying process parameters like flow, pressure, and temperature for each node and establishing safe operating limits.
3. Using guidewords like "high", "low", and "no" to identify potential deviations and associated hazards within each node.
4. Discussing how each hazard could be "announced" or detected. If no detection exists, additional instrumentation may be recommended.
5. Determining consequences of hazards with and without existing safeguards.
Hazard and Operability Study (HAZOP) | Gaurav Singh RajputGaurav Singh Rajput
Hazard and operability study | hazop | method of conduction | steps involved by gauravsinghrajput | gauravkrsrajput I Gaurav Singh Rajput I gauravsinghrajput I gauravkrsrajput
Hazard and Operability Study (HAZOP) | Gaurav Singh RajputGaurav Singh Rajput
Hazard and operability study | hazop | method of conduction | steps involved by gauravsinghrajput | gauravkrsrajput I Gaurav Singh Rajput I gauravsinghrajput I gauravkrsrajput
Basic understanding of HAZOP it covers:
-Basic understanding of HAZOP
-HAZOP requirements
-How it works
-Case study
-HAZOP team
-Advantage & disadvantage
1. HAZOP by DAMO
2. What is HAZOP? HAZOP is an acronym that stands for HAZARD and OPERABILITY Study It was pioneered at ICI (Imperial Chemical Industries, UK) during the late 1960s
3. What is HAZOP? ICI no longer exists today in its original form today (it was taken over by AkzoNobel) but the HAZOP technique that it pioneered survives, thrives and grows in importance every day. HAZOP is mainly a Risk Assessment Technique HAZOP is a Qualitative technique
4. Where is HAZOP used? HAZOP is used in a wide variety of industries and sectors including but not limited to •Chemicals & Petrochemicals •Oil & Gas including refining •Power Generation •Mining & Metals •Pharmaceutical manufacturing
5. How is HAZOP Structured? HAZOP is structured in such a way as to evaluate the design intent of a particular part of a plant, called as a node and then use Guide Words to evaluate deviations from the intent
6. HAZOP Example For example a HAZOP node may be a day tank that pumps a reactant to the plant every day. The design intent is “transfer liquid from tank to plant” Possible Deviations from intent are evaluated using Guide Words such as Less Than, More Than, Reverse, No and others.
7. HAZOP Example Thus possible deviations from the design intent would be Liquid Quantity transferred is Less than intented Liquid flows in Reverse direction (from plant to tank) and so on until all possible devaitions are analyzed
8. HAZOP Example Now every deviation is analysed and Mitigated via adequate measures Mitigations may be multiple for each deviation All nodes need to be analysed in this manner
9. HAZOP Types There are different kinds of HAZOPs •Conceptual •Greenfield •Brownfield •Decommissioning •CHAZOP (Computer HAZOP)
10. HAZOP Team HAZOP is a team effort with a HAZOP Leader, a HAZOP Scribe who documents the analysis either manually (with an Excel sheet) or using a documentation software and Team members who contribute to the analysis
Pressure Relief Systems
BACKGROUND TO RELIEF SYSTEM DESIGN Vol.1 of 6
The Guide has been written to advise those involved in the design and engineering of pressure relief systems. It takes the user from the initial identification of potential causes of overpressure or under pressure through the process design of relief systems to the detailed mechanical design. "Hazard Studies" and quantitative hazards analysis are not described; these are seen as complementary activities. Typical users of the Guide will use some Parts in detail and others in overview.
Pressure Safety Valve Sizing - API 520/521/526Vijay Sarathy
No chemical process facility is immune to the risk of overpressure to avoid dictating the necessity for overpressure protection. For every situation that demands safe containment of process gas, it becomes an obligation for engineers to equally provide pressure relieving and flaring provisions wherever necessary. The levels of protection are hierarchical, starting with designing an inherently safe process to avoid overpressure followed by providing alarms for operators to intervene and Emergency Shutdown provisions through ESD and SIL rated instrumentation. Beyond these design and instrument based protection measures, the philosophy of containment and abatement steps such as pressure relieving devices, flares, physical dikes and Emergency Response Services is employed
Basic understanding of HAZOP it covers:
-Basic understanding of HAZOP
-HAZOP requirements
-How it works
-Case study
-HAZOP team
-Advantage & disadvantage
The explosion hazard in urea process (1)Prem Baboo
In Urea plant passivation air is used in reactor, stripper and downstream of the all equipments. The reactor liner material used Titanium, Zirconium, SS 316L (urea grade), 2RE-69 and duplex material .except Titanium and Zirconium all stainless steel required more passivation air. In CO2 some quantity of Hydrogen is present about 0.14% to 0.2% . The passivation oxygen and Hydrogen makes explosive mixture. To avoid a fire or explosion in a process vessel is to introduce inert (noncombustible) gases in such a way that there is never a mixture with a combustible concentration in exit of MP vent. Mixtures of fuel, oxygen, and inert gases are not combustible over the entire range of composition. In CO2 stripping process the HP scrubber is the risky vessel and this vessel consisting blanketing sphere, Heat exchanger part and a scrubbing part. With help of triangular diagram that shows the shape of the combustible/noncombustible regions for a typical gaseous mixture of fuel, oxygen, and inert at specified temperature and pressure. Present article how to avoid that combustible rang and how to tackle that gases in CO2 & ammonia stripping process.
Flash Steam and Steam Condensates in Return LinesVijay Sarathy
In power plants, boiler feed water is subjected to heat thereby producing steam which acts as a motive force for a steam turbine. The steam upon doing work loses energy to form condensate and is recycled/returned back to reduce the required make up boiler feed water (BFW).
Recycling steam condensate poses its own challenges. Flash Steam is defined as steam generated from steam condensate due to a drop in pressure. When high pressure and temperature condensate passes through process elements such as steam traps or pressure reducing valves to lose pressure, the condensate flashes to form steam. Greater the drop in pressure, greater is the flash steam generated. This results in a two phase flow in the condensate return lines.
This presentation is a brief descriptive procedure of simulating in aspen flare system analyser (otherwise called as flarenet). It gives a step by step instructions to develop a flare network scheme in the simulator
Hazop Fundamentals Online Training iFluidsJohn Kingsley
This course is designed to provide the basics of HAZOP study technique, its outcome and also to perform/review HAZOP report.
Familiarity with HAZOP Terminologies, Methodology, Brief Ideas for taking part /Involve in HAZOP Session. https://trainings.ifluids.com/
Ammonia Plant Technology
Pre-Commissioning Best Practices
Piping and Vessels Flushing and Cleaning Procedure
CONTENTS
1 Scope
2 Aim/purpose
3 Responsibilities
4 Procedure
4.1 Main cleaning methods
4.1.1 Mechanical cleaning
4.1.2 Cleaning with air
4.1.3 Cleaning with steam (for steam networks only)
4.1.4 Cleaning with water
4.2 Choice of the cleaning method
4.3 Cleaning preparation
4.4 Protection of the devices included in the network
4.5 Protection of devices in the vicinity of the network
4.6 Water flushing procedure
4.6.1 Specific problems of water flushing
4.6.2 Preparation for water flushing
4.6.3 Performing a water flush
4.6.4 Cleanliness criteria
4.7 Air blowing procedure
4.7.1 Specific problems of air blowing
4.7.2 Preparation for air blowing
4.7.3 Performing air blowing
4.7.4 Cleanliness checks
4.8 Steam blowing procedure
4.8.1 Specific problems of steam blowing
4.8.2 Preparation for steam blowing
4.8.3 Performing steam blowing
4.8.4 Cleanliness checks
4.9 Chemical cleaning procedure
4.9.1 Specific problems of cleaning with a chemical solution
4.9.2 Preparation for chemical cleaning
4.9.3 Performing a chemical cleaning
4.9.4 Cleanliness criteria
4.10 Re-assembly - general guideline
4.11 Preservation of flushed piping
Basic understanding of HAZOP it covers:
-Basic understanding of HAZOP
-HAZOP requirements
-How it works
-Case study
-HAZOP team
-Advantage & disadvantage
1. HAZOP by DAMO
2. What is HAZOP? HAZOP is an acronym that stands for HAZARD and OPERABILITY Study It was pioneered at ICI (Imperial Chemical Industries, UK) during the late 1960s
3. What is HAZOP? ICI no longer exists today in its original form today (it was taken over by AkzoNobel) but the HAZOP technique that it pioneered survives, thrives and grows in importance every day. HAZOP is mainly a Risk Assessment Technique HAZOP is a Qualitative technique
4. Where is HAZOP used? HAZOP is used in a wide variety of industries and sectors including but not limited to •Chemicals & Petrochemicals •Oil & Gas including refining •Power Generation •Mining & Metals •Pharmaceutical manufacturing
5. How is HAZOP Structured? HAZOP is structured in such a way as to evaluate the design intent of a particular part of a plant, called as a node and then use Guide Words to evaluate deviations from the intent
6. HAZOP Example For example a HAZOP node may be a day tank that pumps a reactant to the plant every day. The design intent is “transfer liquid from tank to plant” Possible Deviations from intent are evaluated using Guide Words such as Less Than, More Than, Reverse, No and others.
7. HAZOP Example Thus possible deviations from the design intent would be Liquid Quantity transferred is Less than intented Liquid flows in Reverse direction (from plant to tank) and so on until all possible devaitions are analyzed
8. HAZOP Example Now every deviation is analysed and Mitigated via adequate measures Mitigations may be multiple for each deviation All nodes need to be analysed in this manner
9. HAZOP Types There are different kinds of HAZOPs •Conceptual •Greenfield •Brownfield •Decommissioning •CHAZOP (Computer HAZOP)
10. HAZOP Team HAZOP is a team effort with a HAZOP Leader, a HAZOP Scribe who documents the analysis either manually (with an Excel sheet) or using a documentation software and Team members who contribute to the analysis
Pressure Relief Systems
BACKGROUND TO RELIEF SYSTEM DESIGN Vol.1 of 6
The Guide has been written to advise those involved in the design and engineering of pressure relief systems. It takes the user from the initial identification of potential causes of overpressure or under pressure through the process design of relief systems to the detailed mechanical design. "Hazard Studies" and quantitative hazards analysis are not described; these are seen as complementary activities. Typical users of the Guide will use some Parts in detail and others in overview.
Pressure Safety Valve Sizing - API 520/521/526Vijay Sarathy
No chemical process facility is immune to the risk of overpressure to avoid dictating the necessity for overpressure protection. For every situation that demands safe containment of process gas, it becomes an obligation for engineers to equally provide pressure relieving and flaring provisions wherever necessary. The levels of protection are hierarchical, starting with designing an inherently safe process to avoid overpressure followed by providing alarms for operators to intervene and Emergency Shutdown provisions through ESD and SIL rated instrumentation. Beyond these design and instrument based protection measures, the philosophy of containment and abatement steps such as pressure relieving devices, flares, physical dikes and Emergency Response Services is employed
Basic understanding of HAZOP it covers:
-Basic understanding of HAZOP
-HAZOP requirements
-How it works
-Case study
-HAZOP team
-Advantage & disadvantage
The explosion hazard in urea process (1)Prem Baboo
In Urea plant passivation air is used in reactor, stripper and downstream of the all equipments. The reactor liner material used Titanium, Zirconium, SS 316L (urea grade), 2RE-69 and duplex material .except Titanium and Zirconium all stainless steel required more passivation air. In CO2 some quantity of Hydrogen is present about 0.14% to 0.2% . The passivation oxygen and Hydrogen makes explosive mixture. To avoid a fire or explosion in a process vessel is to introduce inert (noncombustible) gases in such a way that there is never a mixture with a combustible concentration in exit of MP vent. Mixtures of fuel, oxygen, and inert gases are not combustible over the entire range of composition. In CO2 stripping process the HP scrubber is the risky vessel and this vessel consisting blanketing sphere, Heat exchanger part and a scrubbing part. With help of triangular diagram that shows the shape of the combustible/noncombustible regions for a typical gaseous mixture of fuel, oxygen, and inert at specified temperature and pressure. Present article how to avoid that combustible rang and how to tackle that gases in CO2 & ammonia stripping process.
Flash Steam and Steam Condensates in Return LinesVijay Sarathy
In power plants, boiler feed water is subjected to heat thereby producing steam which acts as a motive force for a steam turbine. The steam upon doing work loses energy to form condensate and is recycled/returned back to reduce the required make up boiler feed water (BFW).
Recycling steam condensate poses its own challenges. Flash Steam is defined as steam generated from steam condensate due to a drop in pressure. When high pressure and temperature condensate passes through process elements such as steam traps or pressure reducing valves to lose pressure, the condensate flashes to form steam. Greater the drop in pressure, greater is the flash steam generated. This results in a two phase flow in the condensate return lines.
This presentation is a brief descriptive procedure of simulating in aspen flare system analyser (otherwise called as flarenet). It gives a step by step instructions to develop a flare network scheme in the simulator
Hazop Fundamentals Online Training iFluidsJohn Kingsley
This course is designed to provide the basics of HAZOP study technique, its outcome and also to perform/review HAZOP report.
Familiarity with HAZOP Terminologies, Methodology, Brief Ideas for taking part /Involve in HAZOP Session. https://trainings.ifluids.com/
Ammonia Plant Technology
Pre-Commissioning Best Practices
Piping and Vessels Flushing and Cleaning Procedure
CONTENTS
1 Scope
2 Aim/purpose
3 Responsibilities
4 Procedure
4.1 Main cleaning methods
4.1.1 Mechanical cleaning
4.1.2 Cleaning with air
4.1.3 Cleaning with steam (for steam networks only)
4.1.4 Cleaning with water
4.2 Choice of the cleaning method
4.3 Cleaning preparation
4.4 Protection of the devices included in the network
4.5 Protection of devices in the vicinity of the network
4.6 Water flushing procedure
4.6.1 Specific problems of water flushing
4.6.2 Preparation for water flushing
4.6.3 Performing a water flush
4.6.4 Cleanliness criteria
4.7 Air blowing procedure
4.7.1 Specific problems of air blowing
4.7.2 Preparation for air blowing
4.7.3 Performing air blowing
4.7.4 Cleanliness checks
4.8 Steam blowing procedure
4.8.1 Specific problems of steam blowing
4.8.2 Preparation for steam blowing
4.8.3 Performing steam blowing
4.8.4 Cleanliness checks
4.9 Chemical cleaning procedure
4.9.1 Specific problems of cleaning with a chemical solution
4.9.2 Preparation for chemical cleaning
4.9.3 Performing a chemical cleaning
4.9.4 Cleanliness criteria
4.10 Re-assembly - general guideline
4.11 Preservation of flushed piping
The Process Safety Management (PSM) Standard requires that covered facilities manage change through a Management of Change (MOC) program. A robust MOC program effectively identifies and analyzes changes. Observation has shown that many MOC processes have deficiencies in training[1], whereas the Authors have observed that other facilities with effective MOC processes employ checklists and workflows to help MOC facilitators identify when engineering expertise is needed (e.g. Preventative Maintenance updates or changes in engineering documents / Process Safety Information (PSI)). It is important to note that PSI encompasses an array of information, which in addition to process safety, is also utilized to make decisions associated with asset expansions and optimization. Updating relief systems PSI is an essential, and often overlooked, aspect of MOC. When changes affecting relief systems are not recognized, a facility will often have to undertake the costly and untimely process of periodically restudying and revising the relief system PSI. These periodic studies can lead to unexpected asset installations and/or operating parameter changes. Based on experiences at various facilities, a workflow is presented in this paper as a timely method for plant level engineers to recognize changes that can affect relief systems. Ultimately this methodology can reduce the error rate associated with MOC and ensure related relief system PSI is accurately updated.
Ch. 5 Control Task Basics 1 Chapter 5 Control Task Basi.docxaryan532920
Ch. 5 Control Task Basics 1
Chapter 5 Control Task Basics
Modeling the Control Task
Most verbal descriptions of a technical task are not effective in their scope and are unreliable and
not clear-cut. A technical sketch, on the other hand, is reliable but lacks description of the
human and therefore may miss important details. Several approaches are the usual best approach
to describing a process to be programmed. All these types of charts, descriptions, sketches, etc
are best in describing the engineering model. Even a mathematical equation is acceptable to help
the process.
The engineering model must be complete and exact. What is described must work in all
circumstances and under all conditions and produce a safe result (that also, in this world, must
make a profit).
A description of the engineering process may be described as follows:
Input (from customer) Phases Activities Output (to customer)
Inquiry Analysis
Problem Analysis
Requirement Analysis
Cost Calculation
Quotation
Order Design
Requirements
Definition/Design
Construction
Documents
Approval of Design
Documents
Implementation
Realization,
Production including
testing
Product
Delivery/Commissioning Installation
Erection in
operational
environment
Useable Facility
Acceptance
Commitment
Operation Service Customer benefits
Table 5-1 The Engineering Process
General steps in Logic/Control Engineering
1. Analysis of problem – getting a thorough understanding of the task, analyze the
behavior/function of the system
2. Design the
Solution
a. Hardware
b. Software – construct a model of the system which should be more precise as
verbal description (formal), a graphical representation of system solution,
independent from any technical implementation, allowing communication
between control and mechanical engineers
3. Implementation – just work, no creativity required (programmer shouldn’t be artist)
4. Test
5. Start up in Operational Environment
Ch. 5 Control Task Basics 2
Several methods exist to describe a technical task. Some are more closely linked to the technical
implementation such as Ladder Logic, Function Block Diagram, and a procedural language such
as C or C++. It is always advisable to start with a drawing of the process with the inputs and
outputs shown. A formal drawing may be prepared - referred to as a P&ID - to describe a
process or an informal drawing such as the one below may be used.
The Juice Condenser
V-2
High Level
Half Level
V-1
Temperature Sw
Agitator
Heat
Start
Done/Ready
Fig. 5-1 The Juice Maker
A description of the above process is as follows:
For saving transportation cost for apple juice, the juice is condensed in a process of evaporation.
The water is evaporated in the tank using heat. The process of the process includes the following
steps:
1. Operator pushes the start pushbutton.
2. Valve V-2 opens ...
Instrumentation and process control fundamentalshossam hassanein
Basic course covers:
-Basic understanding of process control
-Important process control terminology
-Major components of a process loop
-Instrumentation P&ID symbols
1. Step 1. Node Selection and Purpose
As discussed above, a node represents a section of a process in which conditions undergo a significant change. For example, a pump system will
be a node because liquid pressure is increased, a reactor is a node because chemical composition changes, and a heat exchanger is a node
because it causes changes in fluid temperatures. In practice, a single node will frequently involve more than one process change. For example,
the node for a chemical reactor will include changes to pressure, temperature and composition.
The decision as to how big a node may be will depend on the experience of the team, the degree to which similar process systems have already
been discussed, the complexity of the process and the judgment of the leader.
Figure 1 shows how the first of the Standard Examples can be divided into three nodes. Each node has been circled with a cloud line.
Node 1 (blue line) is the Tank, T-100, with its associated equipment and instrumentation (the process change is level in the tank).
Node 2 (red line) incorporates two pumps, P-101 A/B, and the flow control valve, FCV-101 (the process changes are flow rate and liquid
pressure).
Node 3 (green line) includes the pressure vessel, V-101, with its associated relief valve, and other instrumentation (the process changes
are pressure, chemical composition and level).
Figure 1
Example of Node Selection
Often, node sizes increase as the HAZOP progresses because many of the identified hazards are repeated. For example, if a process includes
several sets of tank/pump/vessel systems such as that shown in Figure 1, the team may divide the first discussion into three nodes, as shown, but
then treat subsequent systems as single nodes.
Once the team meetings start, the scribe will place a set of full-size Piping & Instrument Diagrams (P&IDs), with the nodes marked out, on the
wall of the conference room. These master P&IDs will be the focus point for the team discussions and will serve as the official record of the
discussions. Team members can also be issued with a set of smaller, or shot-down, P&IDs for personal use.
Most team leaders use highlighter-type pens to define the boundaries of each node. As shown in Figure 1, different colors are used so that the
interfaces between the nodes are easily seen. Although the choice of color is not usually significant, some colors may have designated meanings.
For example, the color blue may mean that the sections so highlighted were not discussed because they had been covered by a previous
HAZOP. The color brown may designate items of equipment and piping that are deliberately being excluded from the current HAZOP discussion -
maybe because they are out of service. Yellow may indicate that a node has been defined but not yet discussed. At the conclusion of the analysis
all nodes should have been colored out, thus confirming that no equipment or piping items were overlooked.
In order to save time, the leader and scribe may pre-select the nodes. In a very simple process, this decision may make sense. Generally,
however, the team as a whole should decide on the nodes, partly because a HAZOP is a team activity, and partly because the definition and
selection of a node often is affected by the discussions that have taken place with regard to earlier nodes. Also, if the leader and scribe are from
outside the local organization, they may not fully understand all the process parameters that could affect node selection before the HAZOP starts.
For each node, the process engineer, and others who have knowledge of the system, will explain to the team the purpose of each node. Table 2
provides examples of purpose descriptions.
Table 2
Node Purpose Descriptions
Node Number Name Purpose
1 Tank, T-100, and T-100 contains a working inventory of liquid RM-12 which is
associated supplied by tank (rail) cars from outside suppliers. The node does
instrumentation. not include the tank loading systems.
2 Pumps, P-101 A/B, P-101 A/B transfer liquid RM-12 from Tank, T-100, to Vessel, V-
including flow control 100. Flow is controlled by FRC-101, whose set point is provided
valve, FCV-101. by LRC-100 (Node 1). One pump is operating; the other is on
stand-by. A is steam driven; B is electrically driven. B is usually on
stand-by.
3 Pressure Vessel, V-101, Liquid RM-12 flows into this vessel from various sources. V-101
including relief valve, provides surge capacity, thus smoothing out fluctuations in flow. A
PSV-101. vent line removes residual quantities of inert gas.
The scribe will enter the node description into the hazards analysis software. The start and stop points for the node should explained to the team.
Operations and maintenance experts will then provide some history and operating experience about it. Any relevant documentation to do with that
node, such as equipment data sheets or material safety data sheets (MSDS), should be put before the team at this time.
2. All control valves have a fail position. In the event of a power failure and/or loss of instrument air, the valve's spring operator will cause the valve
to fail open, fail closed, or remain in its current position. These failure modes should be identified. During the course of the HAZOP (probably
while discussing 'High Flow' or 'No Flow') the team can discuss if the valve's fail position is what it should be. An analysis of this type is
particularly valuable if more than one accident scenario has to be considered, and if the different scenarios call for different valve positions.
Once the node is defined and described, the team discusses deviations from design or operating intent following the steps shown in Table 1.
Step 2. Process Guideword / Safe Limits
A HAZOP looks at deviations from design or safe process conditions, so the first decision is to select the process parameters that are germane to
the facility under discussion. Generally the following parameters will be used:
Flow Rate;
Flow Quantity (for batch operations);
Pressure;
Temperature;
Level (when vessels and tanks are a part of the node);
Composition; and
Phase.
It will often be found that two parameters are related to one another. For example, the deviation of "high temperature" can create "high pressure".
Which of these parameters the team chooses to focus on is not usually all that important.
The parameters listed above can be supplemented with more specialized parameters, such as viscosity, color, surface tension and density.
These secondary parameters will not generally be needed since they are dependent on the first set. For example, the density of a liquid is likely to
be a function of temperature and composition. Therefore the discussions to do with temperature and composition deviations will incorporate any
concerns to do with density.
The safe limit values for each guideword should be established wherever possible.
Step 3. Identification of Hazards and their Causes
Once the nodes have been defined, and the safe operating limits identified, the hazards are determined. A hazard is a deviation outside the safe
operating limit that is identified through the use of deviation guidewords. The most commonly used deviation guidewords are:
High (More / Too Much);
Low (Less / Too Little / Not Enough);
No;
Reverse;
Misdirected; and
Wrong (Other Than).
Some teams use the term "Loss of Containment" as a guideword. Given that the ultimate purpose of a process safety program is to make sure
that hazardous materials remain confined in the pipes, tanks, and vessels that they are intended to be in, it could be argued that all process
deviations can ultimately result in "Loss of Containment", and so there is no need to handle this term separately. For example, high temperature
in a reactor is not, in and of itself, a hazard; it becomes a hazard only if it generates a pressure so high that containment is lost (exacerbated by
weakening of pressure vessel walls at the higher temperature). Similarly, high flow is not usually a hazard except that it may lead to a tank being
filled too rapidly, thus generating a high level scenario, which then can lead to "Loss of Containment" due to overflow of the tank. Another
example would be "Wrong Composition" in T-101 that can lead to loss of containment if the seal on P-101A fails.
Most of the discussion to do with events and their causes will be associated with the node itself. For example, a leak from a pump may be caused
by a seal leak at that pump. However, the team should always be looking for causes from other areas of the plant. For example, if a new chemical
is inadvertently introduced into the system at another location, that chemical could cause the seal to leak.
If the consequence of a hazard has an effect on another node the team leader and scribe should postpone the relevant discussion until that node
is reached by the team.
The actual guideword selected depends on team preference and company tradition. For example, the word "more" is used in traditional HAZOPs
to describe an excess of some parameter. However, many teams prefer to use the word "high". An even better term is "too much" because it
implies an undesirable situation - the parameter in question has gone outside its safe limit range. After all, high flow is often a good thing because
it suggests that the facility is making more product and more money.
Table 3 shows potential hazards for two of the variables: level in T-100, and flow from T-100 to V-101.
Table 3
Hazard Causes
Node Process Deviation Causes
Variable
1 Level High 1. High flow into T-100
2. Failure of the T-100 level control system.
3. P-101A and B both stop.
Low 1. Low flow into T-100.
2. Failure of the T-100 level control system
... ... ...
2 Flow High 1. Failure of level control system in T-100.
2. Pump overspeed.
Low/No 1. Failure of level control system in T-100.
2. Pump mechanical problems.
Reverse 1. Pump failure (with check valve failure).
Some hazards can have more than one cause. For example, High Level in T-100 is shown in Table 3 to have three potential causes:
1. High flow into the tank;
2. Failure of the level control system of the tank; and
3. Pumps P-101 A/B stop.
3. The process and deviation guidewords are organized into a matrix, as shown in Table 4. The shaded boxes in this matrix are to be discussed by
the team. The empty boxes (such as "Reverse Phase" and "Misdirected Temperature") are not discussed because they do not have physical
meaning. In Table 4, the deviations "Low" and "No" are merged since they often lead to essentially the same discussion. However they should be
used separately where appropriate. For example, "Low Level" in a tank may lead to little more than production problems, whereas "No Level" in
that tank could create major hazards such as pump cavitation and air ingress into the tank.
Table 4
HAZOP Matrix
Flow Pressure Temperature Level Composition Phase
High
Low / No
Reverse
Misdirected
Wrong
The choice of terms can vary according to the practice and culture of the facility. For example, some companies use the terms "As Well As" or
"Contamination". These are equivalent to the term "Wrong Composition" in Table 4. Sometimes the guideword combination "Reverse Pressure" is
us used to cover situations where operating pressures are below ambient.
Having determined which node parameters are to be used, the team discusses the hazards associated with each (shaded) square, using the
prompt questions shown in Table 5 - which uses the term High Flow for illustration.
Table 5
HAZOP Steps - Using "High Flow" as an Example
1. What is the quantitative definition for "High Flow"? (i.e., what is the Safe Upper Limit for flow in this node?).
2. What are the causes of "High Flow"?
3. How would an operator know that "High Flow" is occurring? How is this hazard "announced"?
4. What are the consequences (safety, environmental, economic) of "High Flow"?
5. What safeguards are in place to prevent "High Flow"?
6. What is the predicted frequency with which "High Flow" is expected to occur, both with and without safeguards?
7. What is the risk associated with the hazard just identified (evaluated from a risk matrix)?
8. Does the team have any findings or recommendations?
The team will find that many hazards, causes and consequences are similar to one another as the discussion moves from node to node.
Teams can sometimes become tangled up when hazards have effects outside the current node. For example, the team may be discussing "Low
Level" in Tank, T-101. The cause of low level in the tank may lie within the node itself: a leak through the tank base, for example. However "Low
Level" is more likely to be caused by loss of flow of RM-12 into the tank, i.e., the cause is "Low Flow" in an upstream node. Similarly, deviations in
the current node can create hazards in other nodes. "Low Level" in T-101 could lead to seal failure of P-101A, which is in the next node.
Step 4. "Announcement" of the Hazard
The team should ask how each deviation outside the safe limits "announces" itself. Usually high and low alarms are built into the instrumentation
associated with critical variables. These alarms tell the operator that an unsafe condition has occurred, or is developing. In the standard example
a high level alarm incorporated into LRC-100 would warn the operator of high level in T-100.
If the team finds that there is no obvious way for an operator to know that a safe limit has been exceeded, then the hazards analysis will probably
recommend the installation of additional instrumentation to provide warnings and alarms.
Step 5. Consequences
Having identified the hazards, the team should then determine the consequences of those hazards, with and without safeguards in place.
Consequences can be safety, environmental or economic.
Table 6 illustrates some consequences for the standard example using the hazards listed in Table 3.
Table 6
Consequences
Node Process Value Consequences
Variable
1 Level High 1. Overflow could cause injury to operator in area.
2. Overflow would be contained by secondary containment
system � no environmental hazard identified.
Low 1. Possible damage to Pump, P-101, impeller, leading to
vibration and leak and personal injury.
... ... ...
2 Flow High 1. None identified.
Low/No 1. High level in T-100 and/or low level in V-101.
Reverse 1. Overflow of T-100.
... ... ...
It can be seen from Table 6 that the term "None identified" is entered into the notes when the team was unable to think of a significant
consequence associated with that hazard. Use of this term assures readers of the final report that the team did discuss potential consequences,
but were unable to come up with issues of significance; they did not simply forget to examine this scenario.
Step 6. Identification of Safeguards
Some teams choose to list the safeguard-type assumptions that are made during the analysis. Table 7 provides an example of such a list.
Table 7
Hazards Analysis Assumptions
1. The facility has been designed and engineered properly based on legal requirements, design/engineering codes, industry standards and
good engineering practices.
2. The process will not be operated above design rates.
3. All equipment will be well maintained.
4. Appropriate instrument and control system test procedures will be followed.
4. 5. Alarm and shutdown set points will not be set out of range or disconnected to avoid nuisance trips or other problems.
6. Control valve bypasses will not be used unless the control valve is blocked out.
7. Rupture disks will be monitored.
8. If a double relief valve system is used, at least one will always be in service when the facility is operating.
9. Relief device bypasses, vents and drains not normally opened during operation will remain closed.
10. Pressure safety relief valves will not open except on demand.
11. Inadvertent opening or closing of locked/car sealed valves or blinds during maintenance is not addressed.
Step 7. Predicted Frequency of Occurrence of the Hazard
-1
Estimated frequency values for each hazard are generally stated in terms of events per year, or yr . Sometimes they are in units of events per
mission or events per batch operation. Table 8 provides some estimated frequency values for the hazards in the standard example.
Table 8
Sample Frequencies
Node Process Variable Deviation Frequency Frequency
without with safeguards
-1
safeguards yr
-1
yr
1 Level High 0.1 0.01
Low 0.5 0.05
... ... ...
2 Flow High 0.05 0.01
Low/No 1.0 1.0
Reverse 0.01 0.01
... ... ...
-1
Taking the deviation "High Level" in T-101 as an example, the anticipated frequency of this event is 0.1 yr , or once in ten years. If credit is taken
for the safeguard (high level alarm on LRC-101) and the probability of this alarm failing is say 0.1, then the anticipated frequency of high level
-1
drops to 0.01 yr , or once in a hundred years.
If a hazard has more than one cause, a frequency for each can be provided in the same way as was done for consequences in Table 6. The full
hazard / cause / consequence / frequency layout can be structured as shown in Table 9.
Table 9
Example of Hazard Frequencies
Hazard Cause Consequence Frequency Risk
# # #
1 1.1 1.1 1.1 1.1
1.2 1.2 1.2 1.2
2 2.1 2.1 2.1 2.1
3 3.1 3.1 3.1 3.1
3.2 3.2 3.2 3.2
3.3 3.3 3.3 3.3
Hazard #1 could be, say, "High Level in Tank, T-100". The first cause for this hazard (#1.1) is "High Flow into T-100". The consequence
associated with this failure is "Overflow of tank leading to operator injury". The predicted frequency of this event, taking credit for safeguards, is
-1
once in a hundred years, or 0.01 yr .
The second cause (#1.2) for Hazard #1 is the failure of LRC-101, the T-100 level control system. In this case the consequence (#1.2) may be a
small spill from the tank that is handled by the drain system, thus avoiding an environmental problem. The predicted frequency for this event
(#1.2) is once in twenty years.
Step 8. Risk Rank
Once the hazards have been identified, and their causes, consequences and frequencies discussed, the team should risk rank each identified
hazard scenario. If a risk matrix is used the estimated risk values for the two scenarios are 'B' and 'C' respectively.
Formal risk ranking can help reduce the number of findings. Hazards analysis teams have a tendency to be conservative and to generate a
recommendation for every identified hazard without a great deal of scrutiny. Formalizing the risk helps cut out those recommendations that are
really not justifiable.
Step 9. Findings
Those hazards that have a risk level above the facility's acceptable risk level generate a finding which will then become a recommendation.
Findings and their associated information should be summarized and presented in an overview form as illustrated in Table 10. Generally, findings
are listed in the order in which they were created. The order in which the findings are listed is not significant in terms of risk level or follow-up
priority.
Table 10
Presentation of Findings
Finding Node Finding Risk Suggested Drawings /
Number Rank Recommendations Documents
During the course of a long HAZOP, the team may find that certain findings are repeating themselves. For example, it may be that all centrifugal
pumps of a certain type have an unusually high rate of seal failure. In such cases the team should develop generic findings and
recommendations.
Step 10. Next Process Guideword / Node
Having completed the discussion to do with a process guideword, the team moves on to the next guideword, or to the next node if all of the
guidewords have been discussed until the HAZOP is concluded.