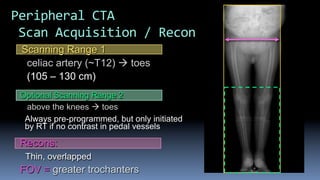
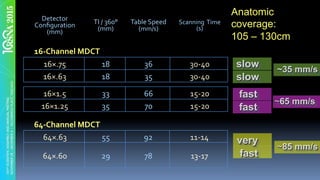
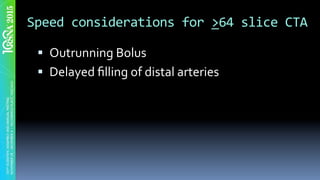
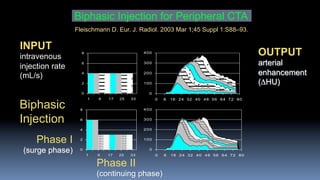
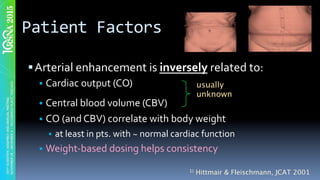
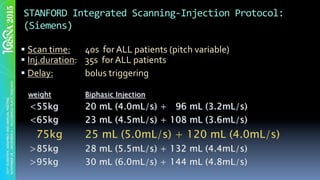
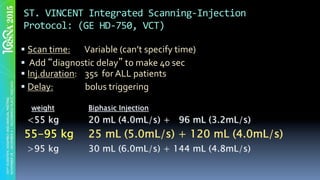
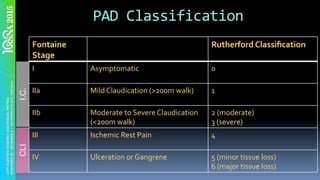
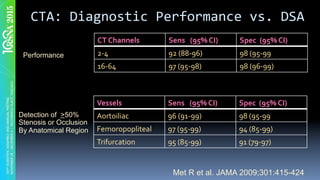
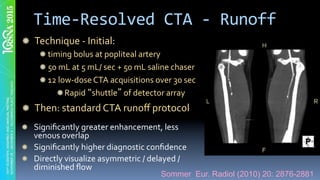
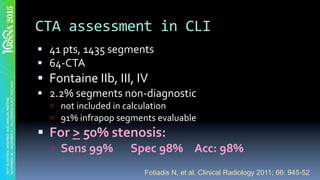
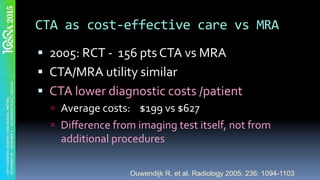
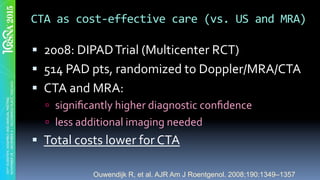
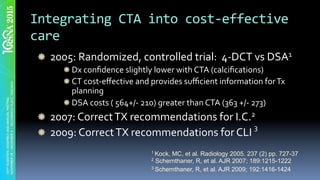
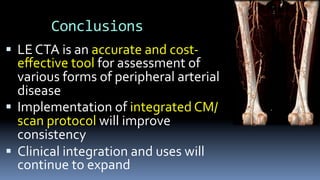
PERIPHERAL	CTA	
Richard	L.	Hallett,	MD	
	
Chief,	Cardiovascular	Imaging	
Northwest	Radiology	Network	
Indianapolis,	IN	
	
Adjunct		Assistant	Professor	–	Radiology	
Stanford	University	
Stanford,	CA	
							RC	612B				 	 	 	3	December	2015				 	 	 	 	0830	–	1000
Outline	
§  CTA	Acquisition	Techniques	
ú  Scan	Acquisition	
ú  Contrast	Medium	injection	
ú  Reconstruction	
§  Clinical	Efficacy	in	PAD		
§  Cost	Effectiveness	
Handout:	stanford.edu/~hallett			choose	folder	“RSNA2015”	
@CTeriffic
CTA	Indications	in	PAD	
" Intermittent	Claudication	
" Critical	Limb	Ischemia	
" Acute	Ischemia	(urgent)	
" Monitoring	of		Therapy	(complications)
CTA	Benefits				/		Limitations	
§  Non-invasive	(DSA)	
§  Spatial	Resolution	
(MRA)	
§  Quick	Acquisition	
§  (mostly)	Operator	
Independent	
§  Ionizing	Radiation	
§  Nephrotoxic	Contrast	
§  Spatial	Resolution	(DSA)	
§  No	same	session	Tx	
§  No	flow	or	pressure		
measurements
CTA	Acquisition	
" Scan	Acquisition	
" Contrast	Medium	Injection
CTA	Scan	Acquisition	
Handout:	stanford.edu/~hallett			choose	folder	“RSNA2015”	
@CTeriffic
Optional Scanning Range 2
above the knees à toes
Always pre-programmed, but only initiated
by RT if no contrast in pedal vessels
Scanning Range 1
celiac artery (~T12) à toes
(105 – 130 cm)
Recons:
Thin, overlapped
FOV = greater trochanters
Peripheral	CTA	
	Scan	Acquisition	/	Recon
Detector	
Configuration	
(mm)	
TI	/	360°	
(mm)	
Table	Speed	
(mm/s)	
Scanning		Time											
(s)	
16-Channel	MDCT	
16×.75	 18	 36	 30-40	
16×.63	 18	 35	 30-40	
16×1.5	 33	 66	 15-20	
16×1.25	 35	 70	 15-20	
~35 mm/s
slow
slow
fast
fast
Anatomic
coverage:
105 – 130cm
64-Channel	MDCT	
64×.63	 55	 92	 11-14	
64×.60	 29	 78	 13-17	 fast
very
~85 mm/s
~65 mm/s
Speed	considerations	for	>64	slice	CTA	
§  Outrunning	Bolus	
§  Delayed	filling	of	distal	arteries
Free-Flap	Planning	CTA
preprogrammed,
optional 2nd acquisition
Arteriomegaly
1st acquisition
Table speed (mm/s)
0
0.2
0.4
0.6
0.8
1
0 30 60 90 120 150 180
v AO->POP (mm/s)
Cumulative
ProportionofLimbs
0
0.2
0.4
0.6
0.8
1
RelativeRiskto
OutrunBolus
Cumulative
percentageoflimbs
Table speed (mm/s)
Relativeriskto
outrunbolus
Aorto-popliteal
transit speed (mm/s)
0
0.2
0.4
0 30 60 90 120 150 180
v AO->POP (mm/s)
Cumula
Proportiono
0
0.2
0.4
Relative
Outrun
Peripheral	arterial	bolus	propagation	
< .01
~.33
> .50
Fleischmann D and Rubin GD.
Radiology 2005, 1076-1082
Contrast	Administration	
for	peripheral	CTA	
Fleischmann D. How to design injection protocols for multiple detector-row
CT angiography (MDCTA). Eur Radiol. 2005 Dec 1;15 Suppl 5:E60–5.
Contrast	considerations	for	peripheral	CTA	
§  Aorto-popliteal	transit	time:	4-24	sec	(10	sec)	
ú  Contrast	speed:	29-177	mm/s	
§  Biphasic	injections	yield	more	consistent	
enhancement	profile		
Fleischmann et al. JVIR 2006, 17(1) 3-26.
0
100
200
300
400
0 8 16 24 32 40 48 56 64 72 80
0
2
4
6
8
1 9 17 25 33
INPUT
intravenous
injection rate
(mL/s)
OUTPUT
arterial
enhancement
(ΔHU)
Phase I
(surge phase)
Phase II
(continuing phase)
Biphasic Injection for Peripheral CTA
300
400
0
100
200
300
400
0 8 16 24 32 40 48 56 64 72 80
0
100
200
300
400
0 8 16 24 32 40 48 56 64 72 80
0
2
4
6
8
1 9 17 25 33
0
2
4
6
8
1 9 17 25 33
6
8
Biphasic
Injection
Fleischmann D. Eur. J. Radiol. 2003 Mar 1;45 Suppl 1:S88–93.
Patient	Factors	
§ Arterial	enhancement	is	inversely	related	to:		
§  Cardiac	output	(CO)	
§  Central	blood	volume	(CBV)	
§  CO	(and	CBV)	correlate	with	body	weight	
§  at	least	in	pts.	with	~	normal	cardiac	function	
§  Weight-based	dosing	helps	consistency	
		 1) Hittmair & Fleischmann, JCAT 2001
usually
unknown
Integrated	Contrast/Scan	Protocol	
" Simple,	weight	based	injection	volumes	and	flow	rates,	
combined	with	a	fixed	scan	time	or	scan	time/diagnostic	
delay	sum.		
" automated	bolus	triggering	
" Use	physiology	not	scanner	speed	
" BENEFITS:	
" Decrease	patient	to	patient	variability	in	scan	quality	
" Optimize	imaging	timing	
" Image	all	of	the	contrast	given!	
" (Potentially)	save	contrast
STANFORD	Integrated	Scanning-Injection	Protocol:	
(Siemens)	
§ Scan	time:	 	40s		for	ALL	patients	(pitch	variable)		
§ Inj.duration:				35s		for	ALL	patients	
§ Delay: 	bolus	triggering	
weight Biphasic Injection
<55kg 20 mL (4.0mL/s) + 96 mL (3.2mL/s)
<65kg 23 mL (4.5mL/s) + 108 mL (3.6mL/s)
75kg 25 mL (5.0mL/s) + 120 mL (4.0mL/s)
>85kg 28 mL (5.5mL/s) + 132 mL (4.4mL/s)
>95kg 30 mL (6.0mL/s) + 144 mL (4.8mL/s)
ST.	VINCENT	Integrated	Scanning-Injection	
Protocol:	(GE	HD-750,	VCT)	
§ Scan	time:	 	Variable	(can’t	specify	time)		
§ 	Add	 diagnostic	delay 	to	make	40	sec	
§ Inj.duration:				35s		for	ALL	patients	
§ Delay: 	bolus	triggering	
weight Biphasic Injection
<55 kg 20 mL (4.0mL/s) + 96 mL (3.2mL/s)
55-95 kg 25 mL (5.0mL/s) + 120 mL (4.0mL/s)
>95 kg 30 mL (6.0mL/s) + 144 mL (4.8mL/s)
CTA	Reconstruction		
Handout:	stanford.edu/~hallett			choose	folder	“RSNA2015”	
@CTeriffic
CTA	Reconstruction	and	Interpretation	
§  Use	smaller	FOV	(Trochanter	to	trochanter)		
§  Use	Iterative	Reconstruction	
§  Recon	thin,	overlapping	images	and	review	in	
3D		
ú  VR	/	MIP	overview	then	MPR,	CPR	
ú  3	-5	mm	Axials	in	A/P	
§  Recon	larger	matrix	–	1024x1024	
** Fleischmann D, Hallett RL, Rubin GR. JVIR 2006, 17: 3-26.
1024	Matrix	
Examples
Efficacy	of	LE	CTA	in	PAD	
Handout:	stanford.edu/~hallett			choose	folder	“RSNA2015”	
@CTeriffic
Fontaine	
Stage	
Rutherford	Classification	
I	 Asymptomatic	 0	
IIa	 Mild	Claudication	(>200m	walk)	 1	
IIb	 Moderate	to	Severe	Claudication	
(<200m	walk)	
2	(moderate)	
3	(severe)	
III	 Ischemic	Rest	Pain	 4	
IV	 Ulceration	or	Gangrene	 5	(minor	tissue	loss)	
6	(major	tissue	loss)	
PAD	Classification	I.C.CLI
Detection of >50%
Stenosis or Occlusion
By Anatomical Region
Vessels	 Sens			(95%	CI)	 Spec		(95%	CI)	
Aortoiliac	 96	(91-99)	 98	(95-99	
Femoropopliteal	 97	(95-99)	 94	(85-99)	
Trifurcation	 95	(85-99)	 91	(79-97)	
CTA:	Diagnostic	Performance	vs.	DSA	
CT	Channels	 Sens			(95%	CI)	 Spec		(95%	CI)	
2-4	 92	(88-96)	 98	(95-99	
16-64	 97	(95-98)	 98	(96-99)	
Performance
Met R et al. JAMA 2009;301:415-424
Diagnostic	Performance:	64-slice	CTA	
§  Symptomatic	PAD:	242	pts,	7420	segments		
§  CTA	and	DSA	performed	
§  For	>70%	stenosis:	
ú  	SENS/SPEC	96%					PPV	98%						NPV	99%	
ú  No	sig	difference	vs	DSA	findings	
ú  Results	similar	in	Ca++	vs.	Non-Ca++	lesions	
Napoli A. Radiology. 2011 Dec 1;261(3):976–86.
The	Achilles 	Heel	of	Extremity	
CTA......
Predictors	of	Vascular	
Calcification	
" Above	knee:1	Severe	PAD	(Fontaine	III-IV),	
Diabetes	
" Below	Knee:1	Renal	Failure	(esp.	dialysis),	
Diabetes	
" Also:2		Age,	cardiac	disease	
" If	heavy,	significant	decrease	in	SENS/SPEC	in	
calf	1	
1 Meyer BC Eur Radiol (2010) 20:497-505
2 Ouwendijk R. Radiology (2006) 241, 603-608
Time-Resolved	CTA	-	Runoff	
" Technique	-	Initial:		
" timing	bolus	at	popliteal	artery	
" 50	mL	at	5	mL/	sec	+	50	mL	saline	chaser	
" 12	low-dose	CTA	acquisitions	over	30	sec	
" Rapid	 shuttle 	of	detector	array	
" Then:	standard	CTA	runoff	protocol	
" Significantly	greater	enhancement,	less	
venous	overlap	
" Significantly	higher	diagnostic	confidence	
" Directly	visualize	asymmetric	/	delayed	/	
diminished	flow	
Sommer Eur. Radiol (2010) 20: 2876-2881
Clinical	Utility	of	LE	CTA	in	PAD	
§  Intermittent	Claudication	(IC)	
§  Critical	Limb	Ischemia	(CLI)	
Handout:	stanford.edu/~hallett			choose	folder	“RSNA2015”
Intermittant	Claudication	(IC)	
§  Only	¼	progress	
clinically	
§  Amputation	
uncommon	(unless	
diabetic)	
§  More	likely	ilio-femoral	
than	trifurcation	dz
Management	of	Intermittent	
Claudication		by	CTA	
§  Fontaine	IIb	patients,	Tx	decisions	by	TASC	II	
criteria	
§  57/58	correct	Tx	decision-making	by	CTA	
ú  One	CFA	stenosis	missed	
ú  29	endovasc/surg	Tx	
ú  29	conservative	mgmt		
Schernthaner R, et al. AJR 2007; 189:1215-1222
§  Duration	>	2	weeks		
§  rest	pain,	tissue	loss,	ulcers,	
gangrene	(TASC	II)	
ú  Fontaine	III	/	IV	
§  Higher	incidence	DM,	
trifurcation	disease,	
comorbidities	than	IC	
Critical	Limb	Ischemia	(CLI)
CTA	assessment	in	CLI	
§  41	pts,	1435	segments		
§  64-CTA	
§  Fontaine	IIb,	III,	IV	
§  2.2%	segments	non-diagnostic		
ú  not	included	in	calculation	
ú  91%	infrapop	segments	evaluable	
§  For	>	50%	stenosis:	
ú  Sens	99% 	Spec	98% 	Acc:	98%	
Fotiadis N, et al. Clinical Radiology 2011; 66: 945-52
Management	Decisions	in	CLI	
§  28	pts,	Fontaine	IV	
§  64-detector	CTA	
§  14/28	à	endovascular	and/or	surg.	Tx	
§  correct	decision-making	for	interventions,	
amputation,	and	medical	Tx	based	on	DSA	
and	Tx	response	
Schernthaner R, et al. AJR 2009; 192: 1416-1424
Management	of	both	IC	and	CLI	by	CTA	
§  Treated	using	TASC	II	guidelines	
ú  49	conservative	TX	
ú  87	Endovascular	
ú  38	surgery	
ú  17	hybrid	
§  Tx	recommendations	from	CTA	same	as	DSA	
in	all	but	ONE	
Napoli A. Radiology. 2011 Dec 1;261(3):976–86.
Examples:	Atherosclerotic	Disease	
-	Therapy	Planning
Buttock	Claudication	–	Calcified	Aorto-
iliac	Disease	
Chang et al. JVIR. 2011 Aug 1;22(8):1131–1.
Post-TX	Assessment	by	CTA
CTA	for	stent	assessment	
§  Most	stents	assessable	(76%)	
by	CTA	
ú  Gold	/	platinum	markers	
ú  Motion	
ú  Strecker	stent	(Tantalum):	
Increased	luminal	density	2	
§  If	evaluable,	sens/spec	~	95%	
for	significant	in-stent	
restenosis	(vs.	DSA)	
1 Li X, et al. Eur J Radiol 2010; 98-103
2 Strotzer, Invest. Radiol. 2001:36(11)
CTA	for	
assessment	of	
complications
CTA	for	
assessment	of	
complications	
Willmann JK, et al. Radiology 2003; 229: 465-474.
Acute	R	leg	pain
Cost-Effectiveness	of	CTA	
Handout:	stanford.edu/~hallett			choose	folder	“RSNA2015”	
@CTeriffic
CTA	as	cost-effective	care	vs	DSA	
" 2005:	Randomized,	controlled	trial:		4-DCT	vs	
DSA1	
" Dx	confidence	slightly	lower	with	CTA	
(calcifications)	
" CT	cost-effective	and	provides	sufficient	
information	for	Tx	planning	
" DSA	costs	(564	Euro)	greater	than	CTA	(363)		
1 Kock, MC, et al. Radiology 2005. 237 (2) pp. 727-37
CTA	as	cost-effective	care	vs	MRA	
§  2005:	RCT	-		156	pts	CTA	vs	MRA	
§  CTA/MRA	utility	similar	
§  CTA	lower	diagnostic	costs	/patient	
ú  Average	costs:				$199	vs	$627	
ú  Difference	from	imaging	test	itself,	not	from	
additional	procedures	
Ouwendijk R, et al. Radiology 2005: 236: 1094-1103
CTA	as	cost-effective	care	(vs.	US	and	MRA)	
§  2008:	DIPAD	Trial	(Multicenter	RCT)	
§  514	PAD	pts,	randomized	to	Doppler/MRA/CTA	
§  CTA	and	MRA:		
ú  significantly	higher	diagnostic	confidence		
ú  less	additional	imaging	needed	
§  Total	costs	lower	for	CTA	
Ouwendijk R, et al. AJR Am J Roentgenol. 2008;190:1349–1357
Integrating	CTA	into	cost-effective	
care	
" 2005:	Randomized,	controlled	trial:		4-DCT	vs	DSA1	
" Dx	confidence	slightly	lower	with	CTA	(calcifications)	
" CT	cost-effective	and	provides	sufficient	information	for	Tx	
planning	
" DSA	costs	(	564+/-	210)	greater	than	CTA	(363	+/-	273)	
" 2007:	Correct	TX	recommendations	for	I.C.2	
" 2009:	Correct	TX	recommendations	for	CLI	
3	
1 Kock, MC, et al. Radiology 2005. 237 (2) pp. 727-37
3 Schernthaner, R, et al. AJR 2009; 192:1416-1424
2 Schernthaner, R, et al. AJR 2007; 189:1215-1222
Value-Added	Info	from	CTA:		
GSV	mapping1-2	
§  Pre-Op	CTA:	Adequate	for	
evaluation	of	GSV	size1-2	
ú  SENS/SPEC	>90%	(better	in	
thigh)	
ú  Charge	savings	of	~	50K	at	
authors	site	alone2	
ú  If	GSV	<	2	mm,	then	do	
Doppler	US	 1DeFreitas DJ, et al. J Vasc Surg 2013; 57(1): 5-55.
2Johnston WF, et al. J Vasc Surg 2012: 56(5) 1331-37.
Conclusions	
§  LE	CTA	is	an	accurate	and	cost-
effective	tool	for	assessment	of	
various	forms	of	peripheral	arterial	
disease	
§  Implementation	of	integrated	CM/
scan	protocol	will	improve	
consistency	
§  Clinical	integration	and	uses	will	
continue	to	expand
§  Special	thanks	to…..	
Dominik	Fleischmann,	MD	
Thanks	for	your	Attention!	
Handout:	stanford.edu/~hallett			choose	folder	“RSNA2015”	
@CTeriffic

Handout rc612 b_hallett_le cta_sm