![© 2014 MapR Technologies 27
[WHITEBOARD BREAK]](https://image.slidesharecdn.com/2015-150411022212-conversion-gate01/75/Hadoop-and-Genomics-What-you-need-to-know-2015-04-09-Shenzhen-BGI-27-2048.jpg)
![© 2014 MapR Technologies 28© 2014 MapR Technologies
[REDACTED]](https://image.slidesharecdn.com/2015-150411022212-conversion-gate01/75/Hadoop-and-Genomics-What-you-need-to-know-2015-04-09-Shenzhen-BGI-28-2048.jpg)


![© 2014 MapR Technologies 70
• Paper submitted describing the implementation
• Releasing as an Open Source project soon
• [HBase Schema/Algorithm Slides]
7
0](https://image.slidesharecdn.com/2015-150411022212-conversion-gate01/75/Hadoop-and-Genomics-What-you-need-to-know-2015-04-09-Shenzhen-BGI-69-2048.jpg)

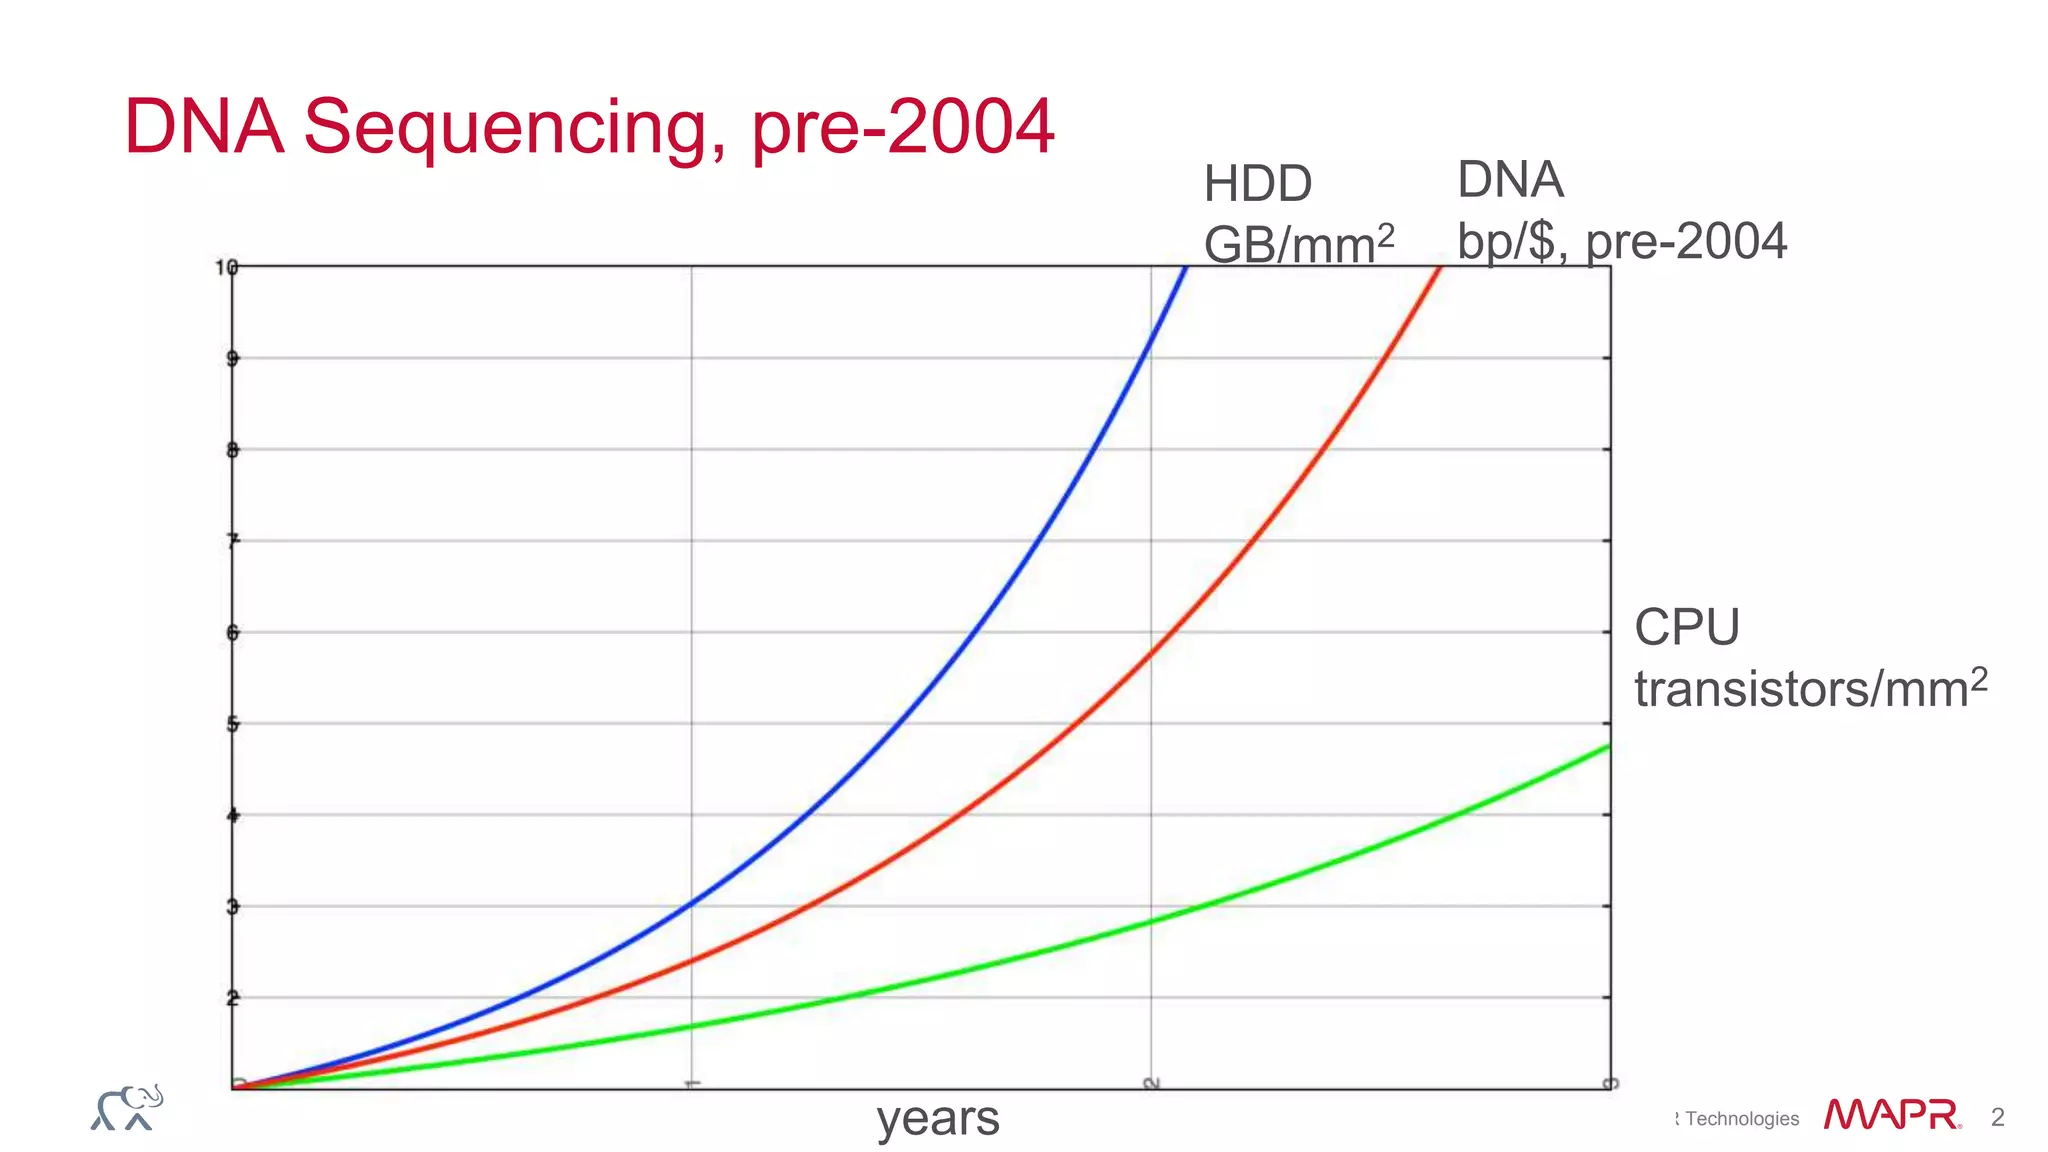
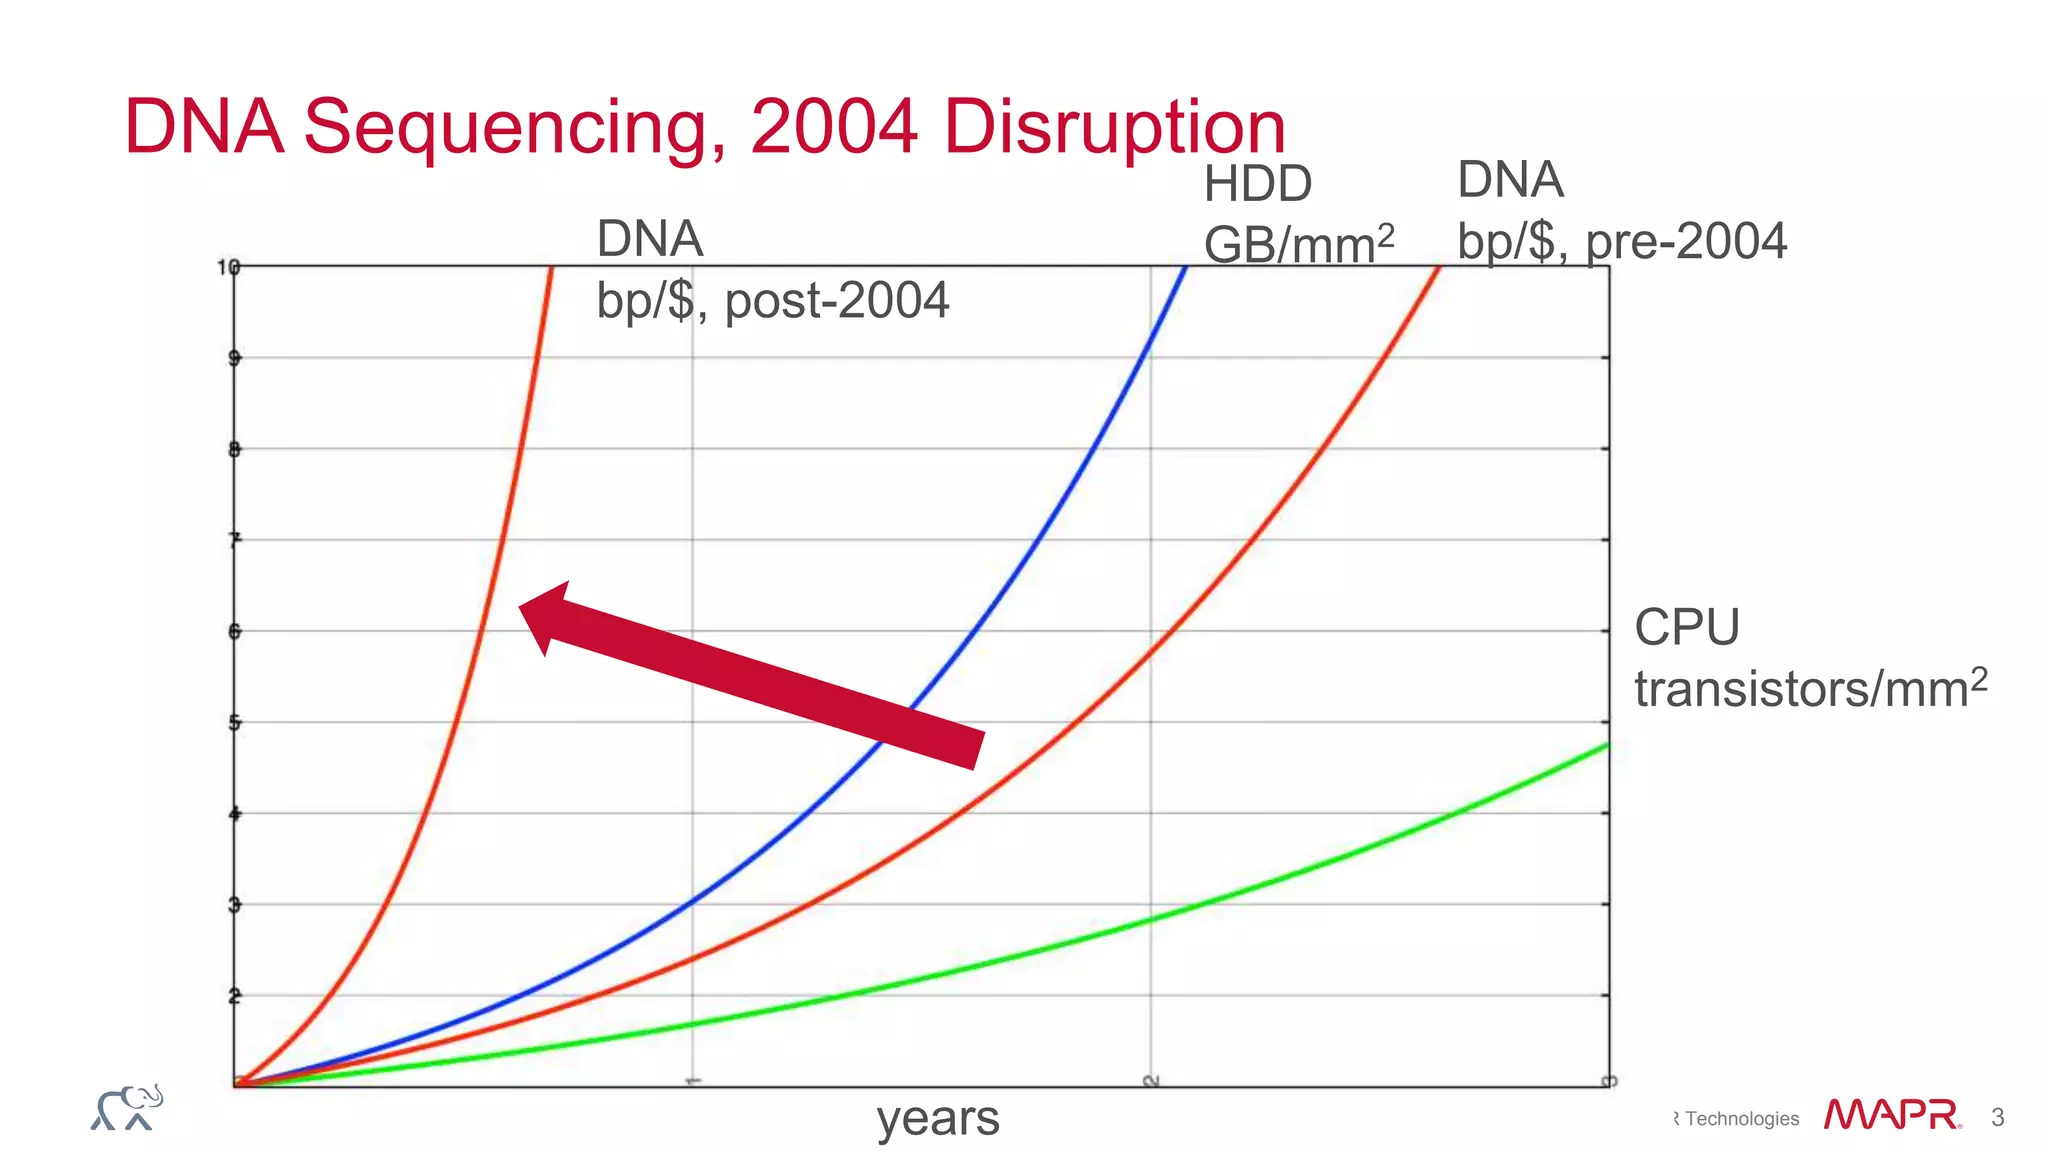
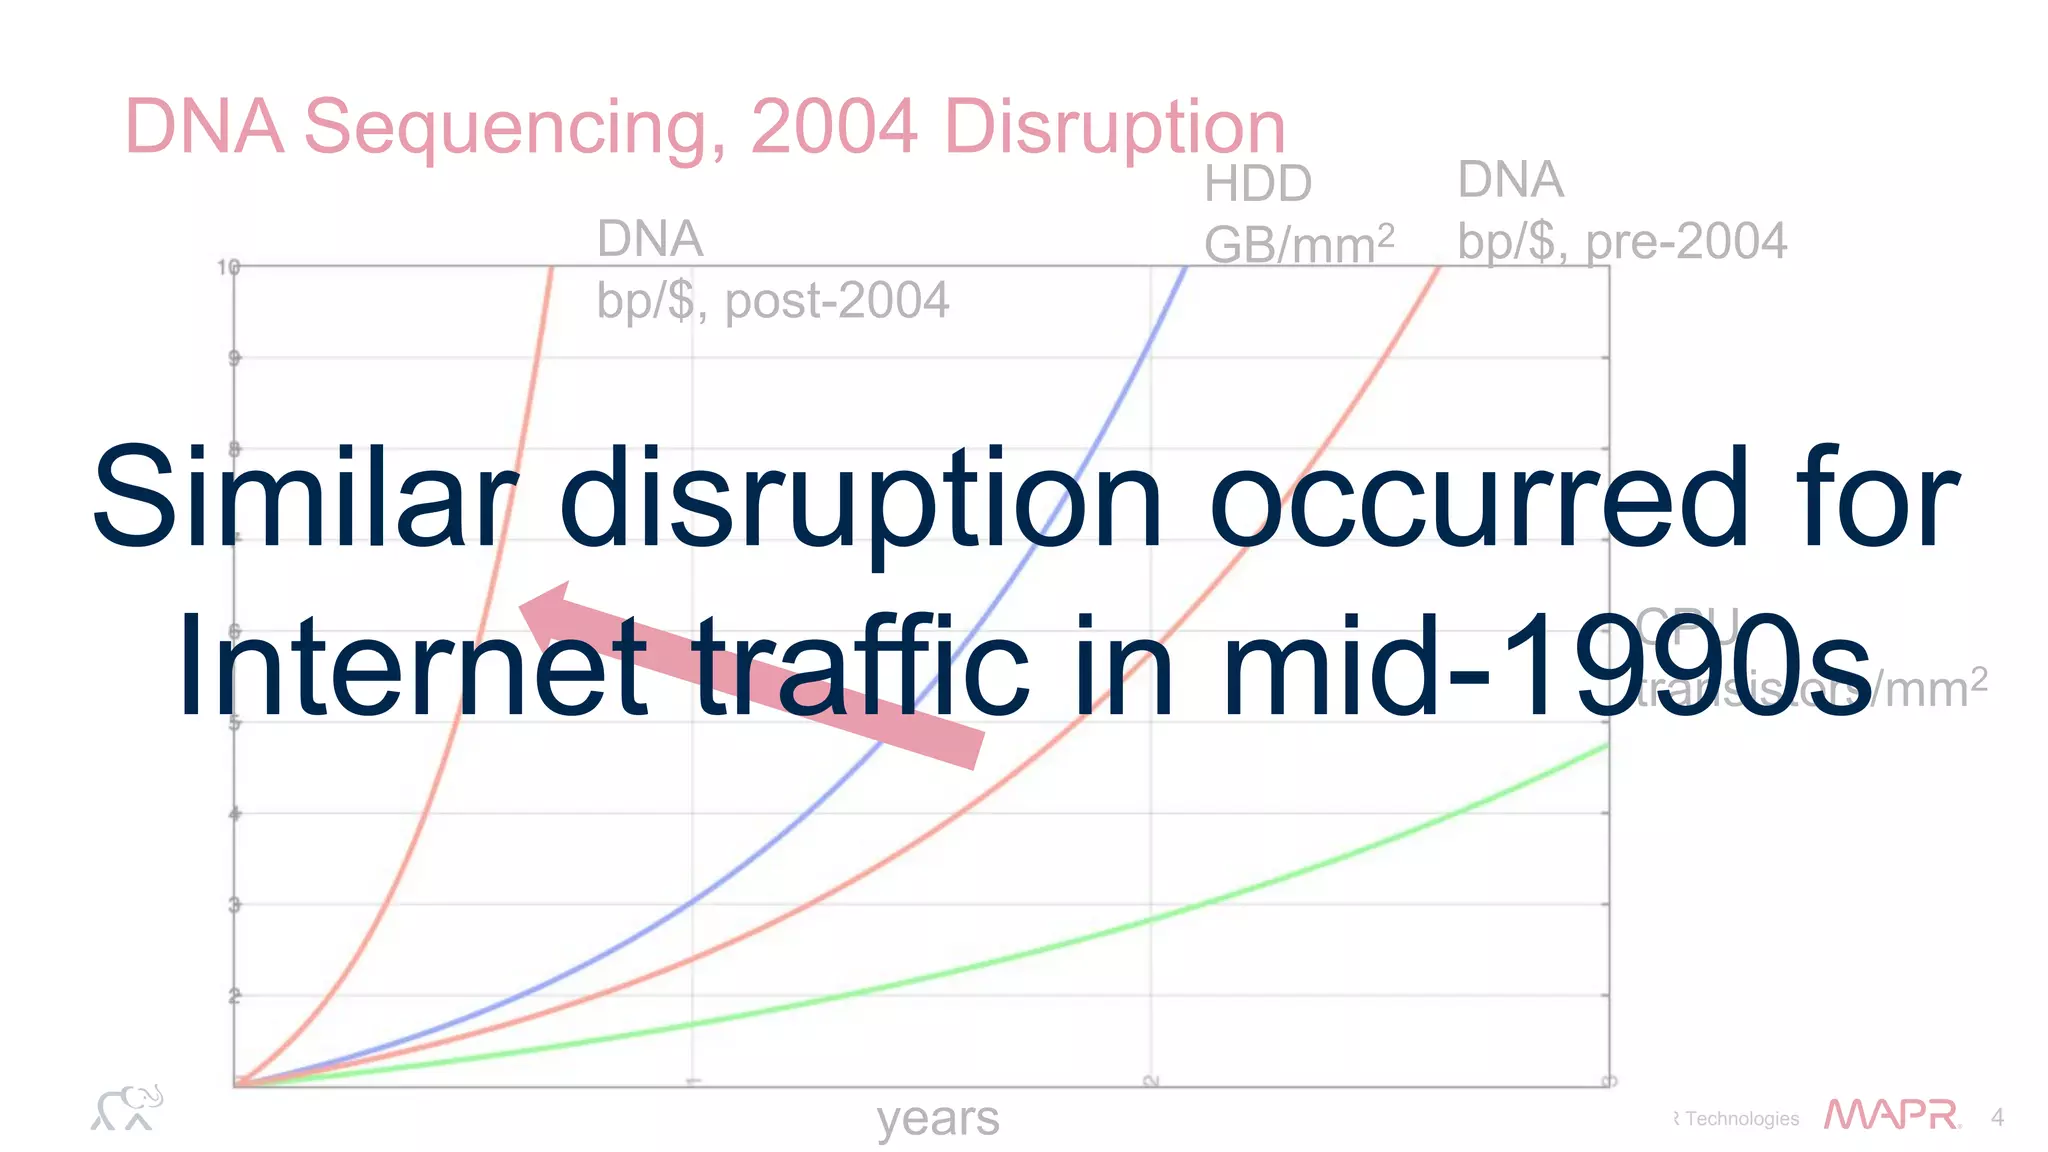
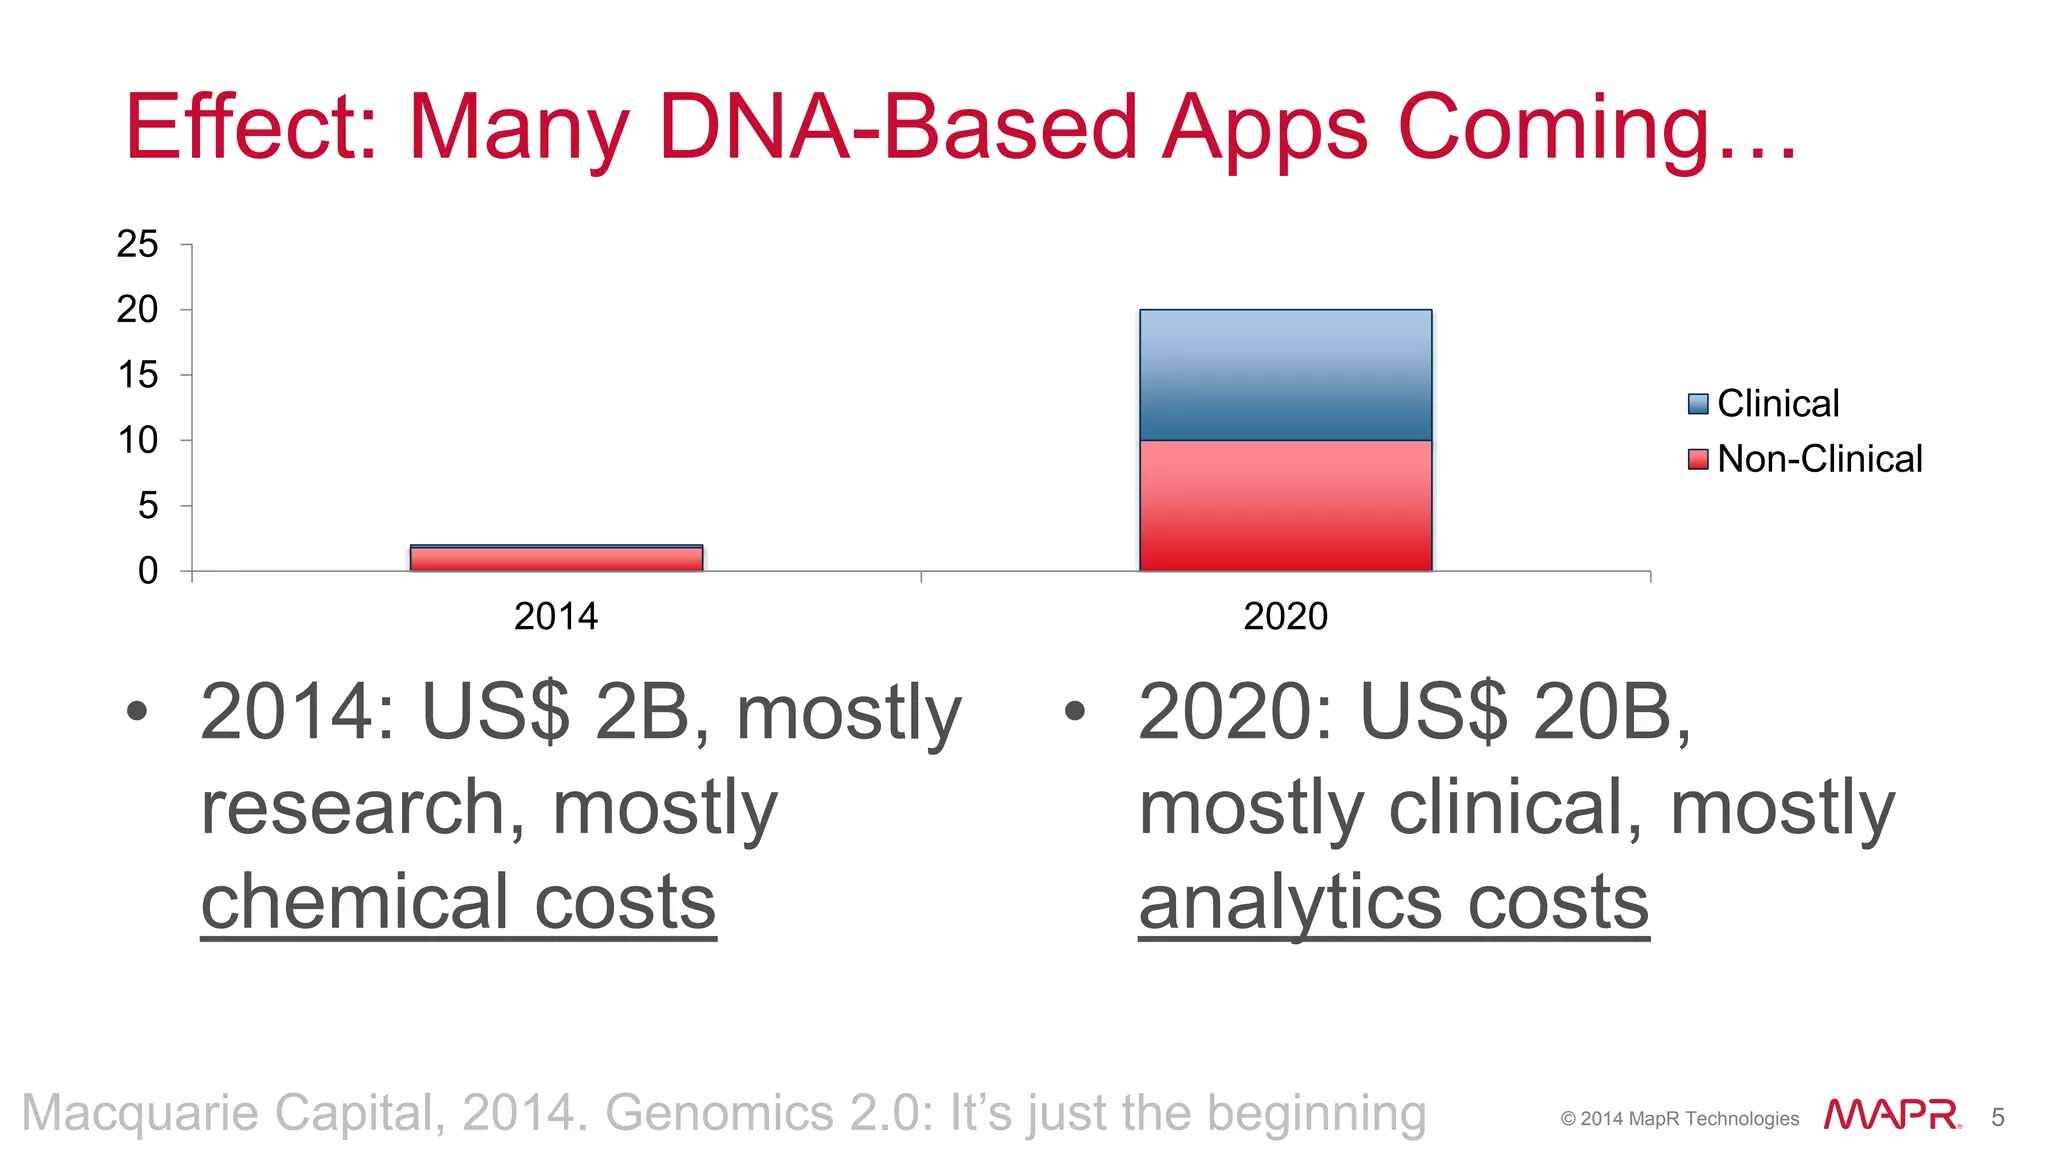
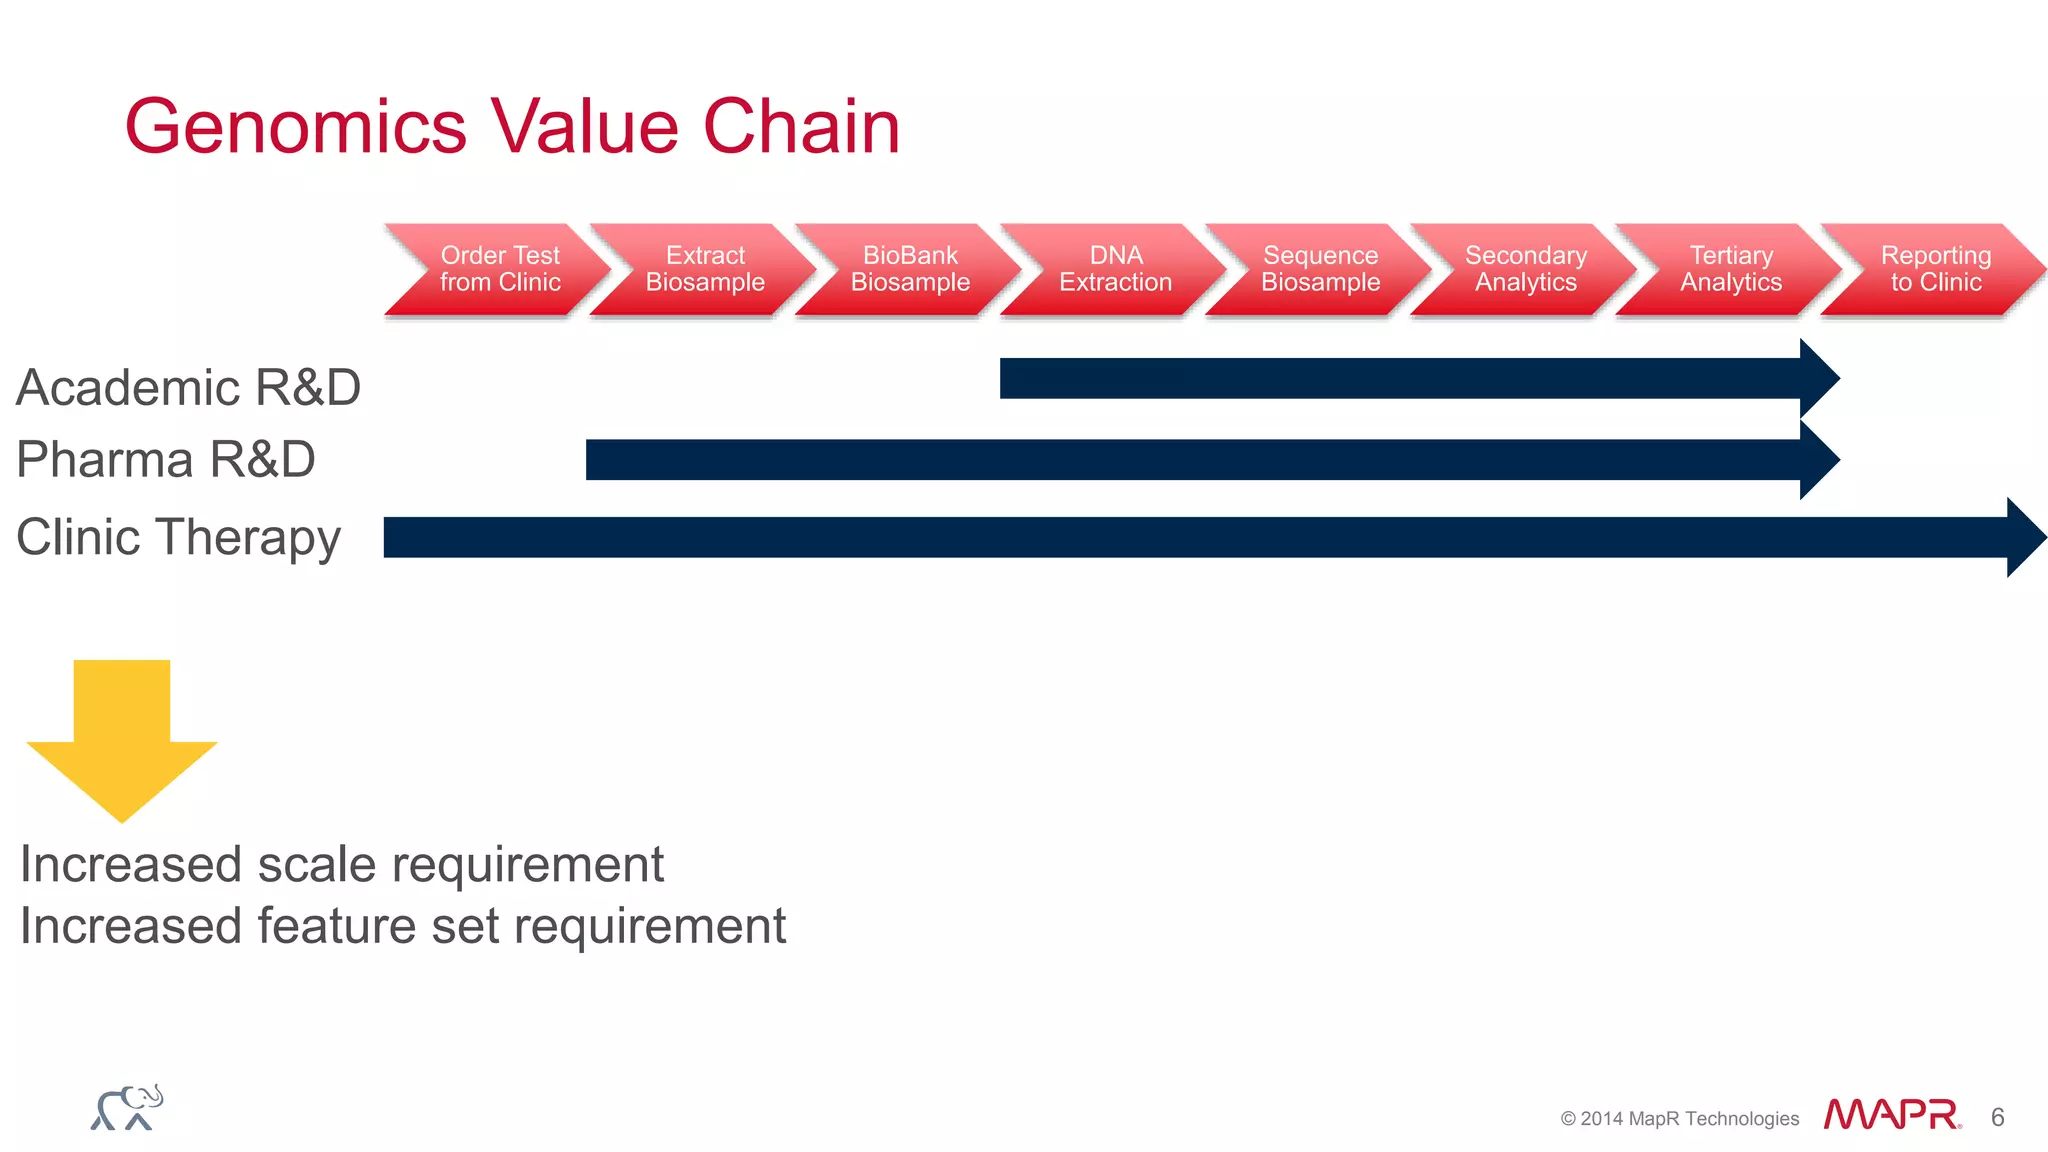
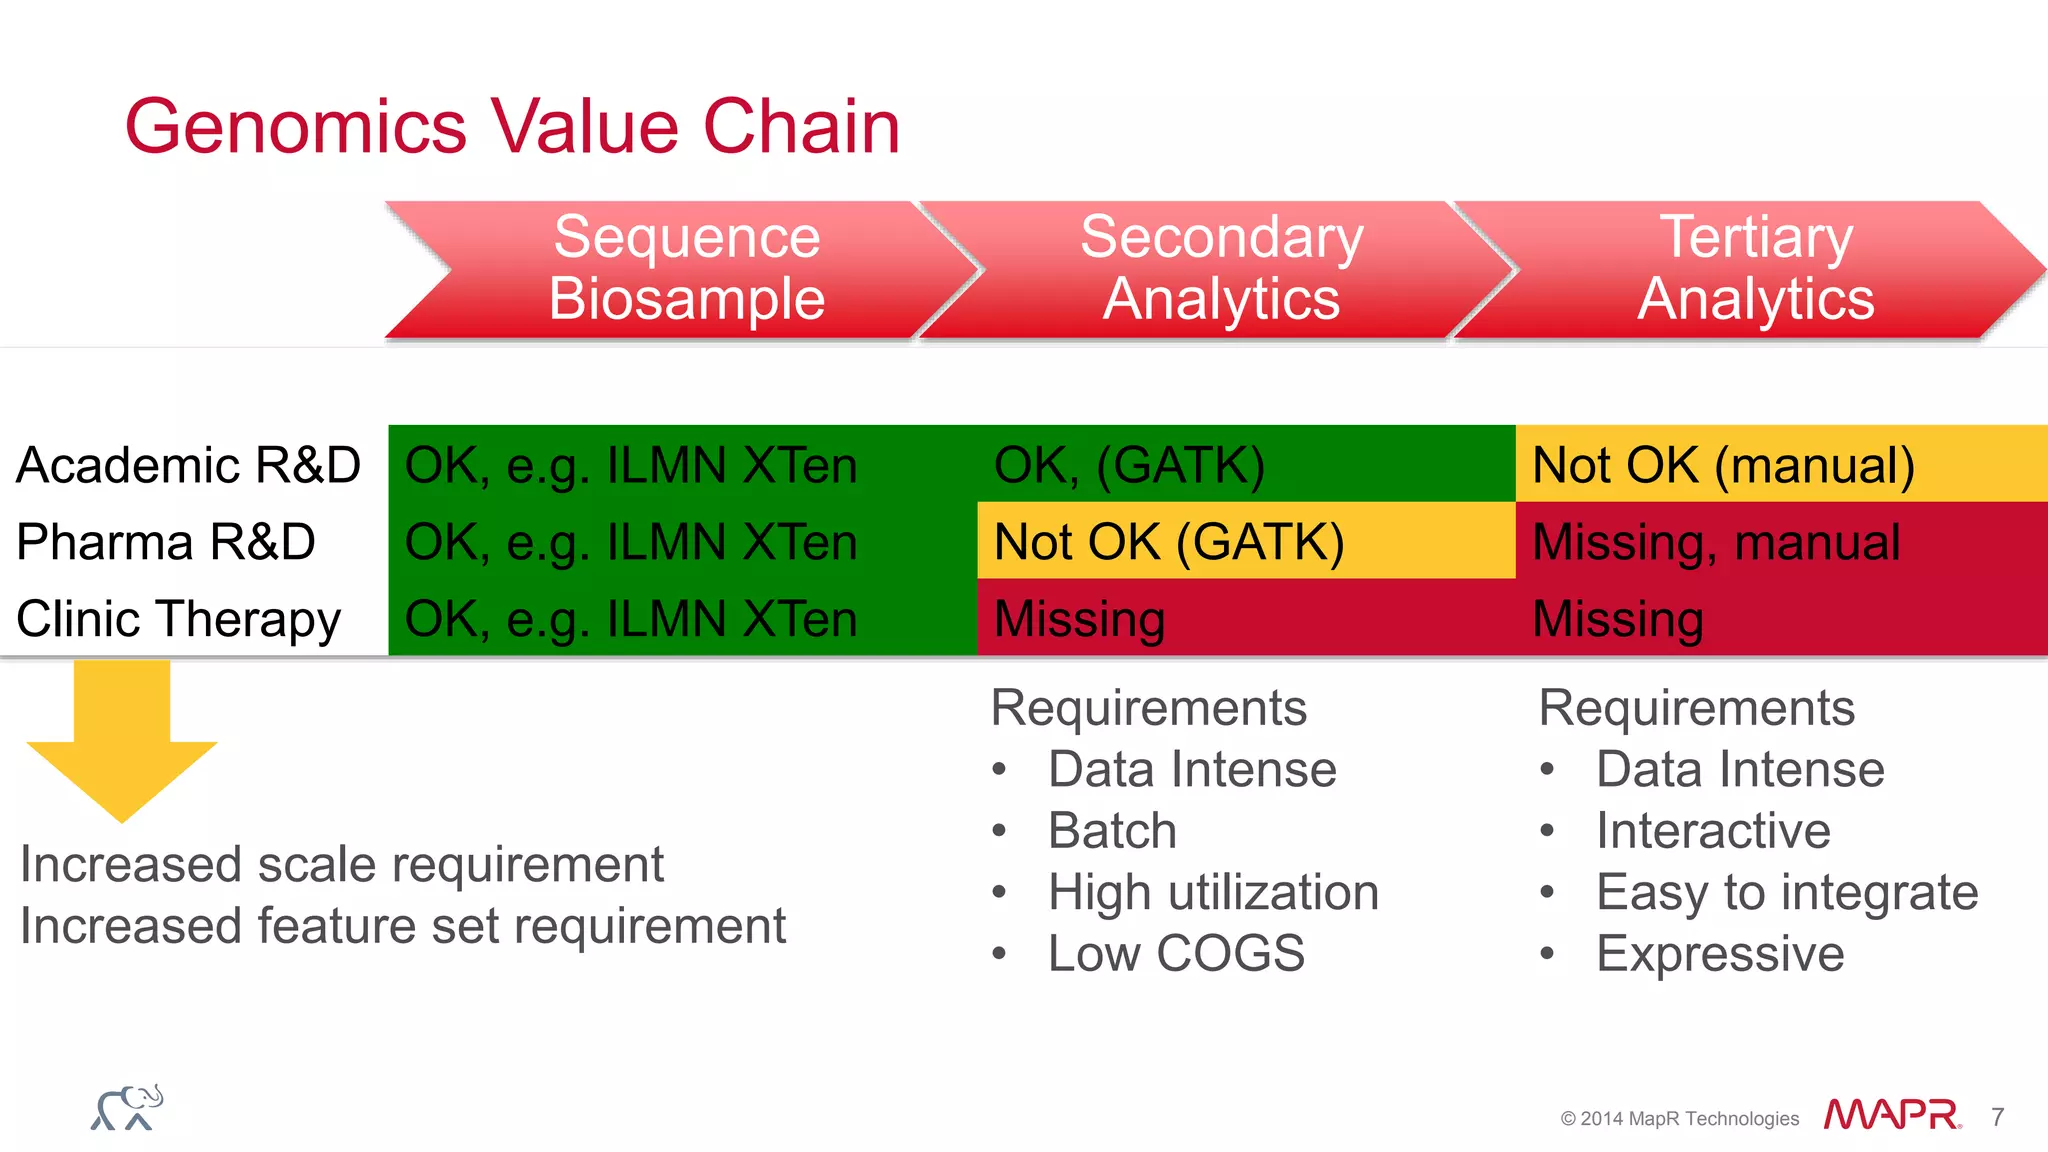
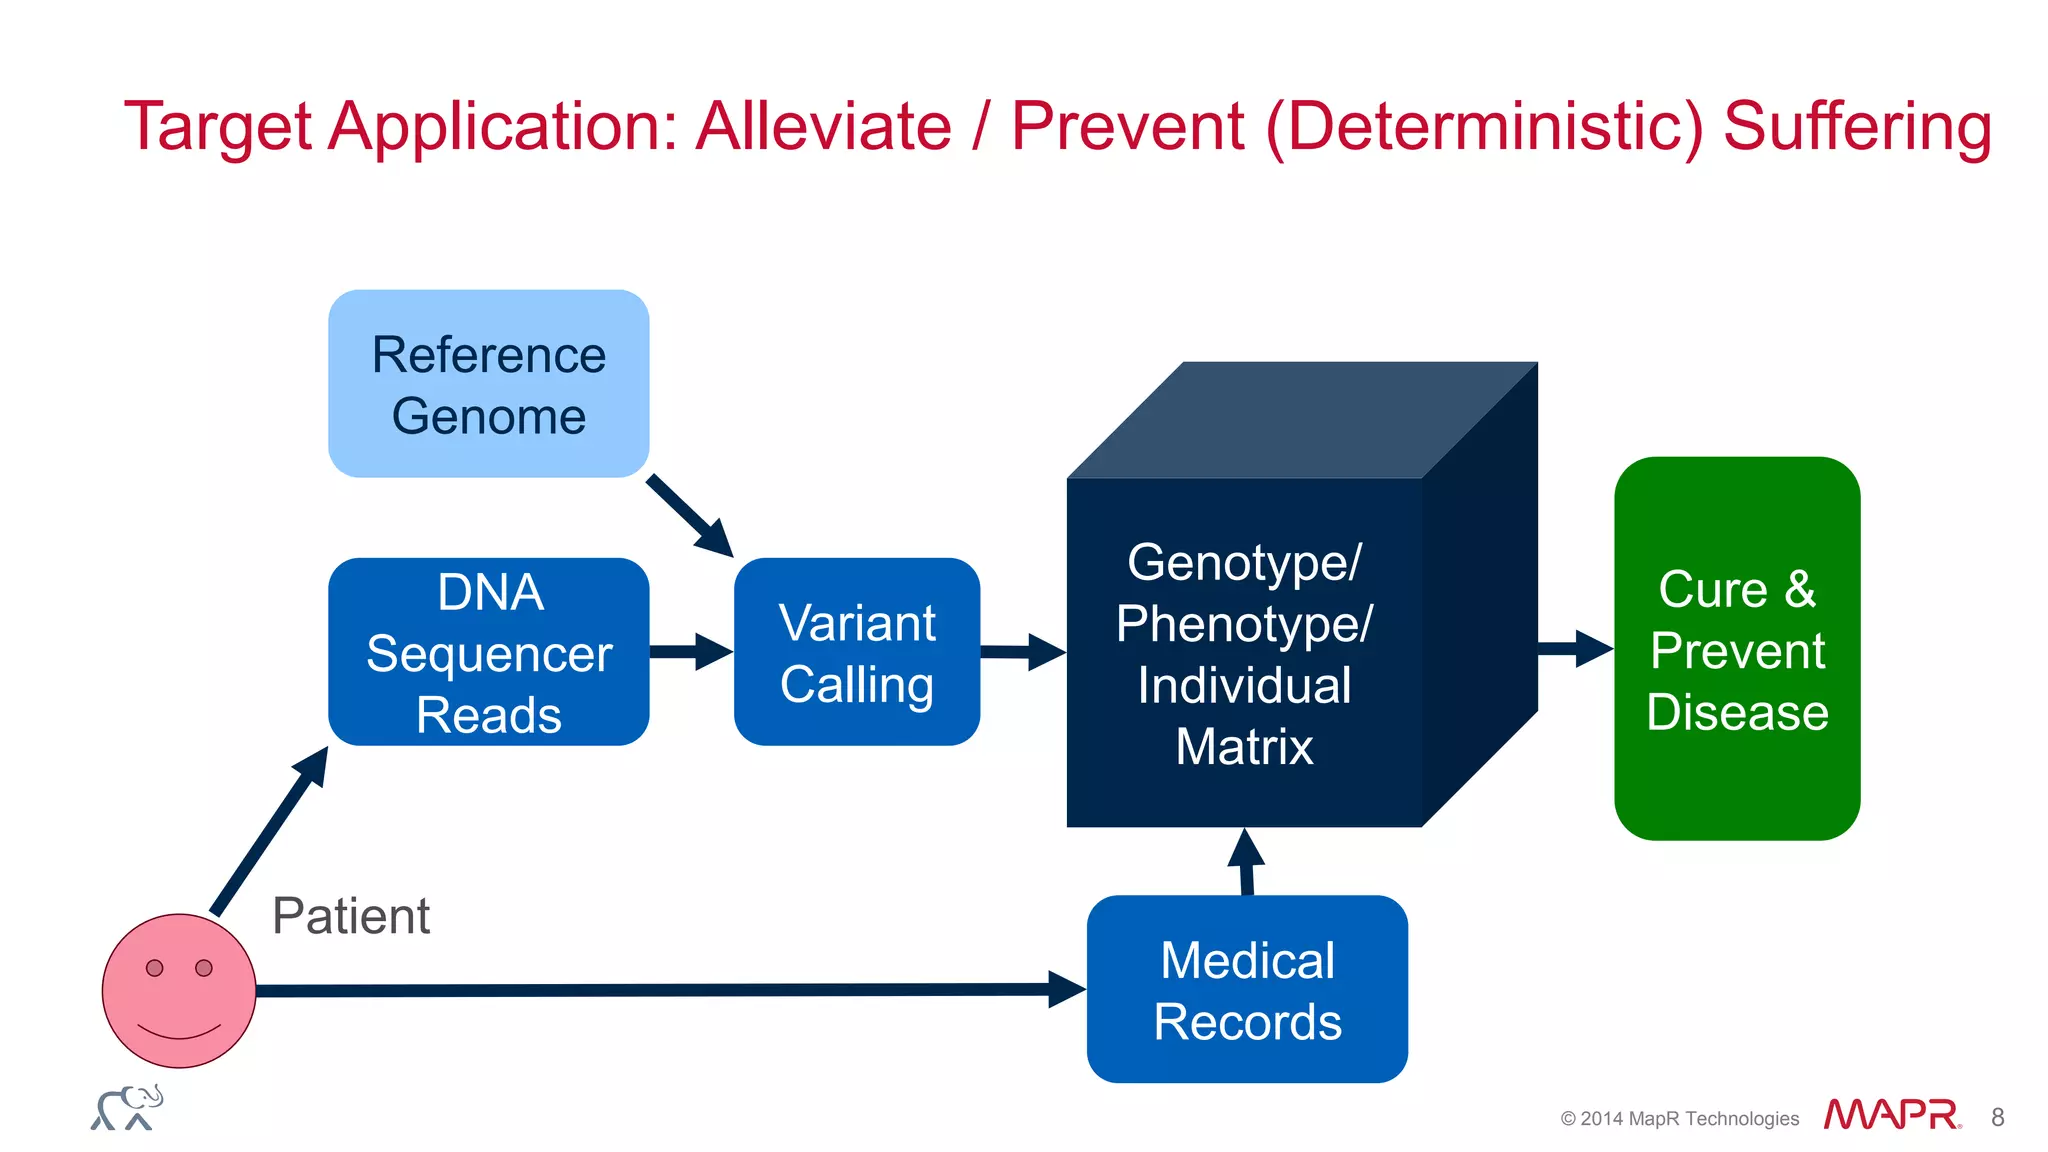
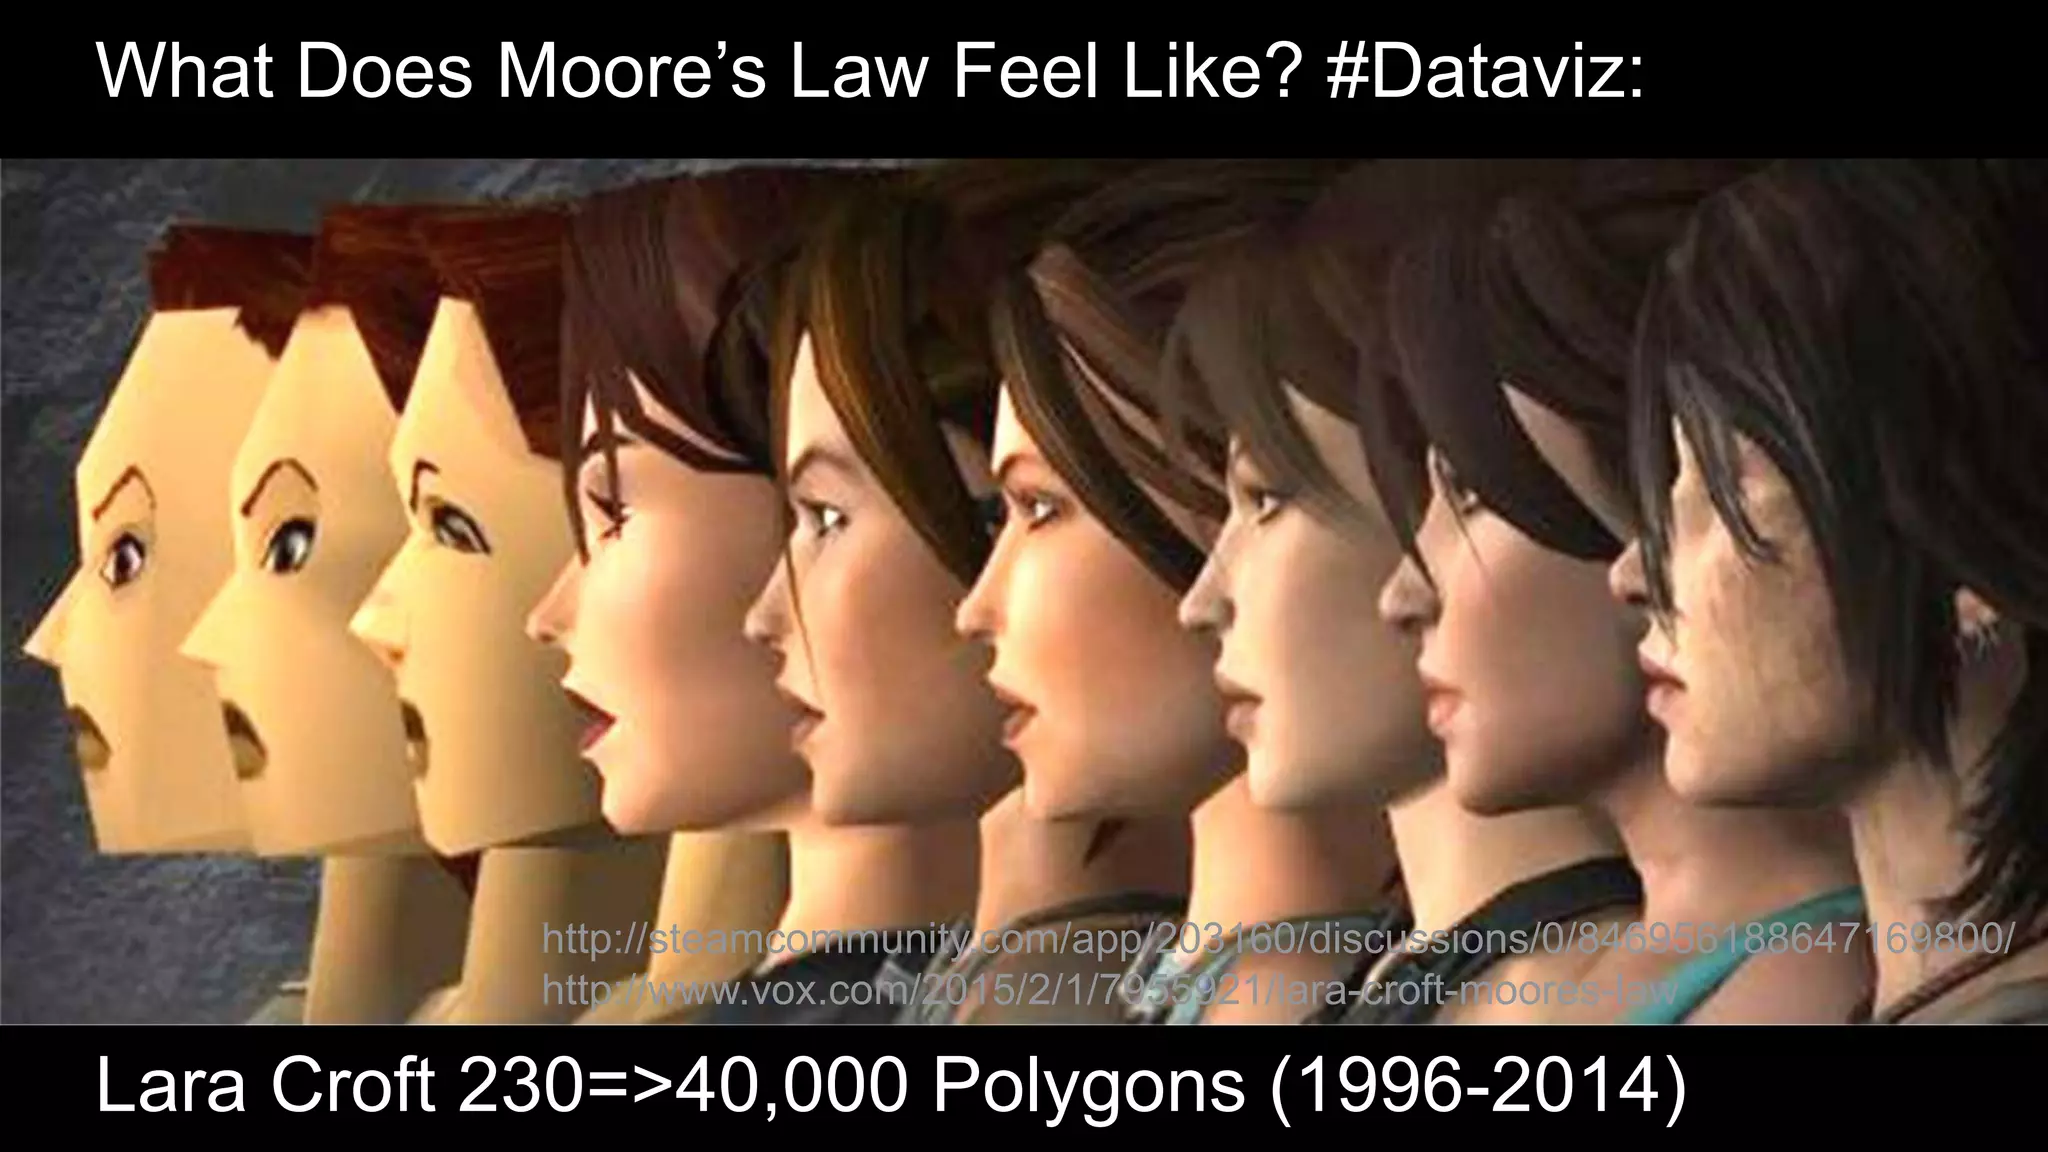
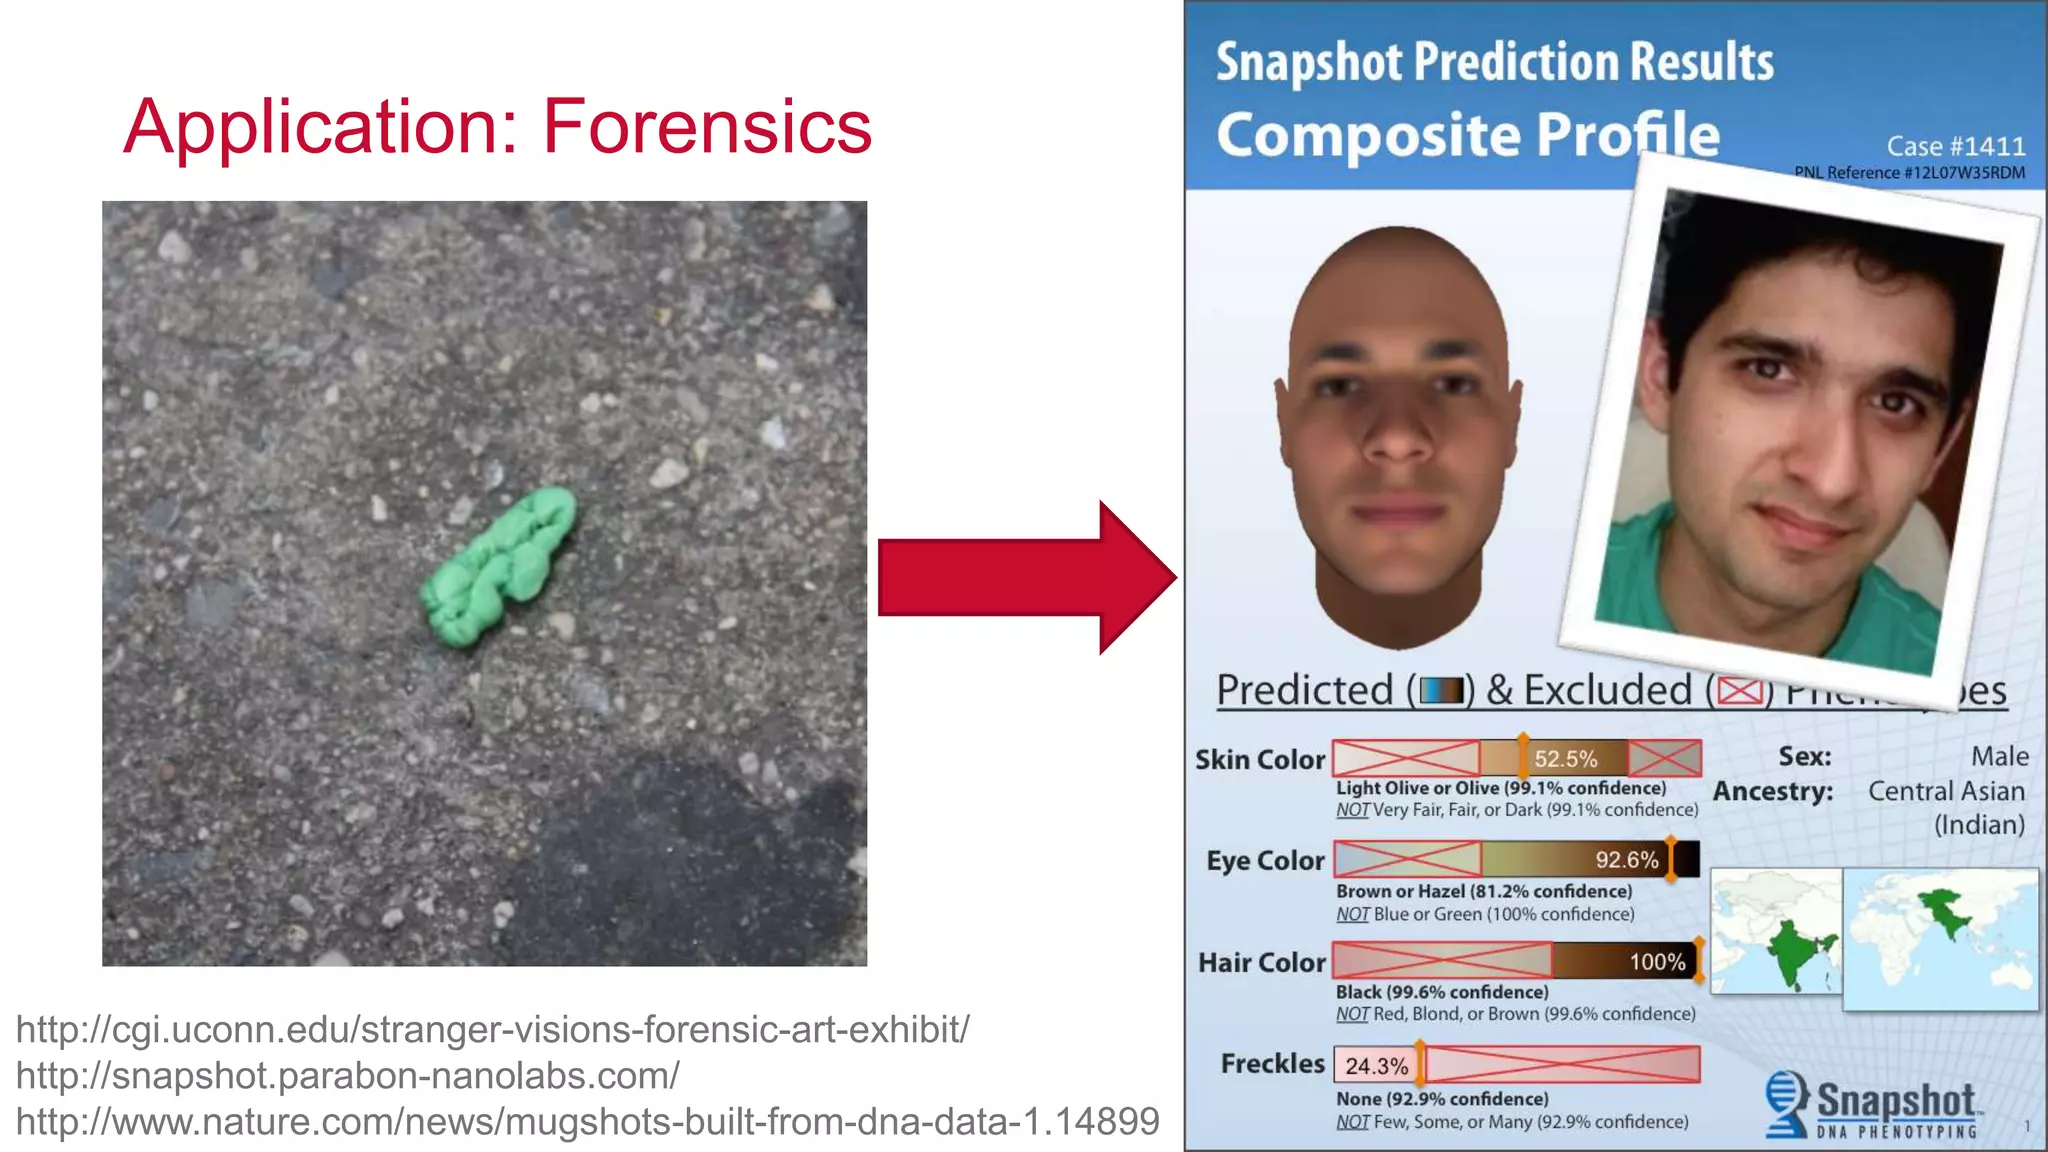
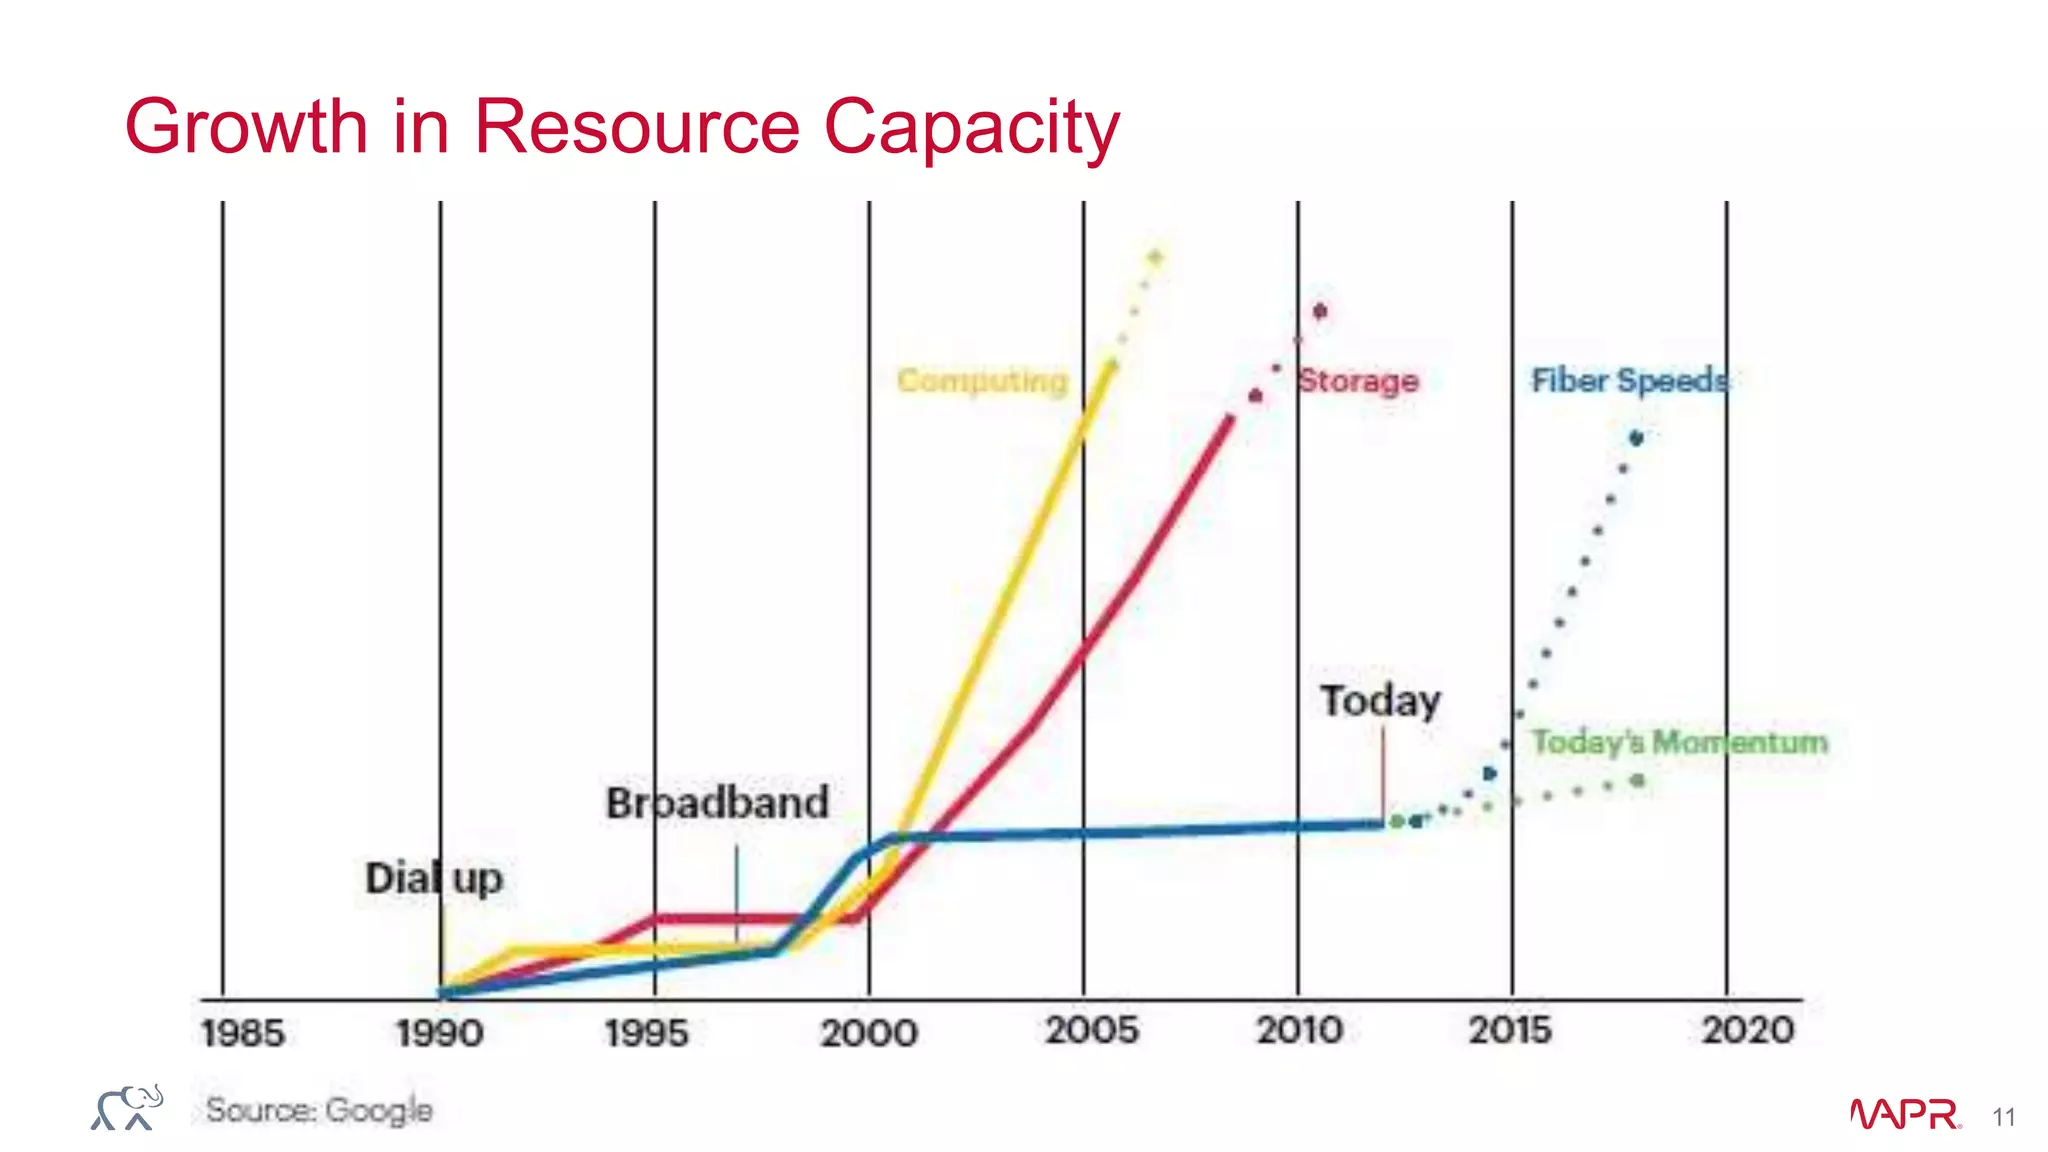
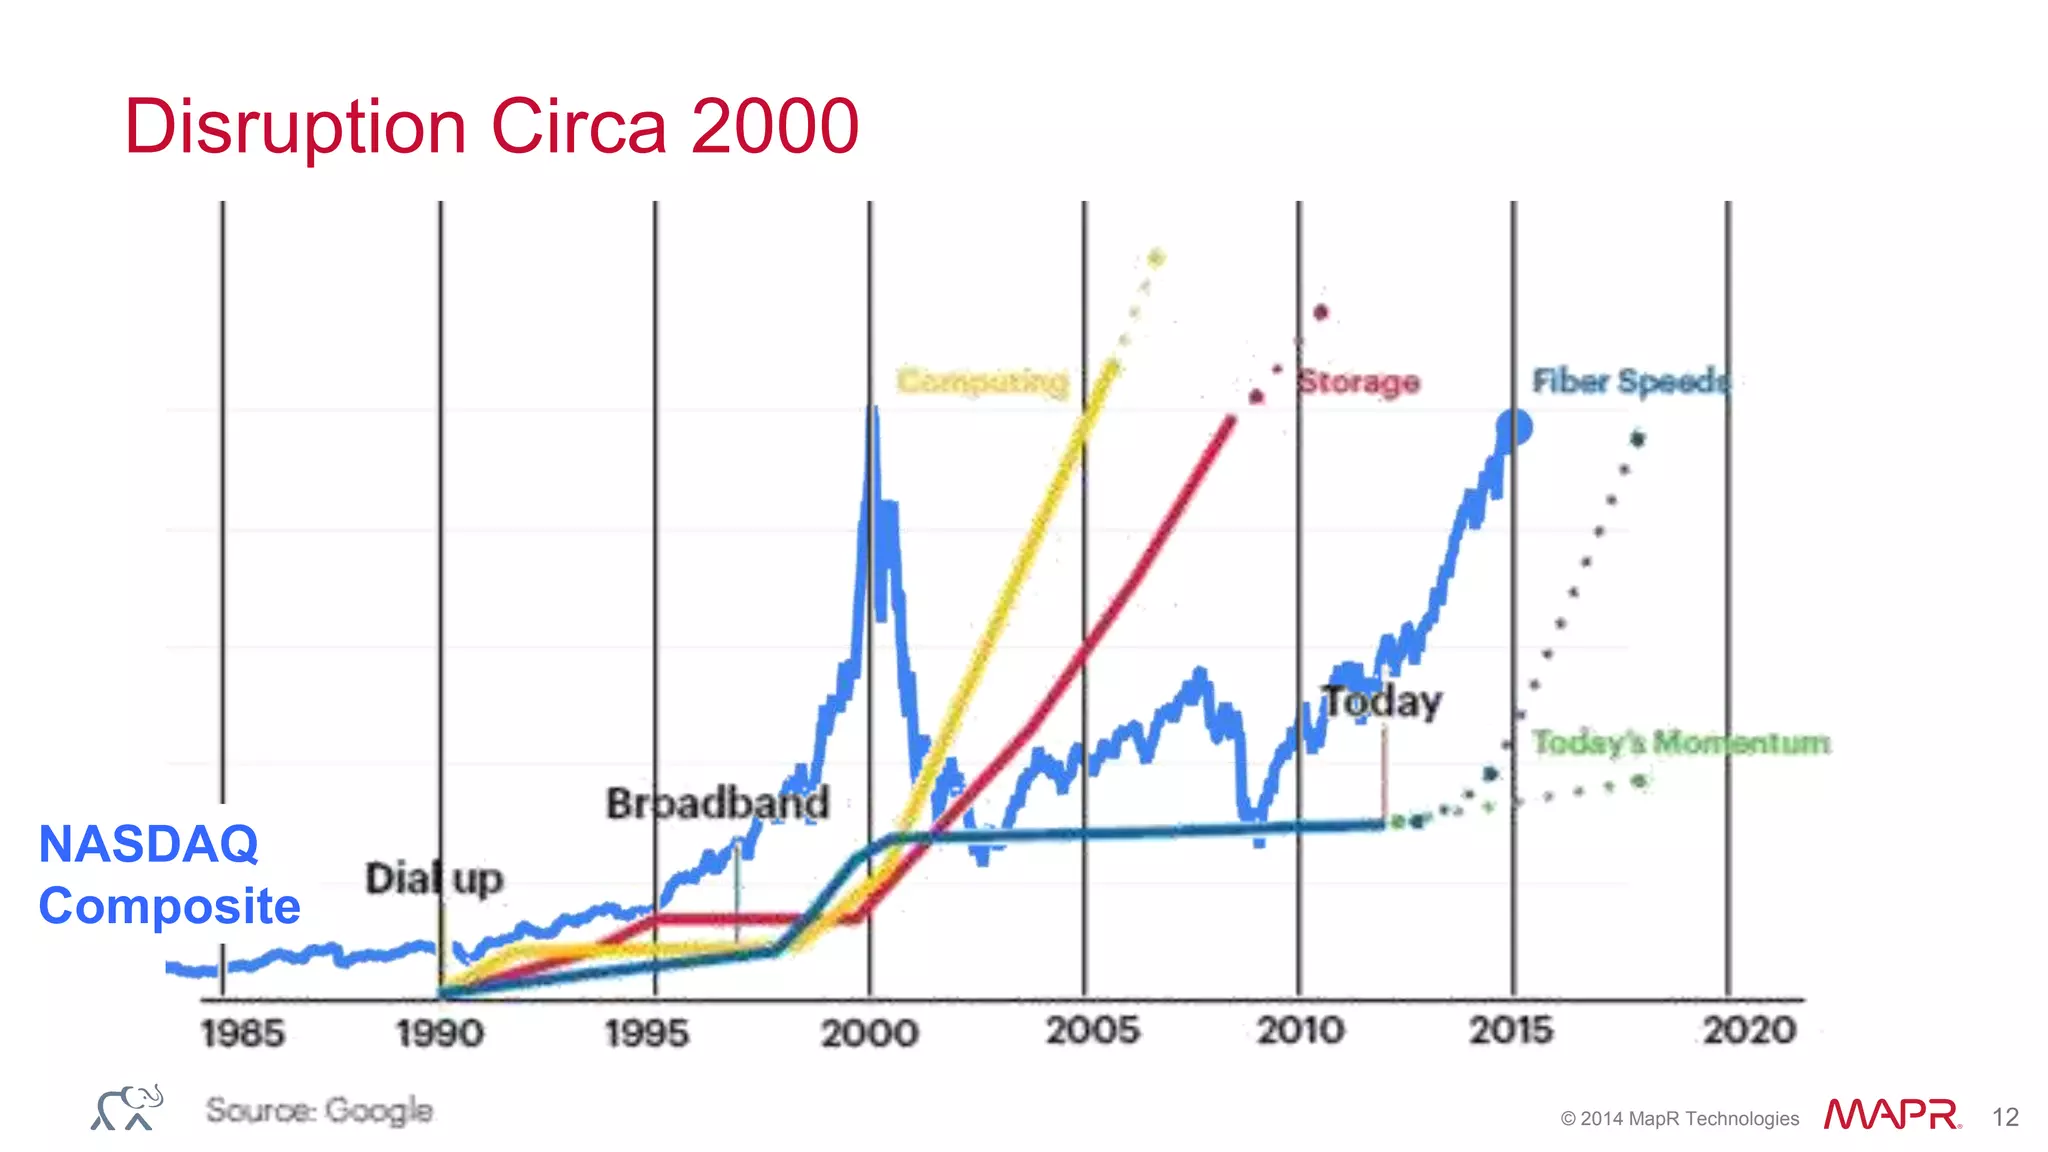
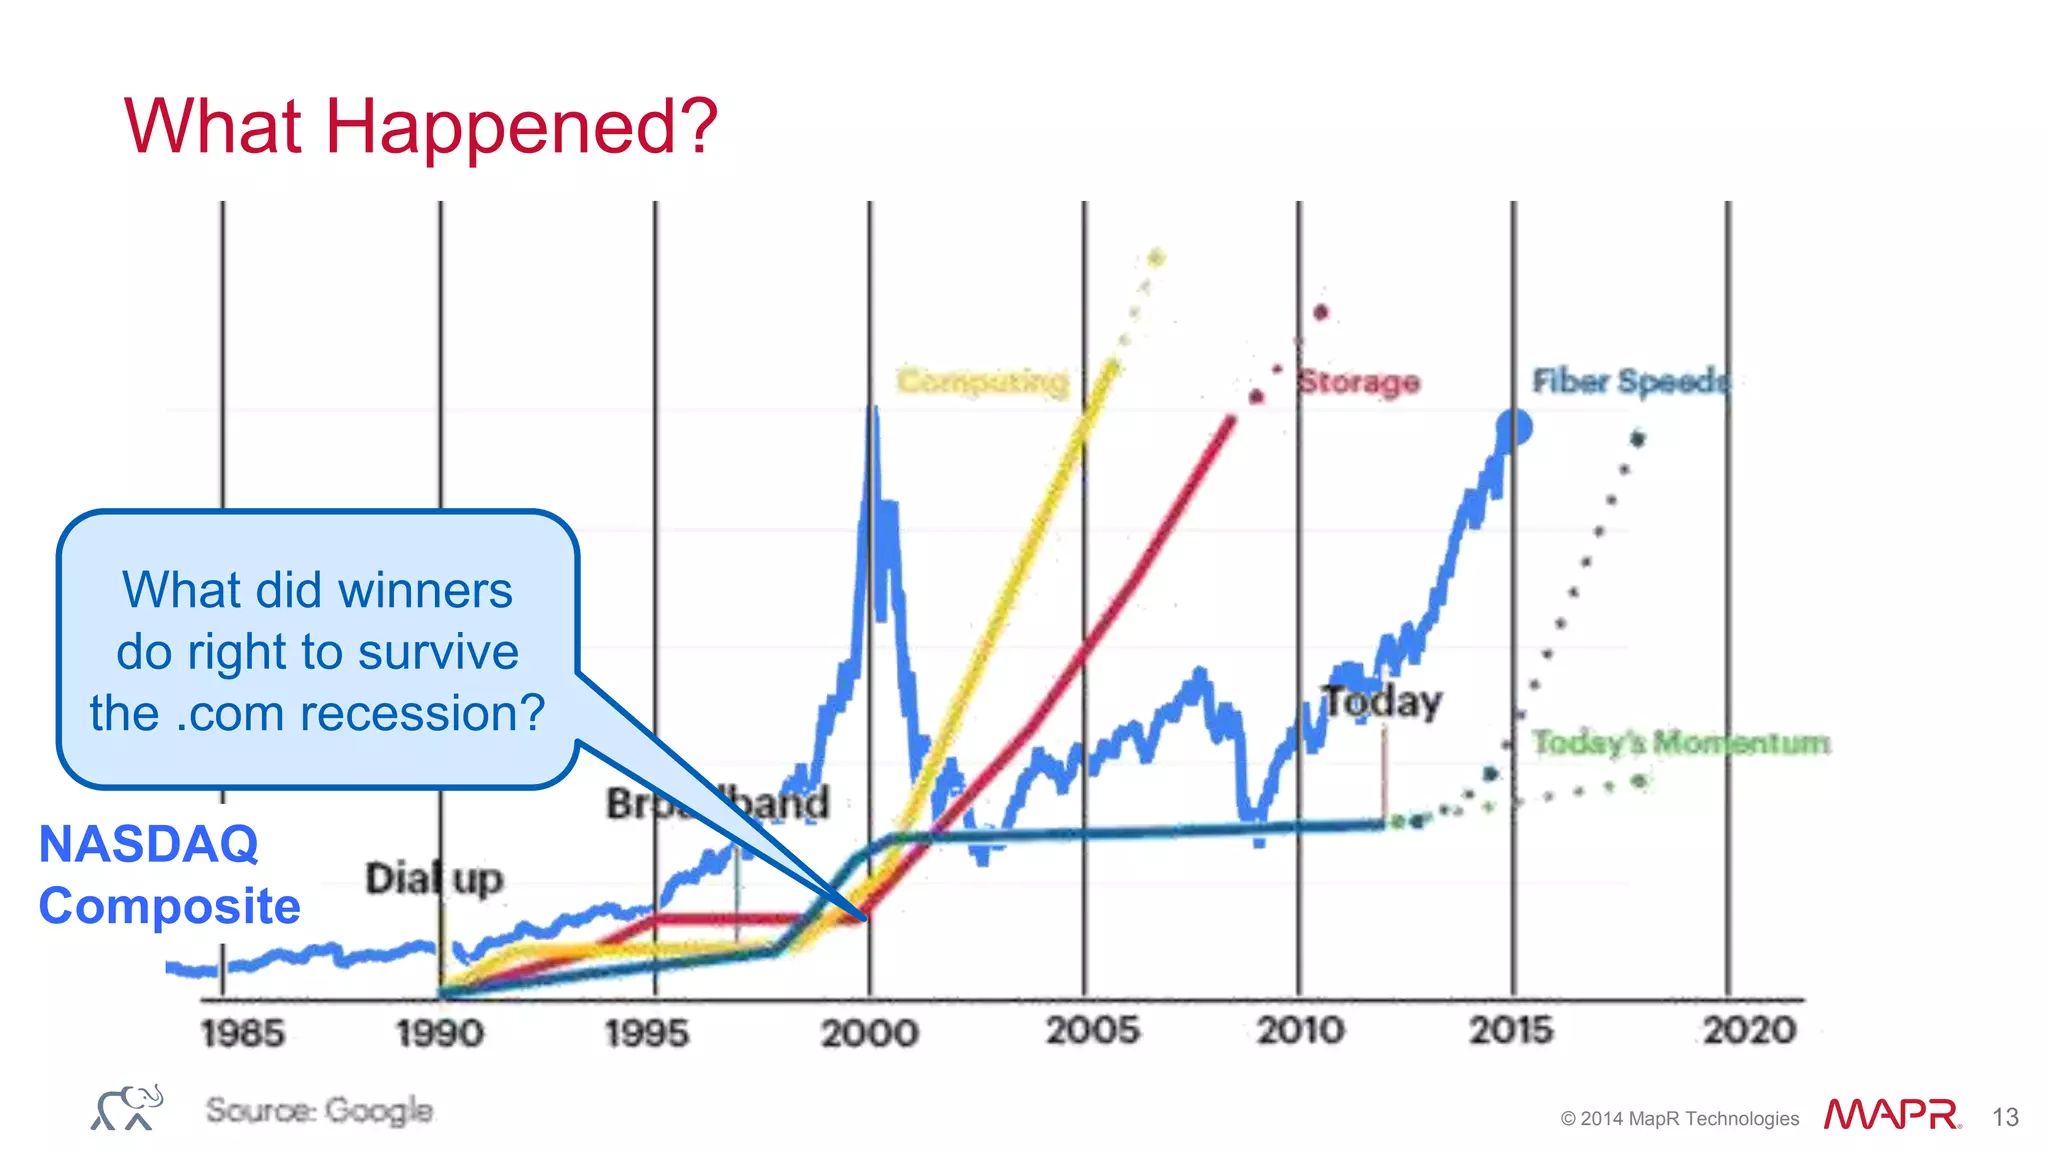
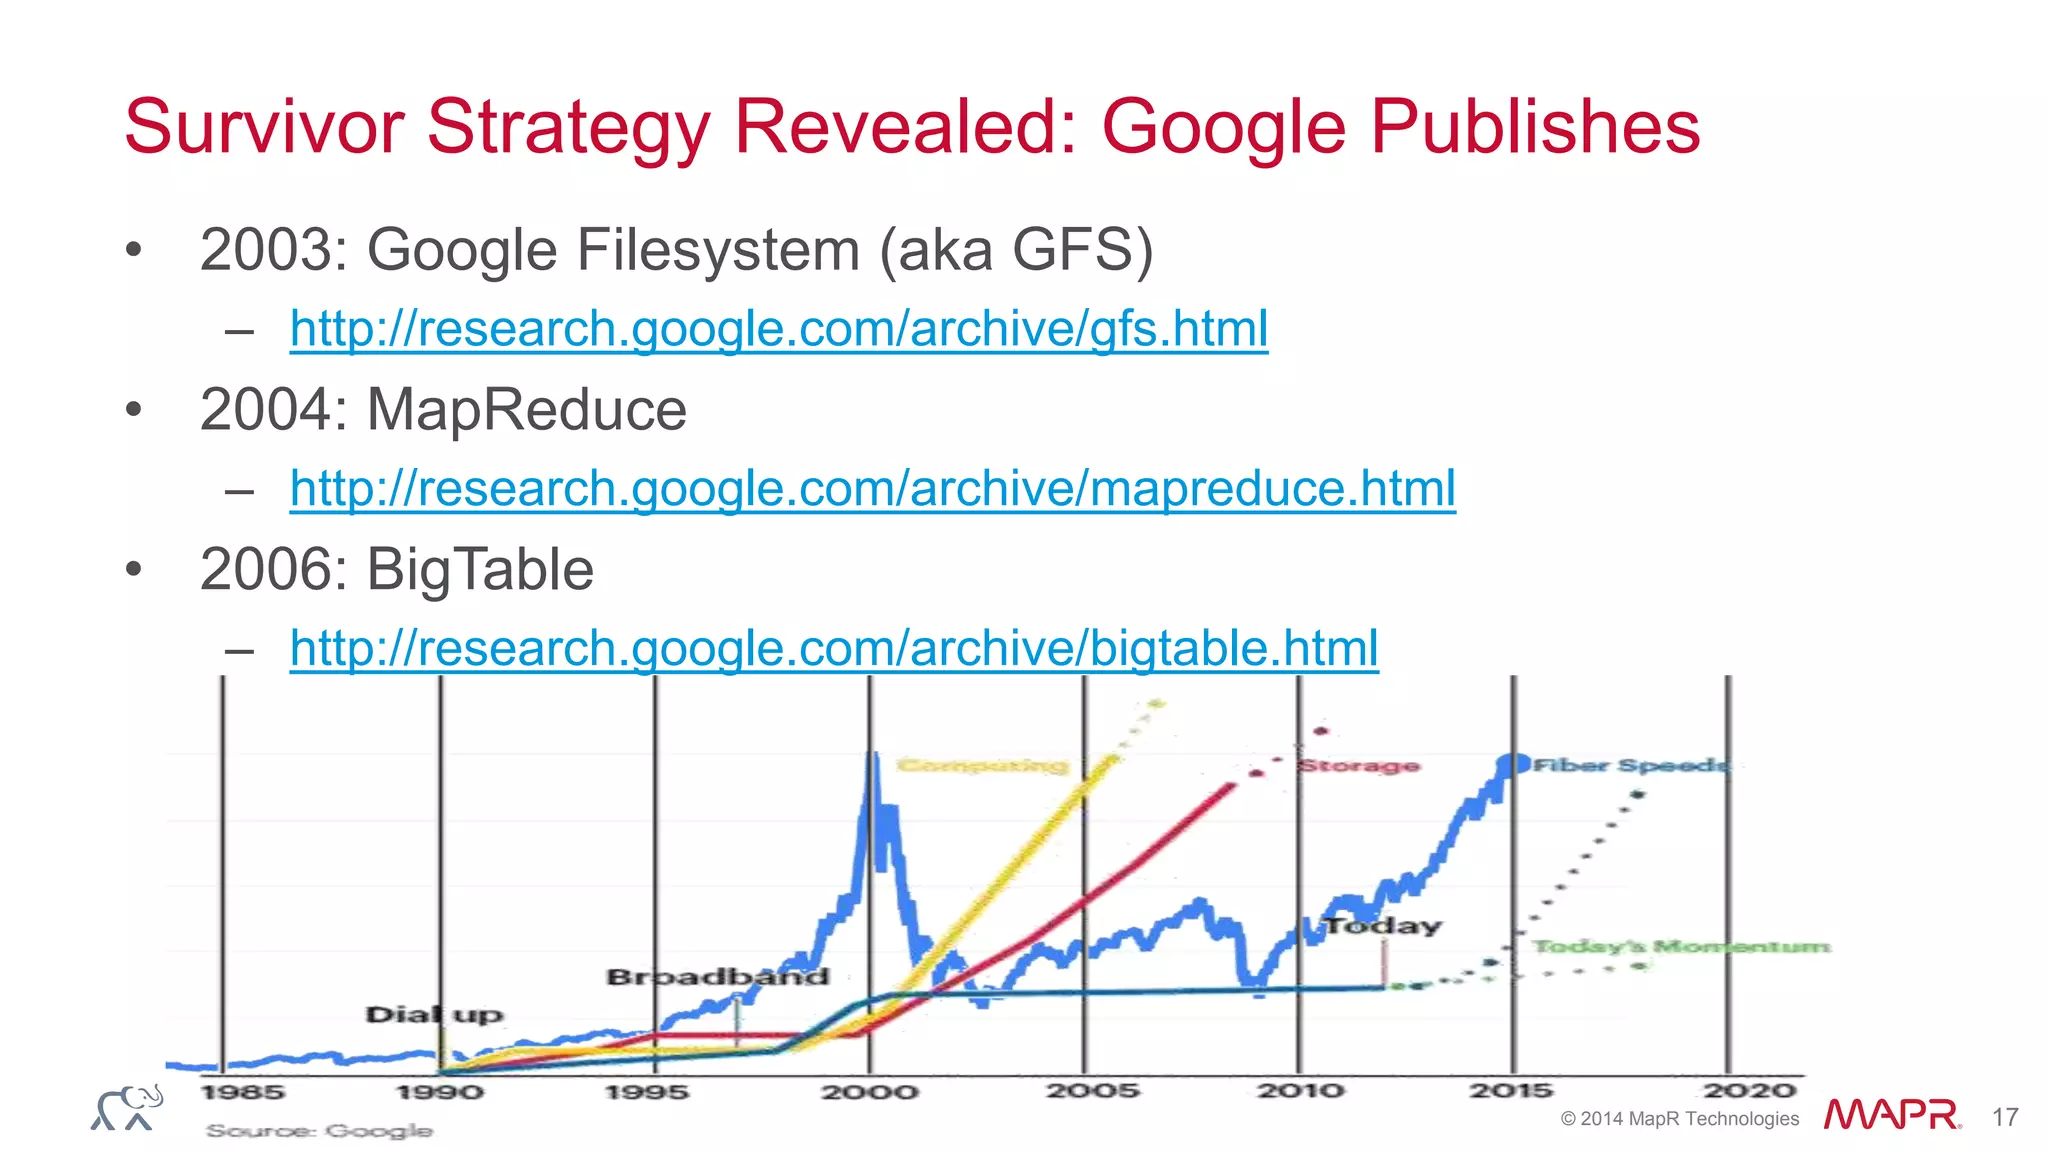
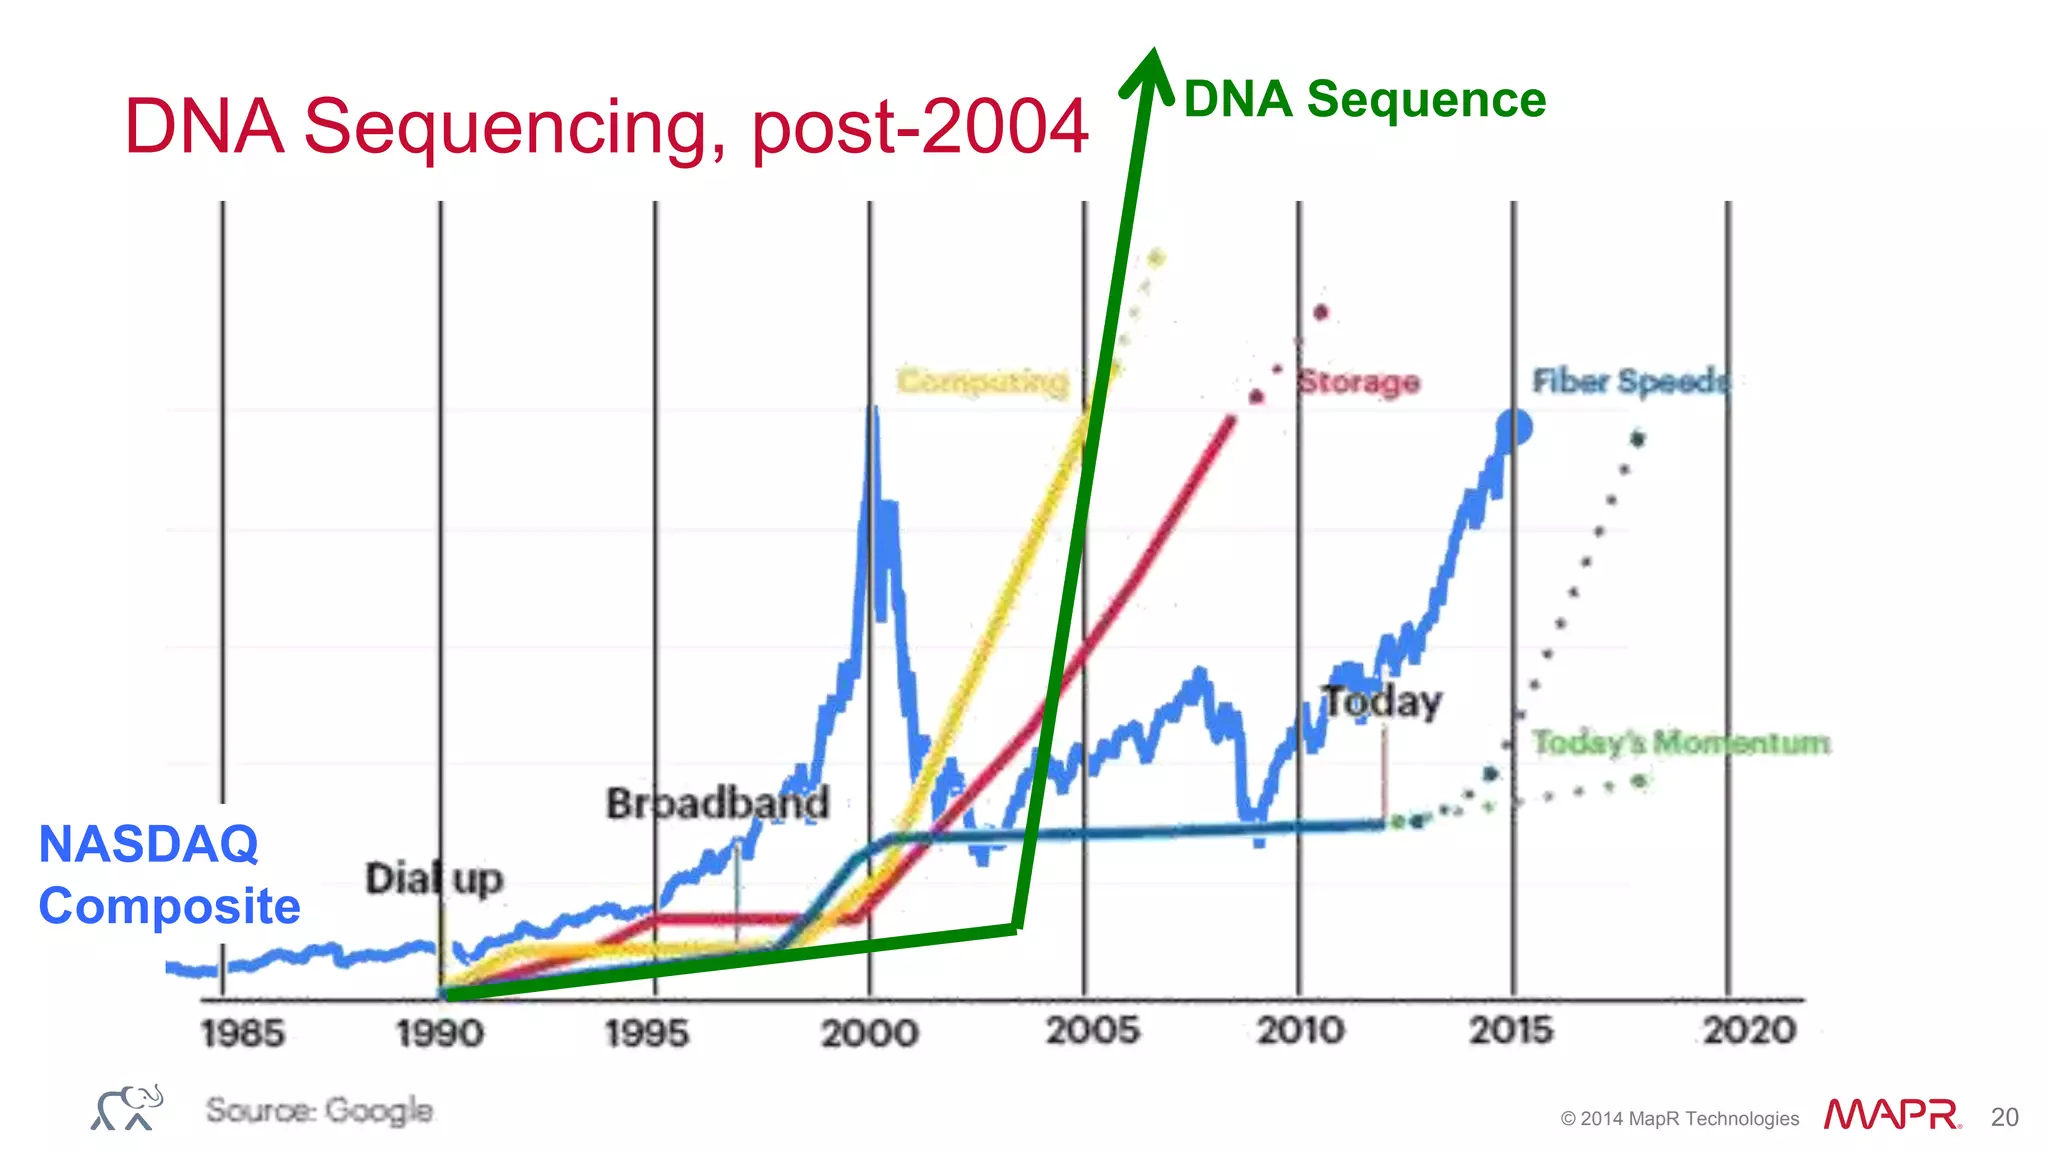
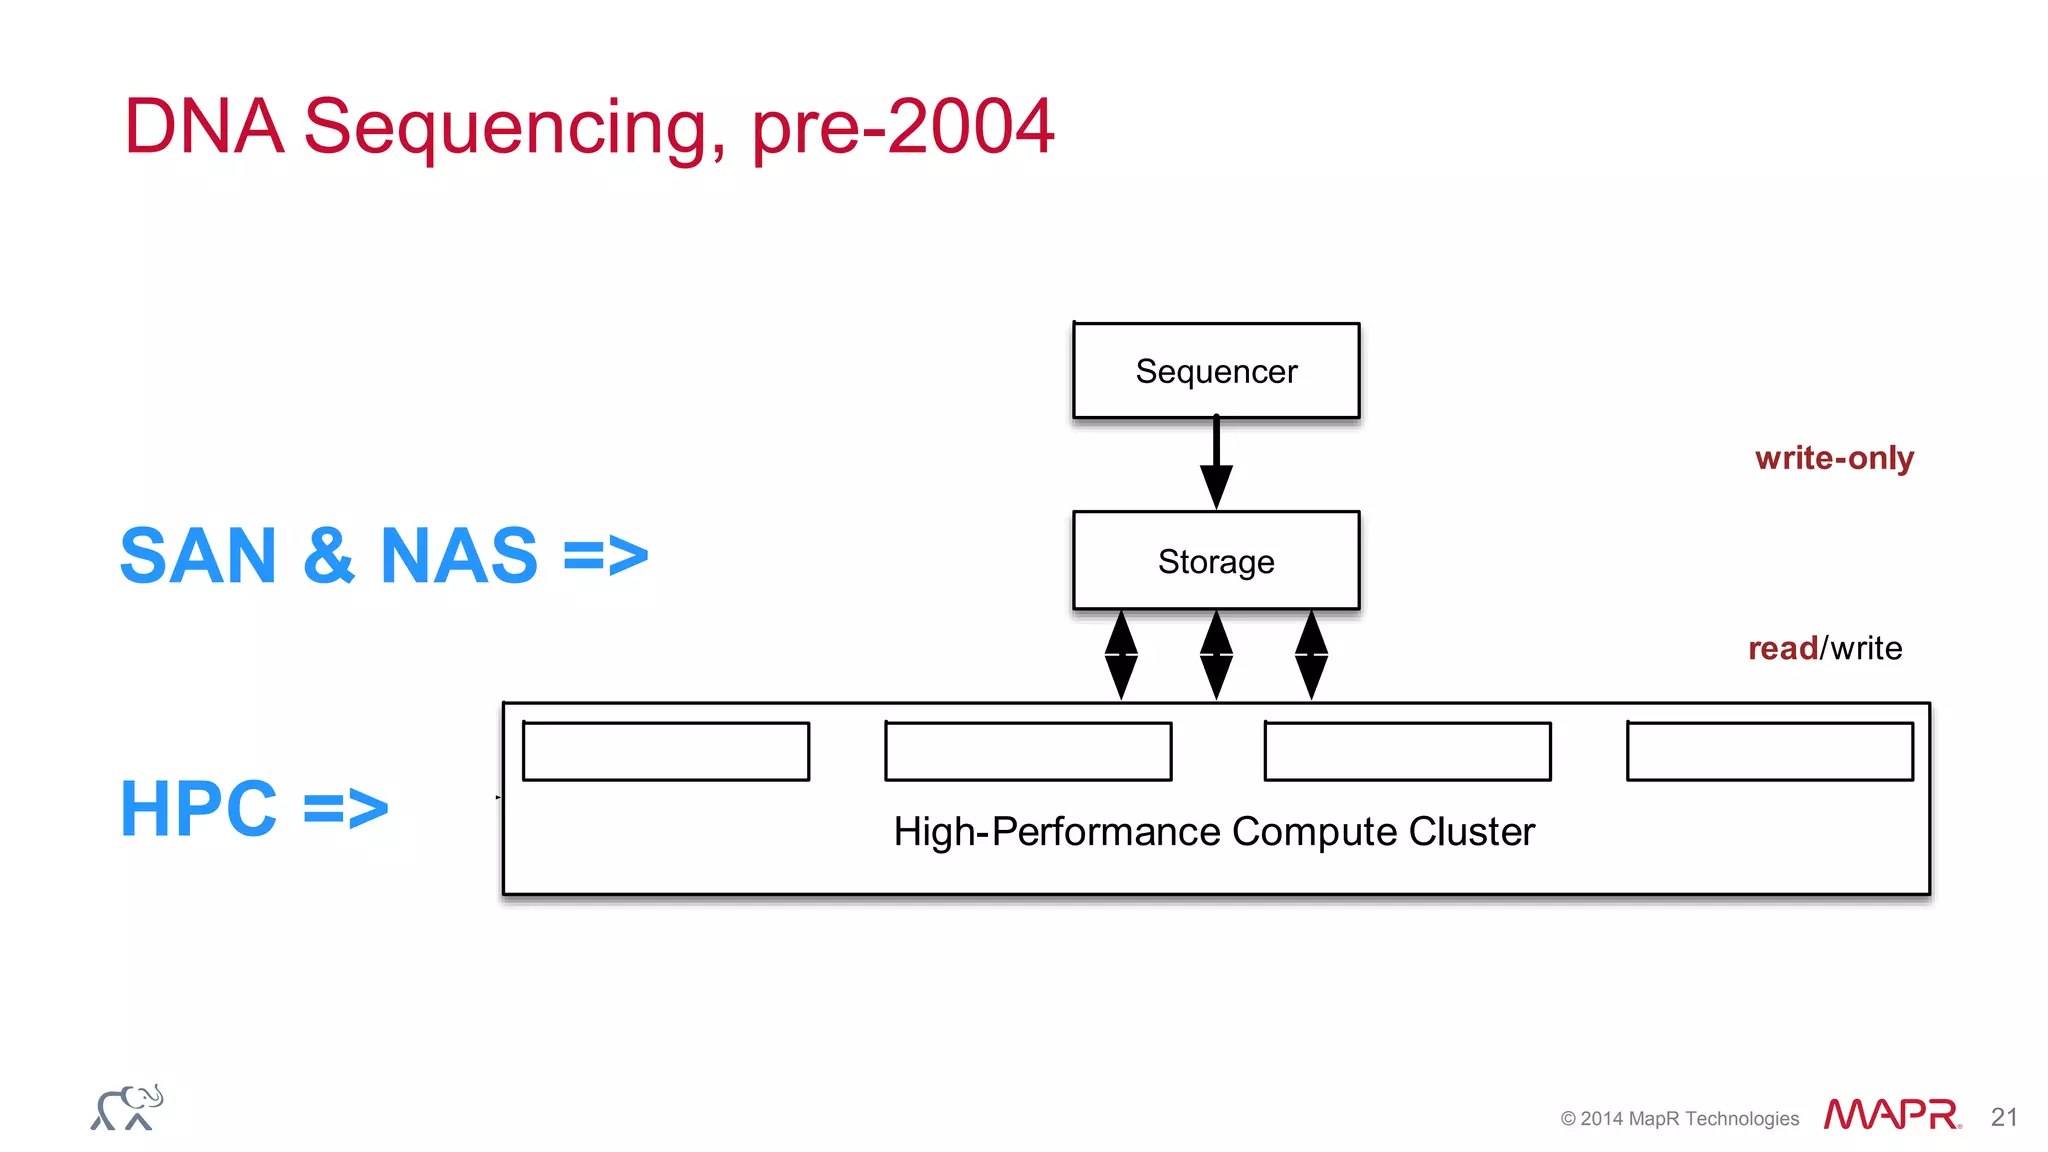
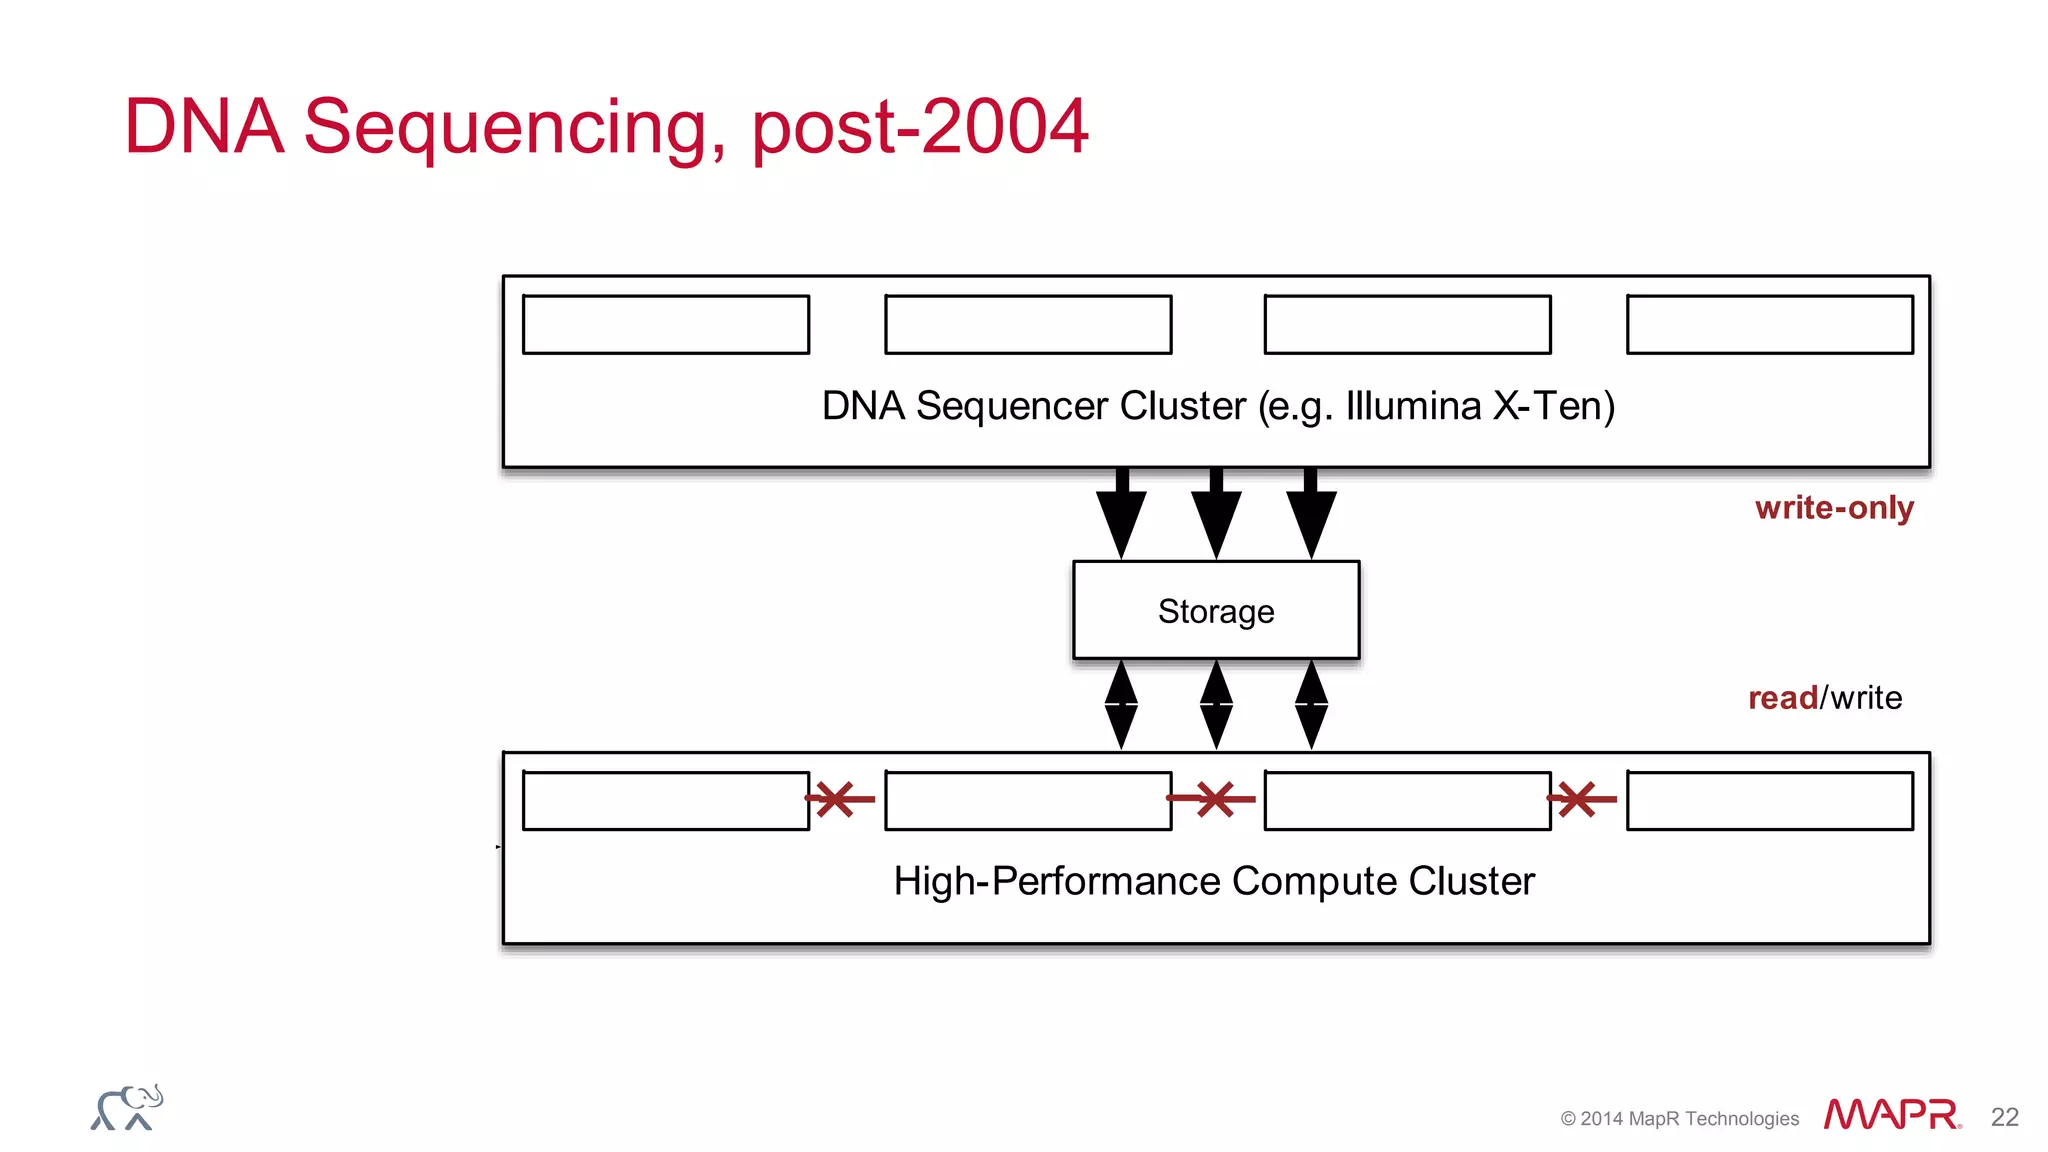
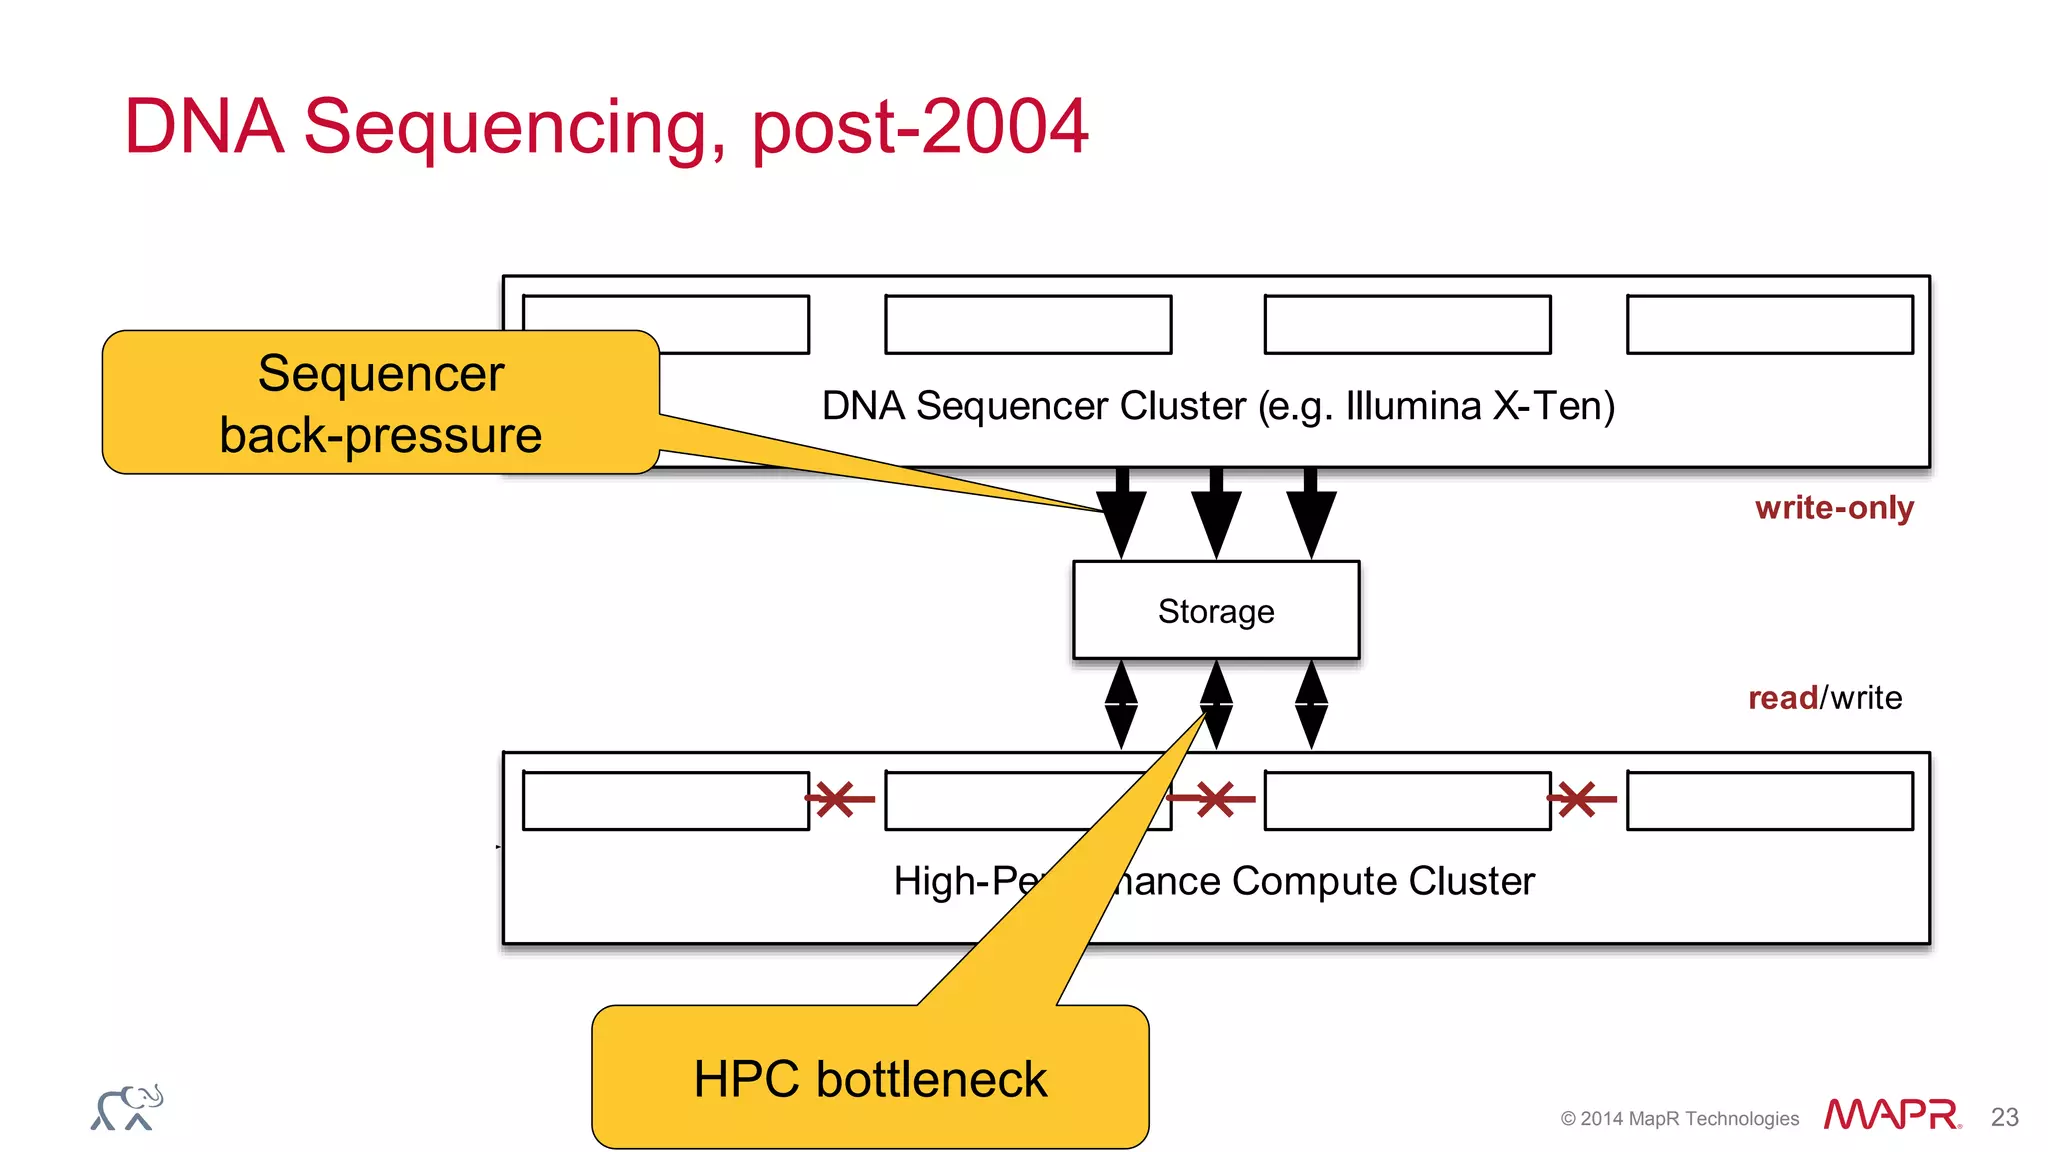
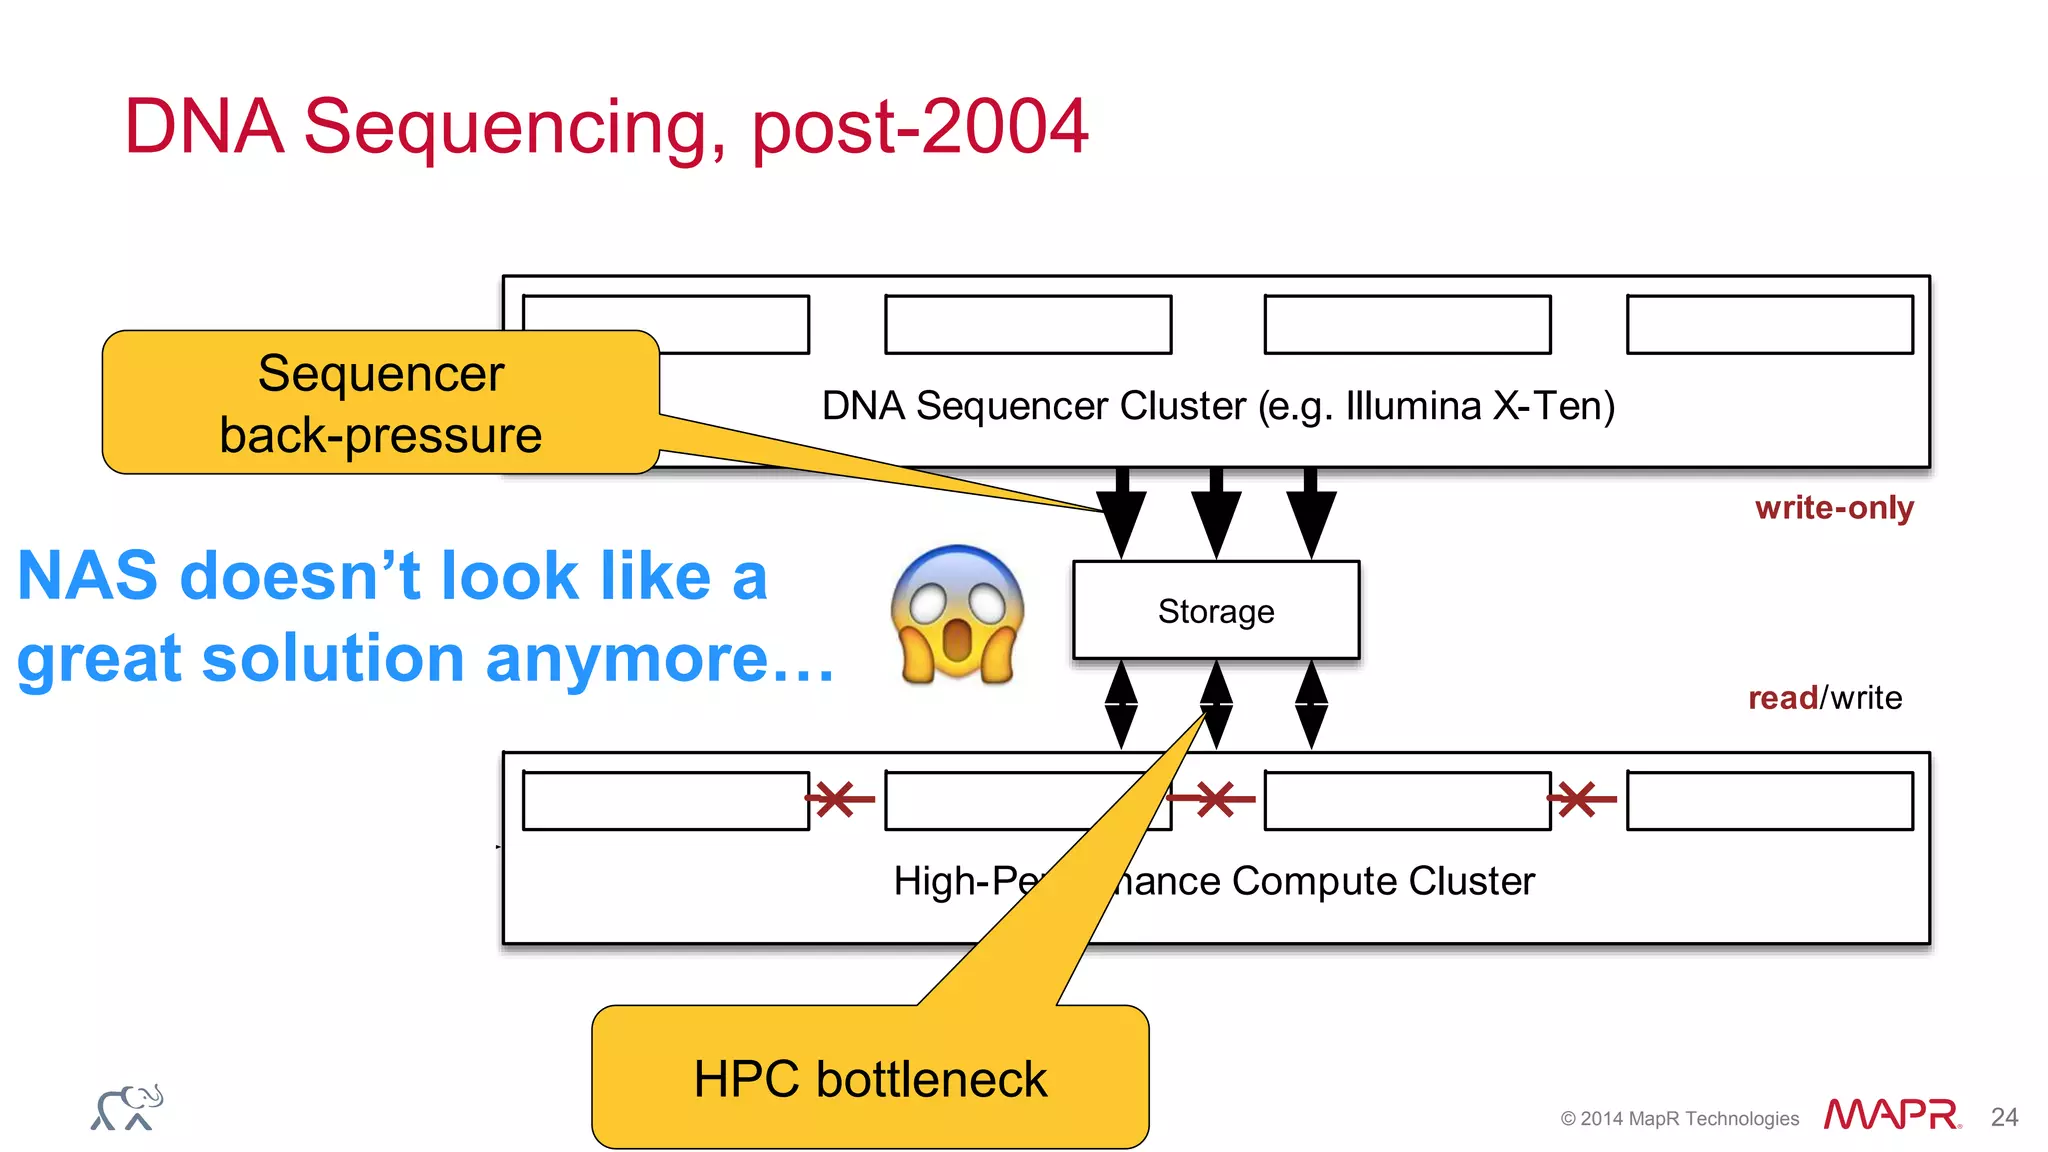
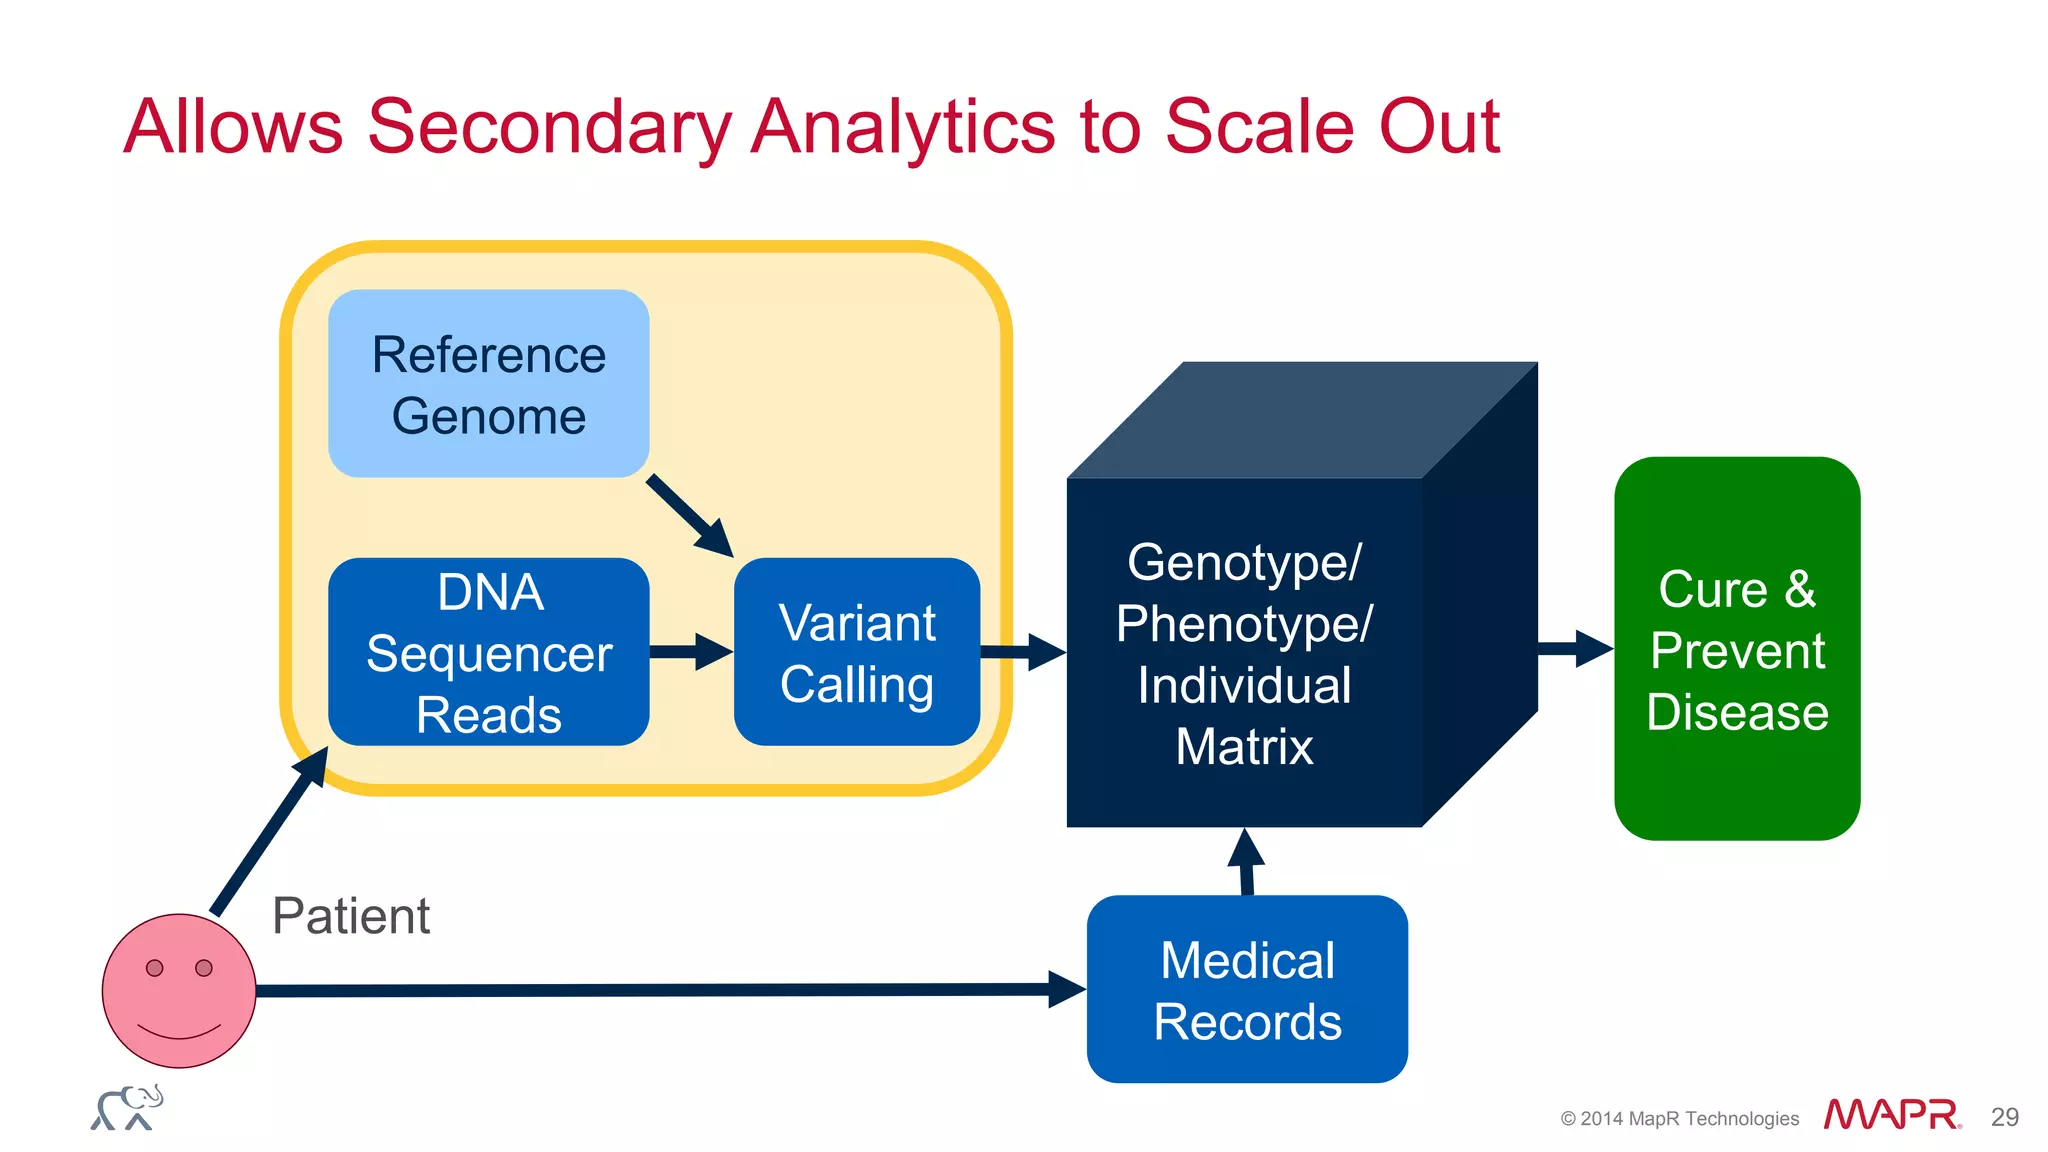
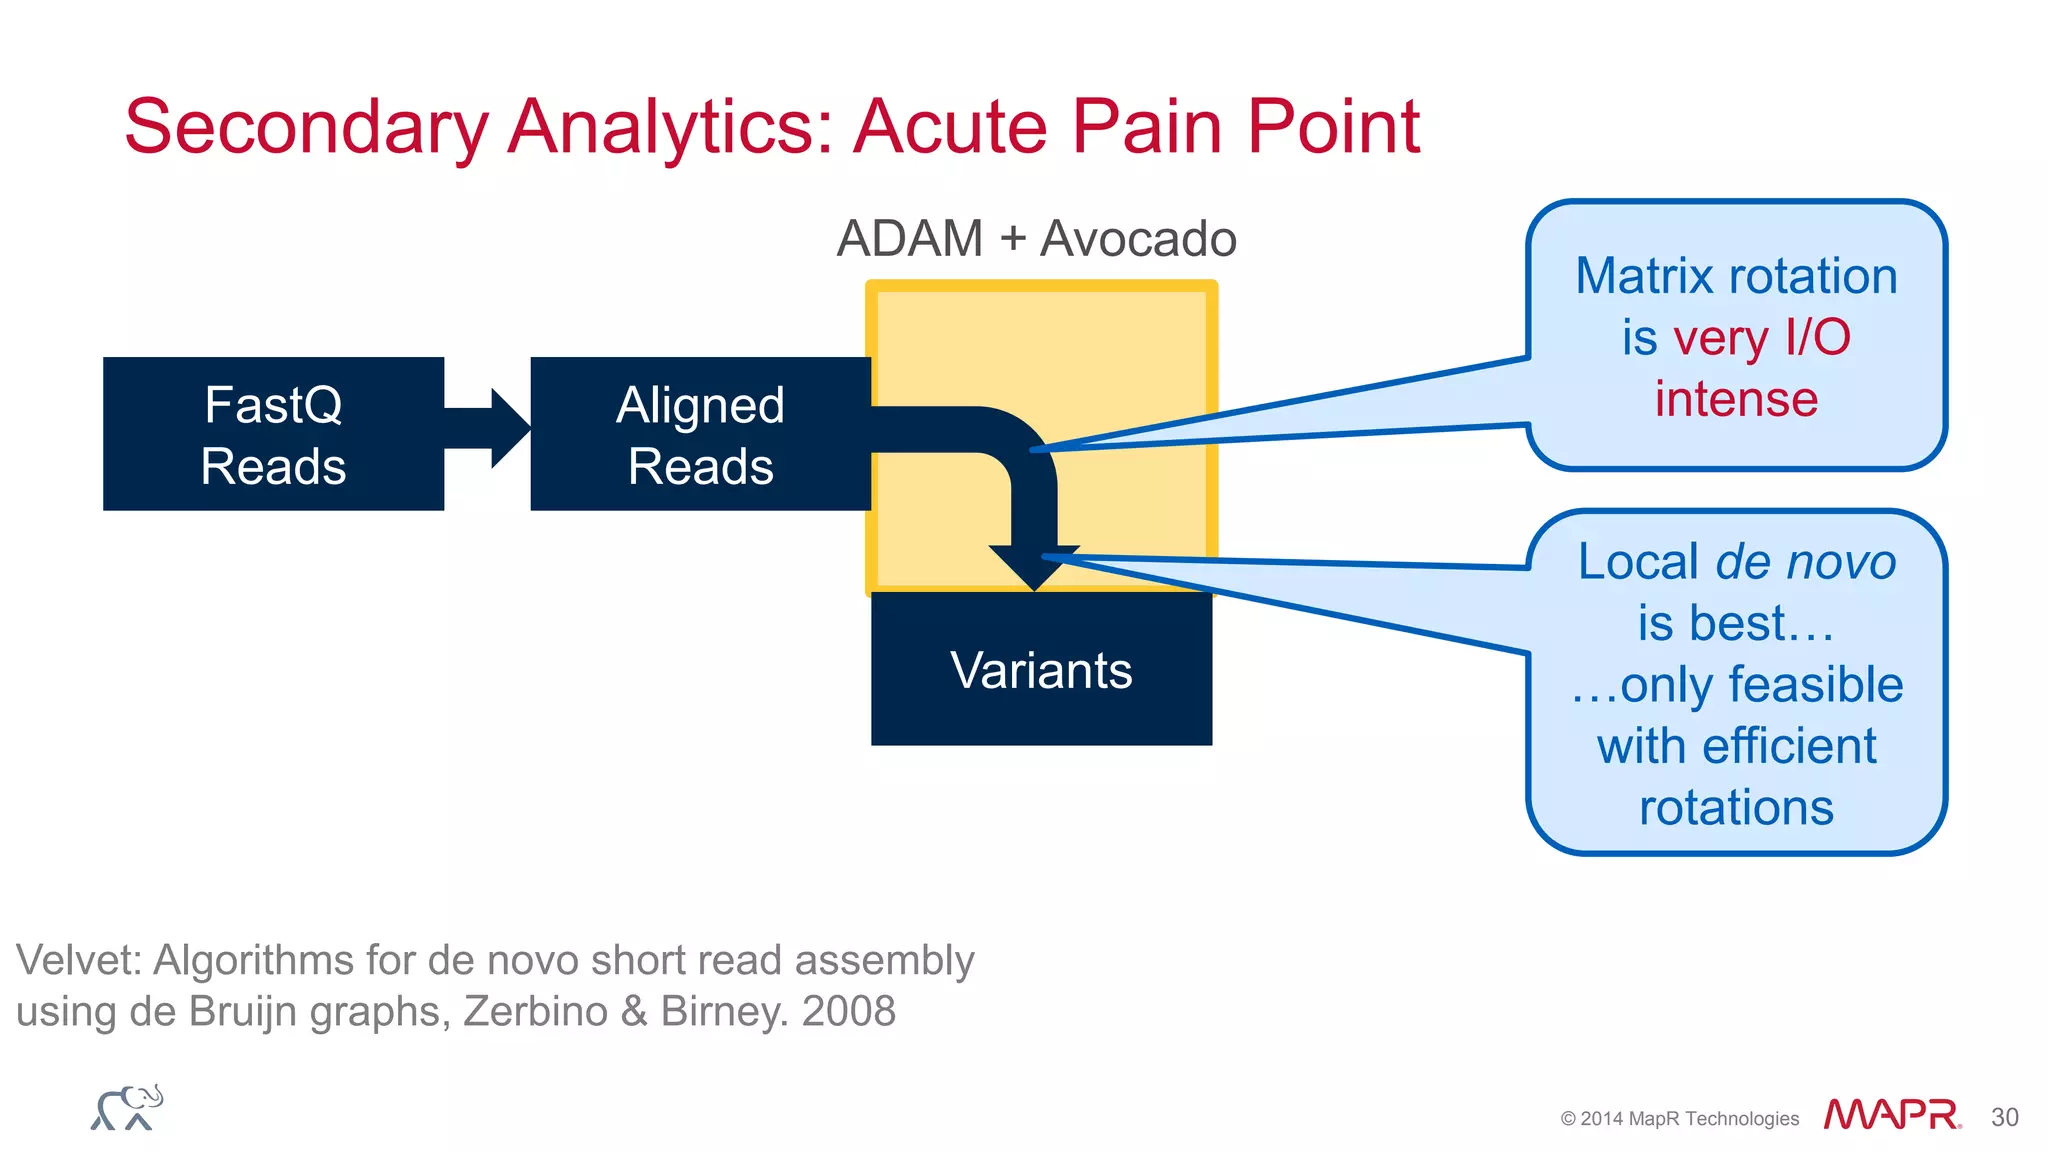
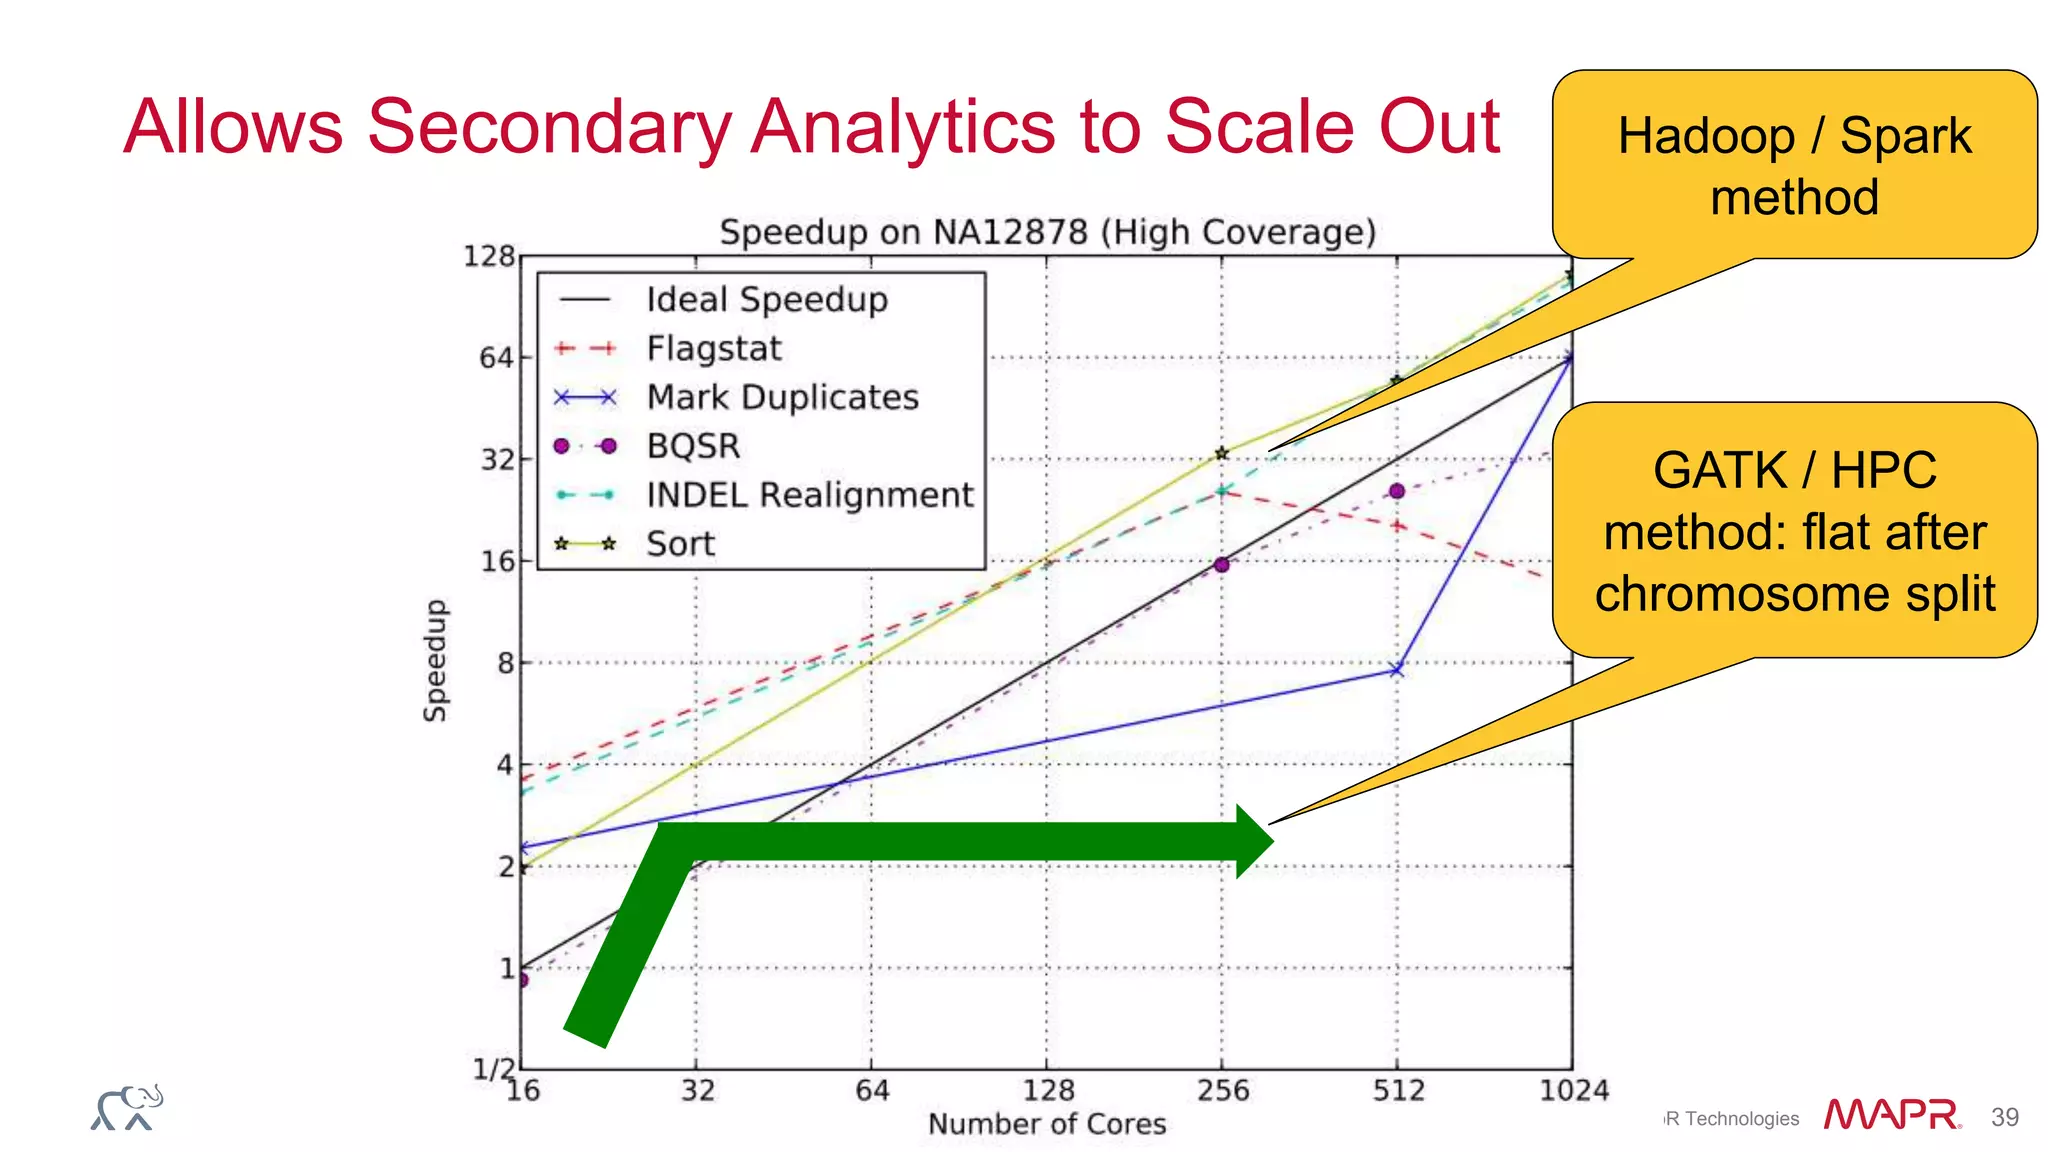
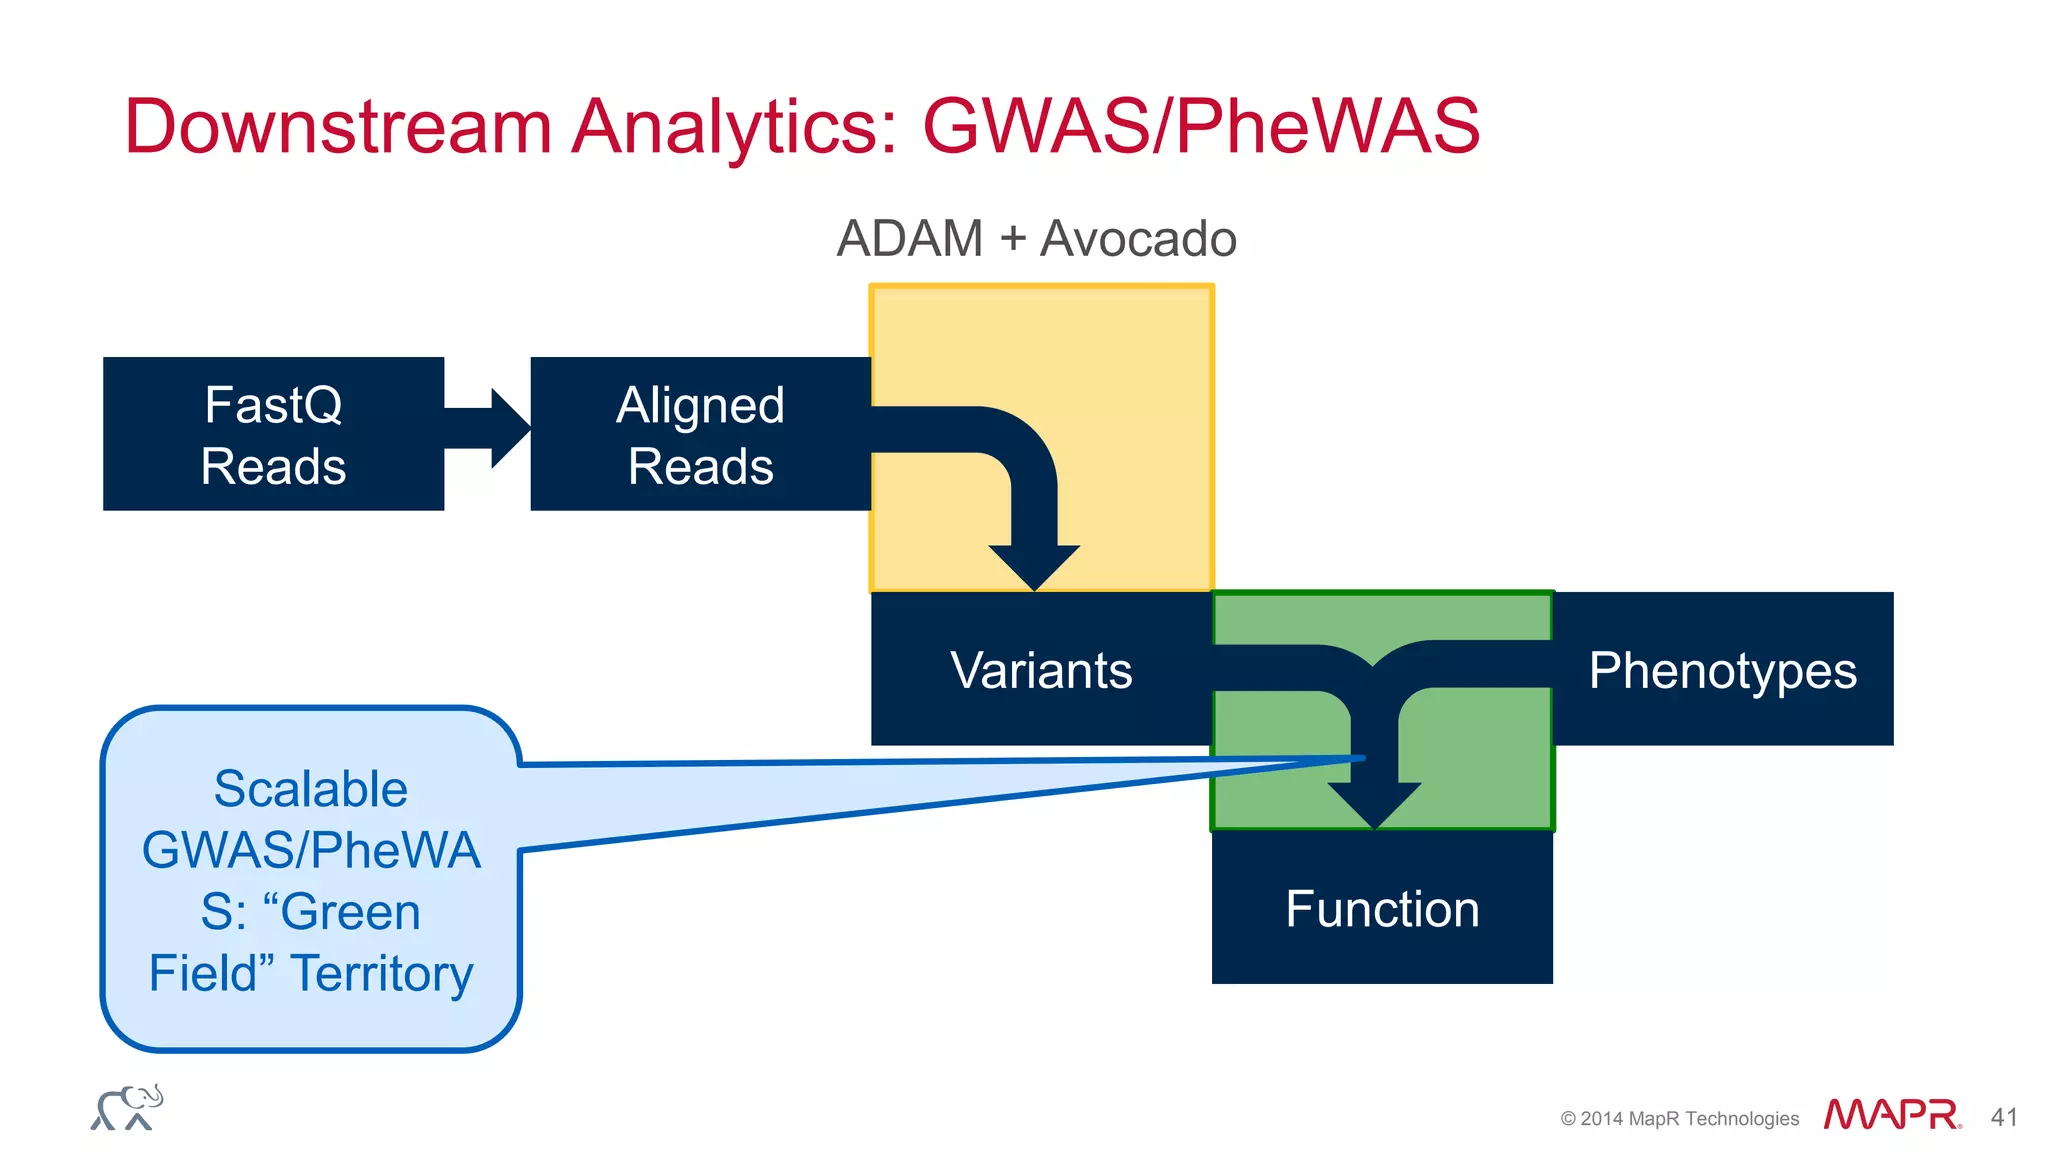
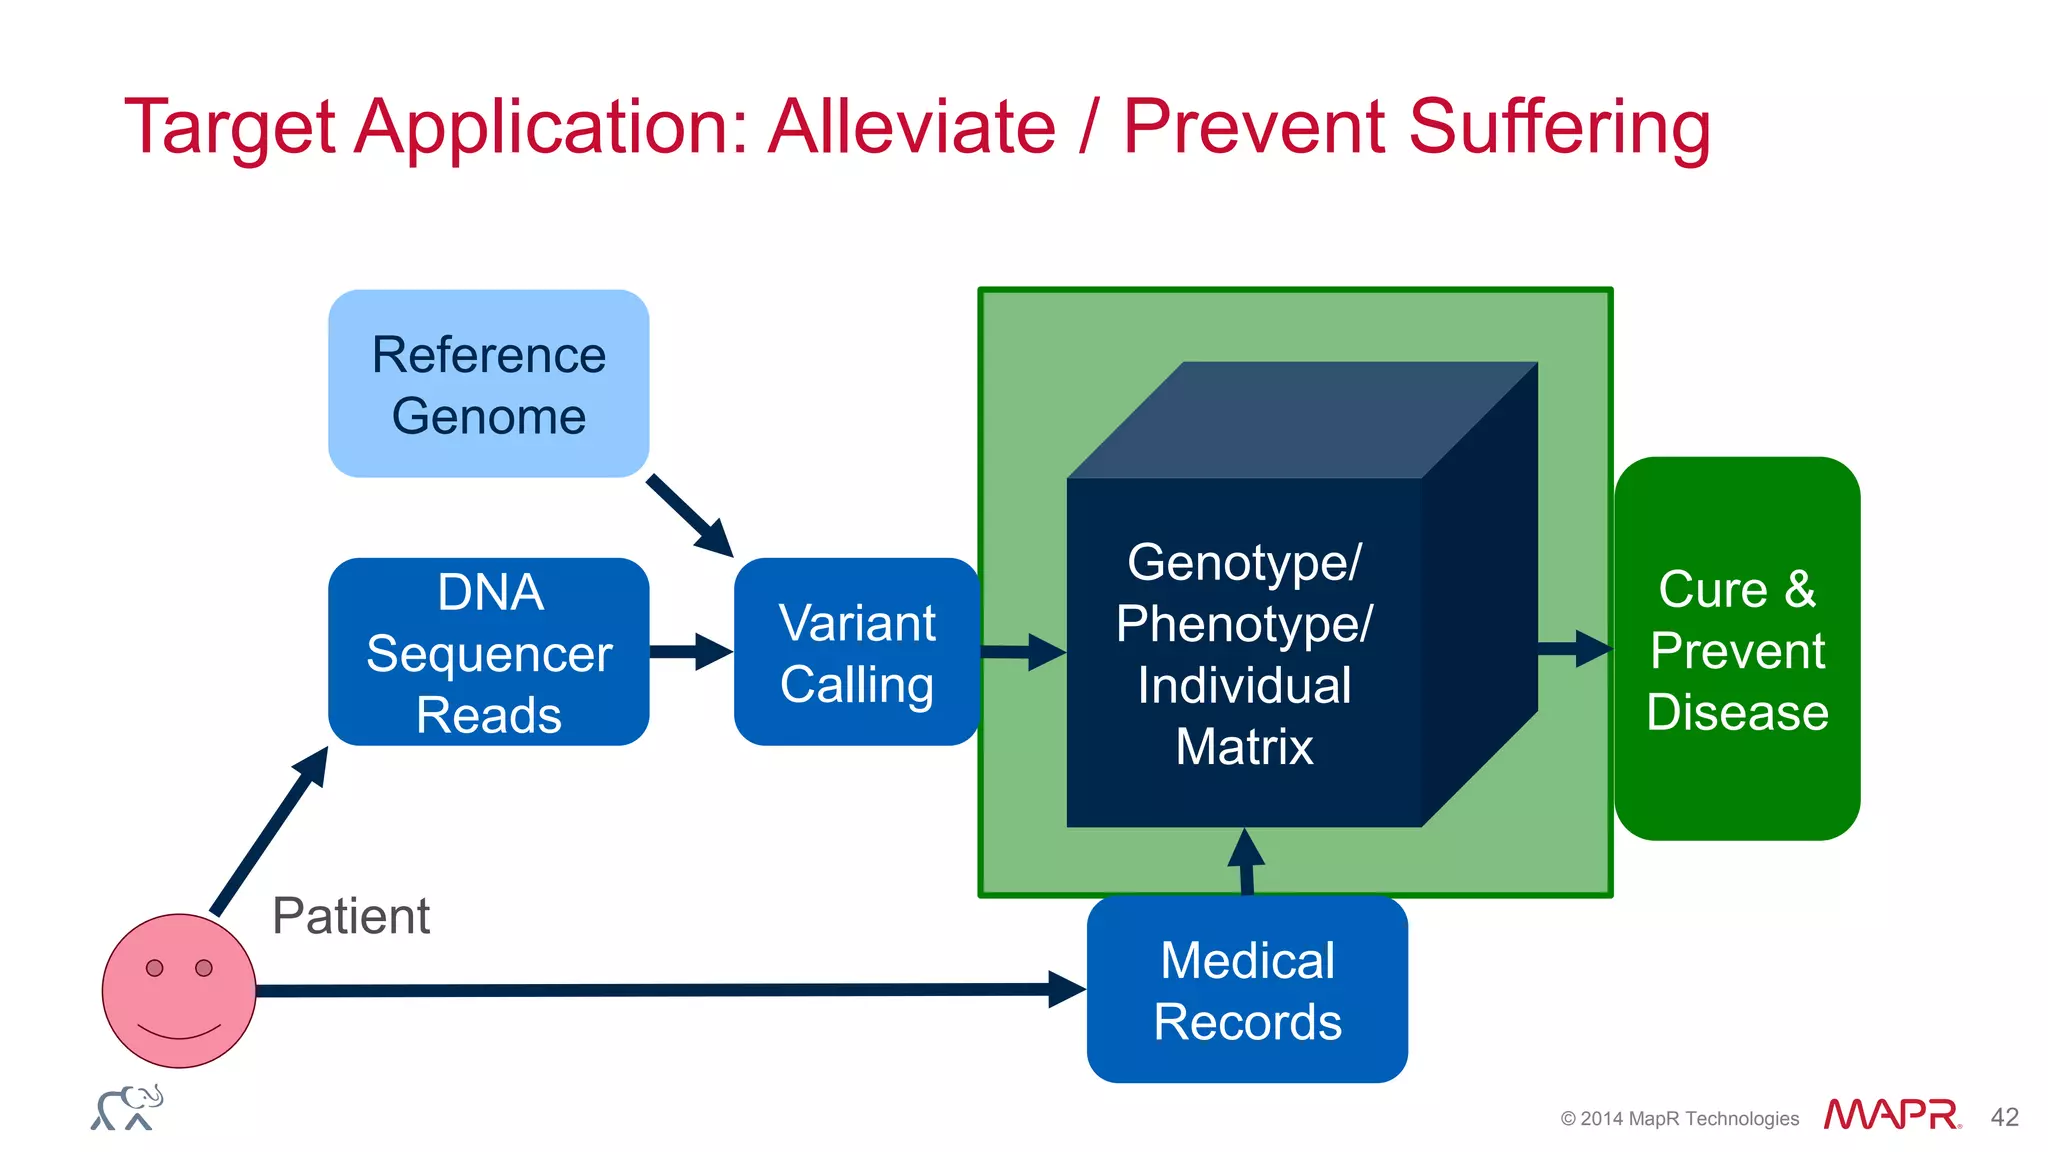
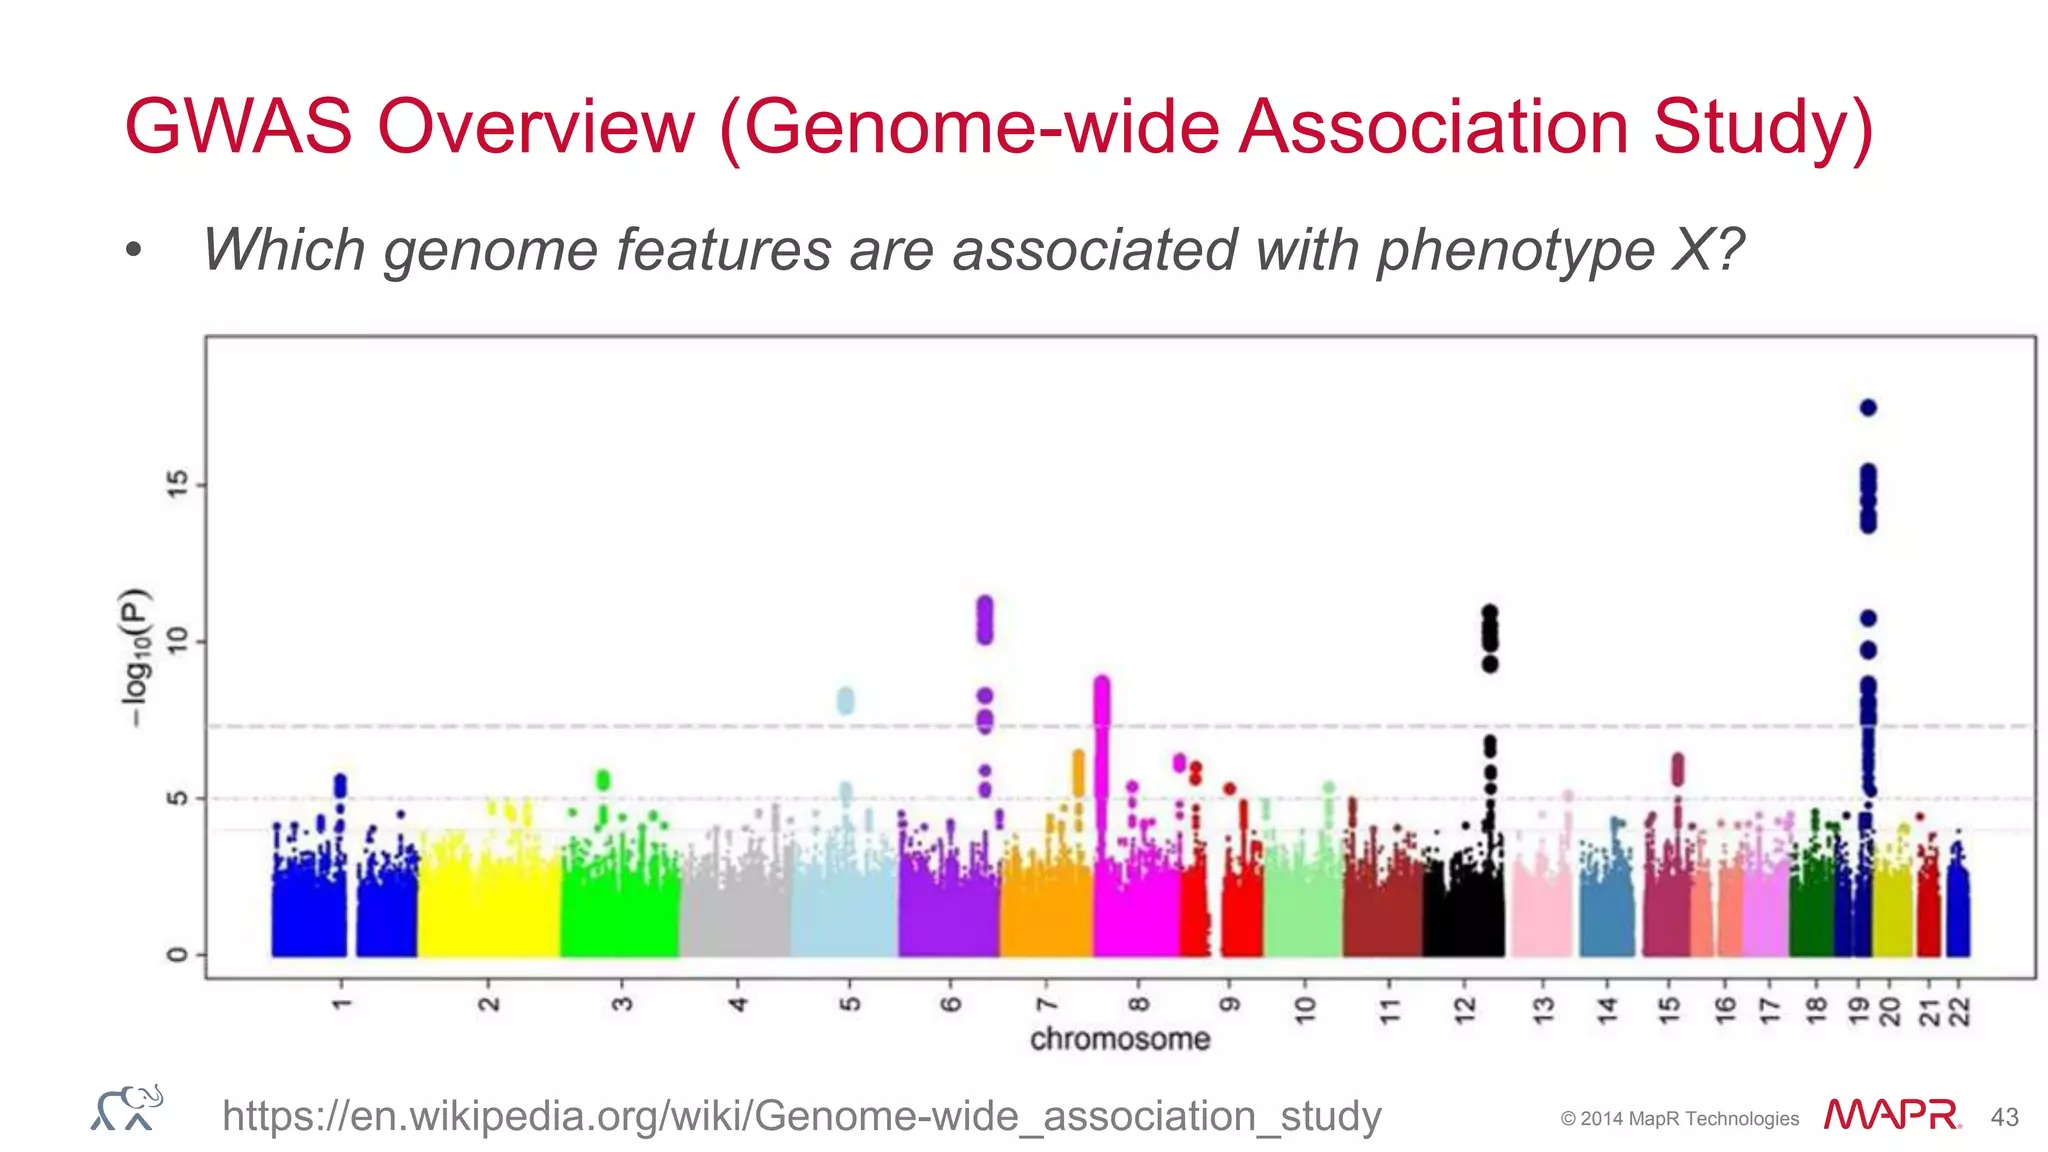
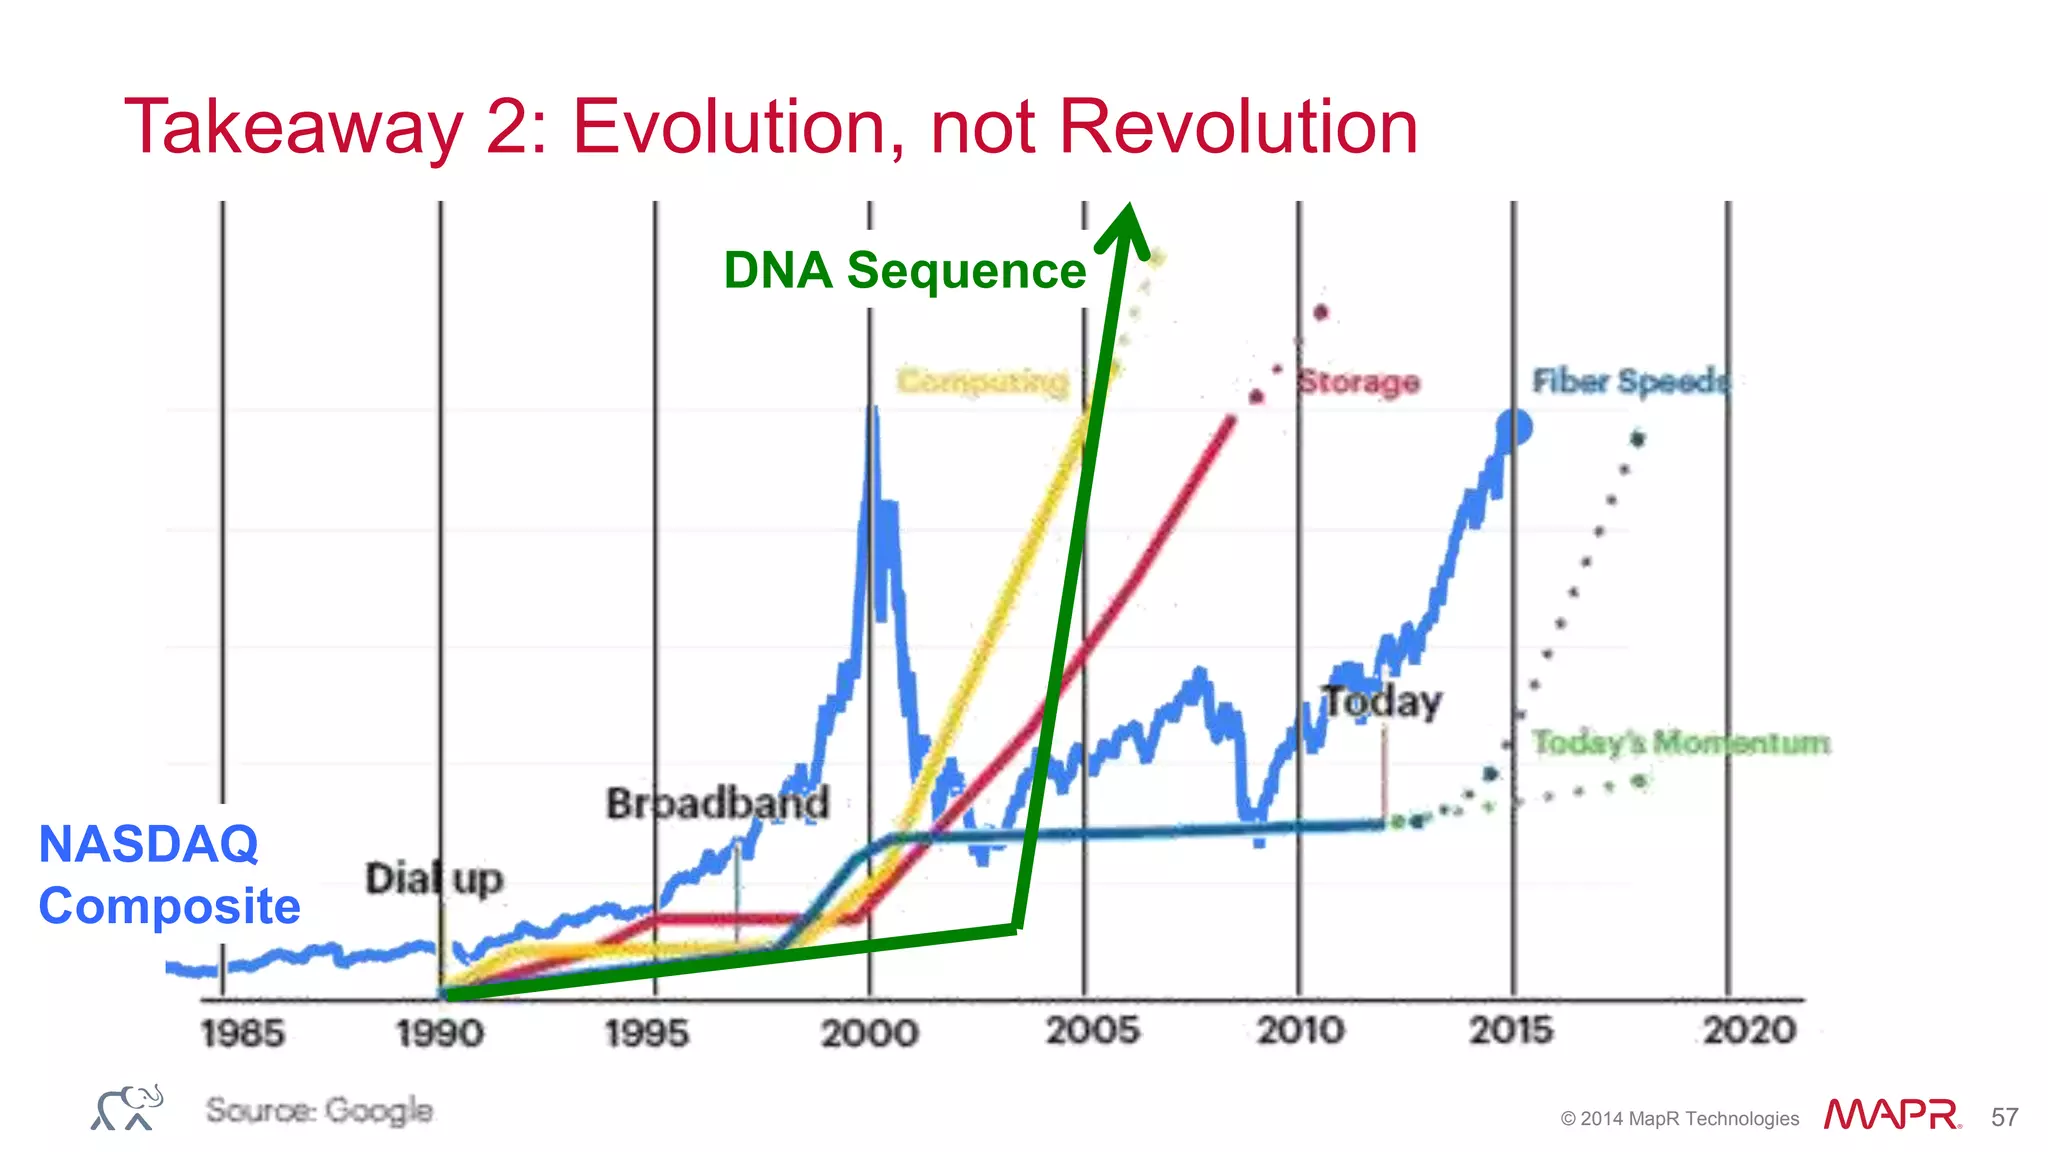
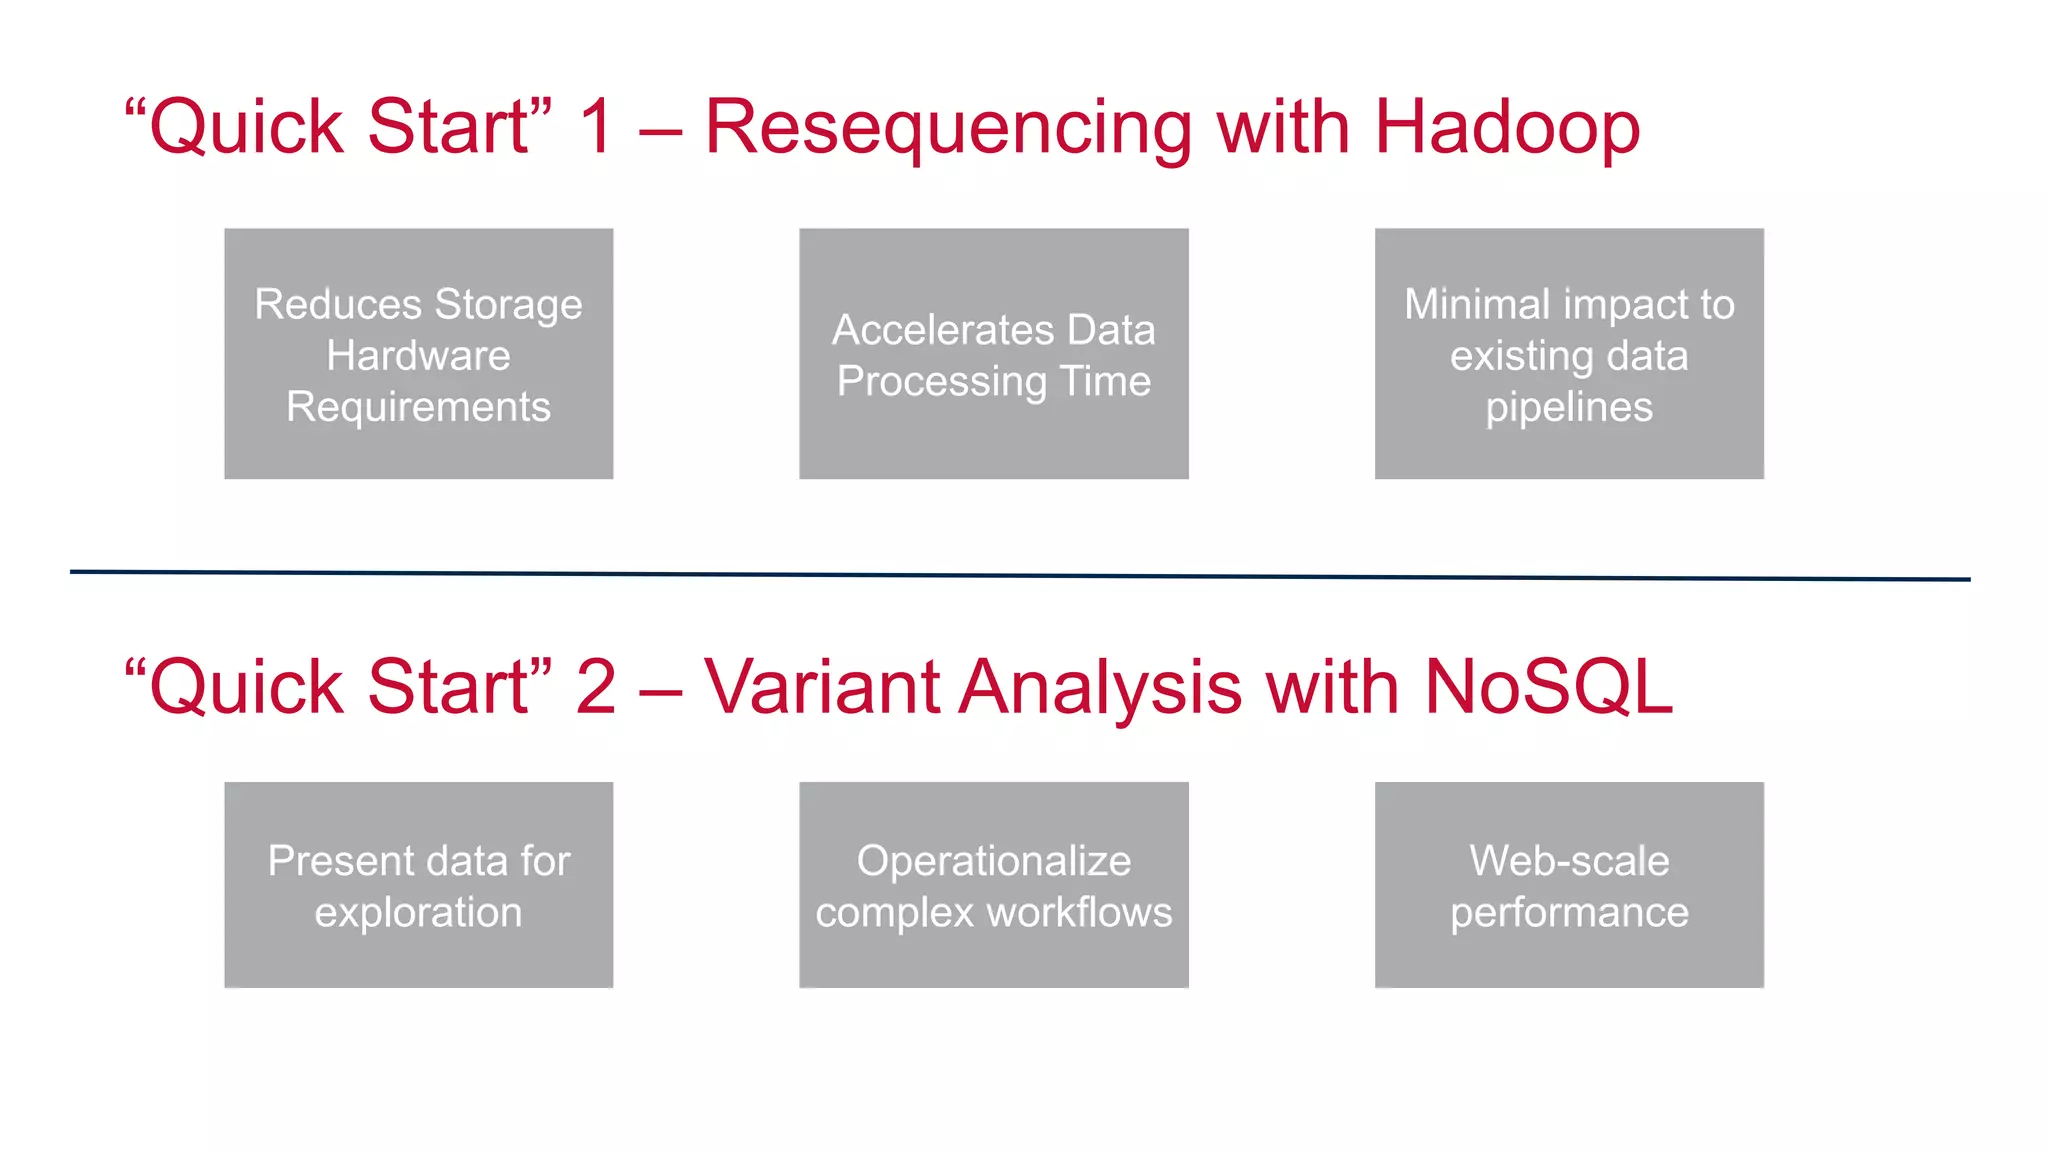
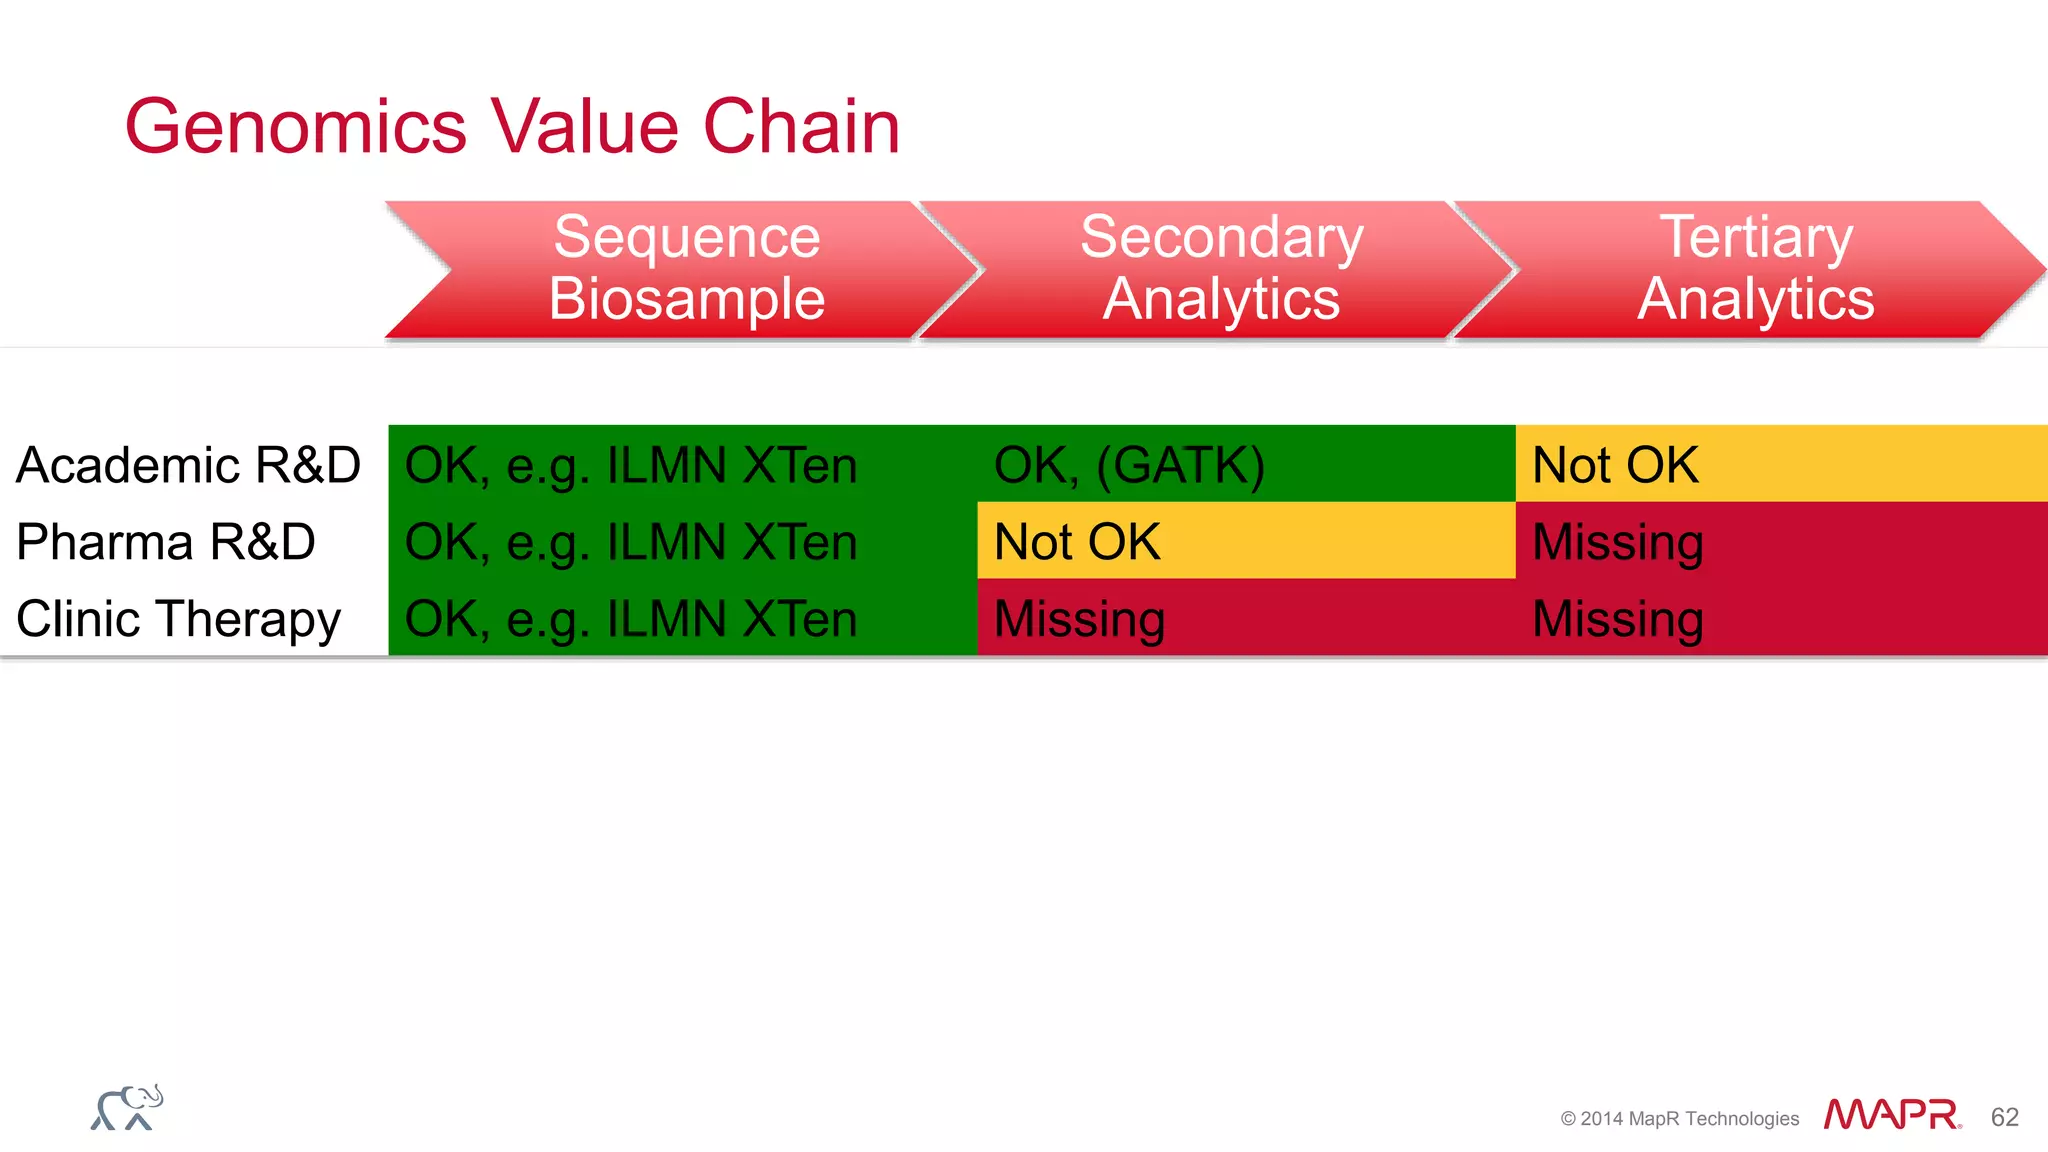
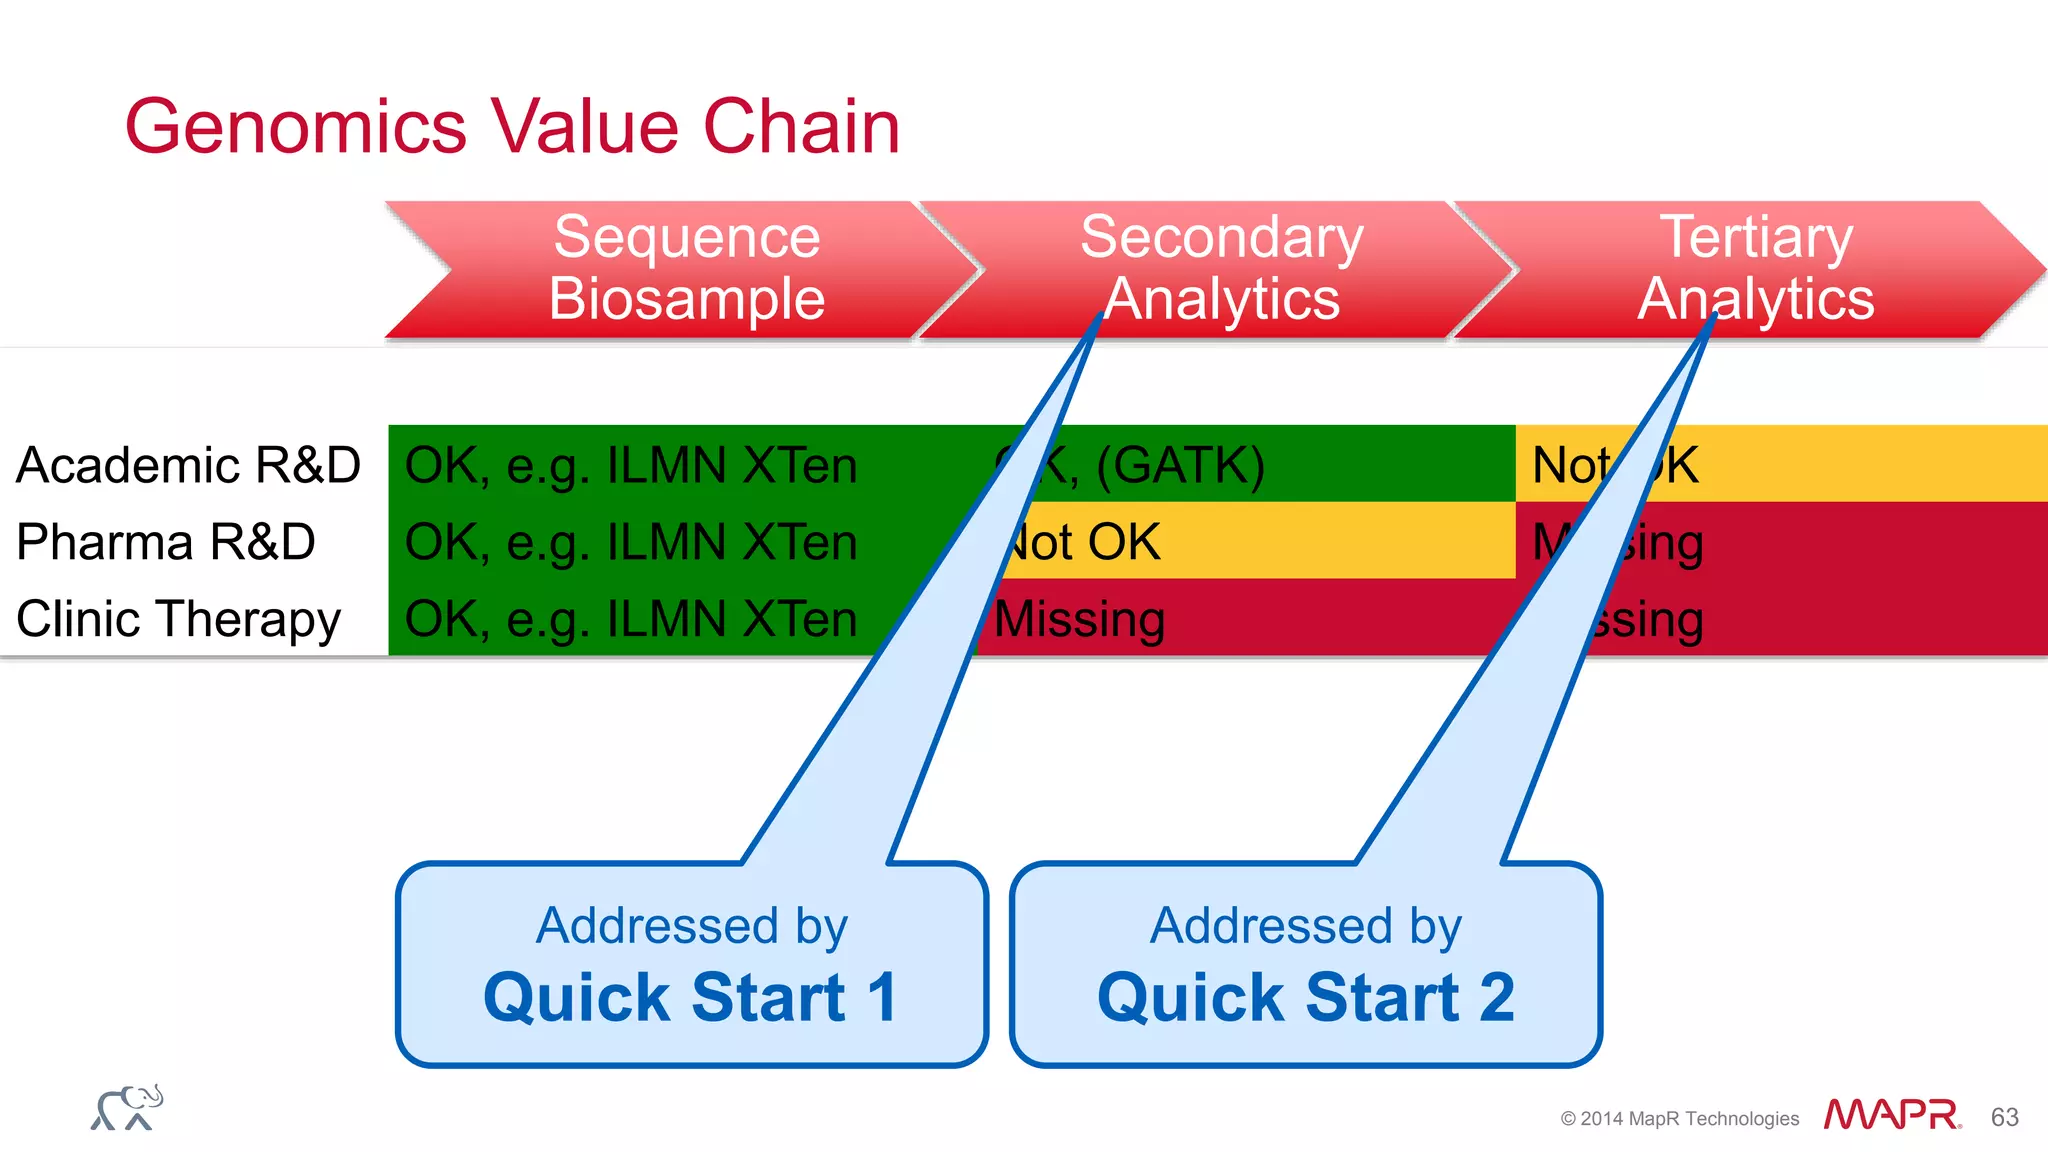
The document discusses the evolution and impact of DNA sequencing technologies from pre-2004 to the present, highlighting the significant disruptions and growth in the genomics market projected to reach $20 billion by 2020. It outlines the value chain in genomics and emphasizes the importance of efficient data analytics and processing in clinical applications. Furthermore, it touches on advanced applications such as variant calling and the integration of big data technologies to address the challenges faced in genomic data analysis.


![Human Genetics & Big Data [sans Ethics]](https://cdn.slidesharecdn.com/ss_thumbnails/2014-140513201106-phpapp02-thumbnail.jpg?width=640&height=640&fit=bounds)


![Apporach to lung biopsy [Auto-saved].pptx latest](https://cdn.slidesharecdn.com/ss_thumbnails/apporachtolungbiopsyauto-saved-251211225655-93258539-thumbnail.jpg?width=640&height=640&fit=bounds)


