Download as PDF, PPTX


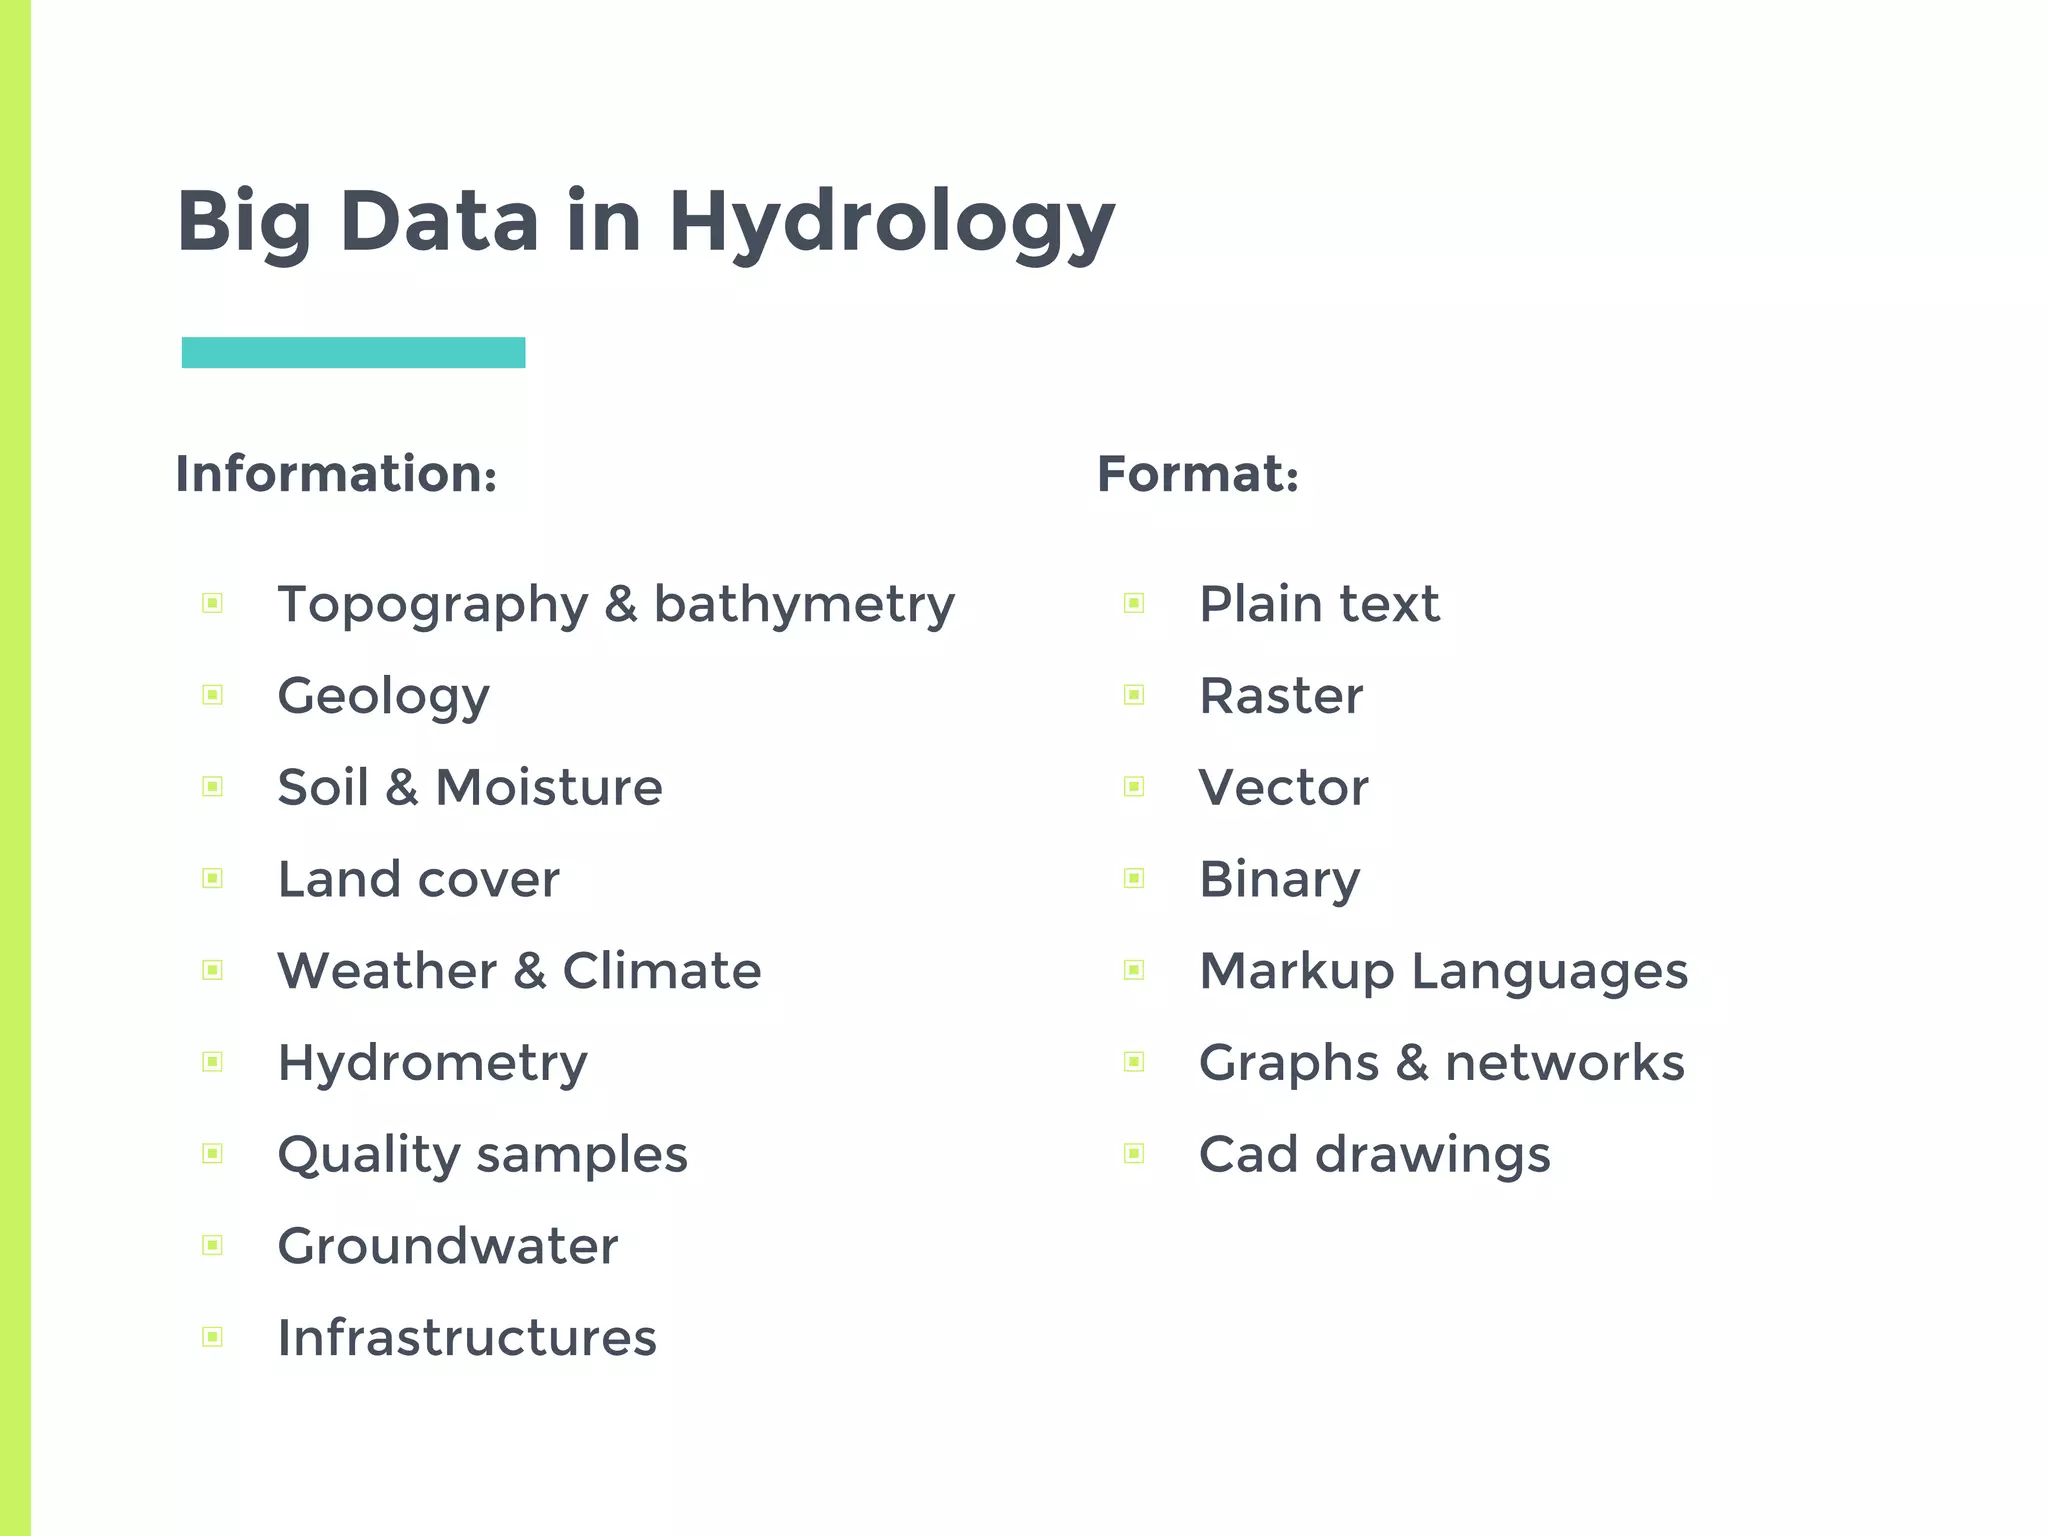
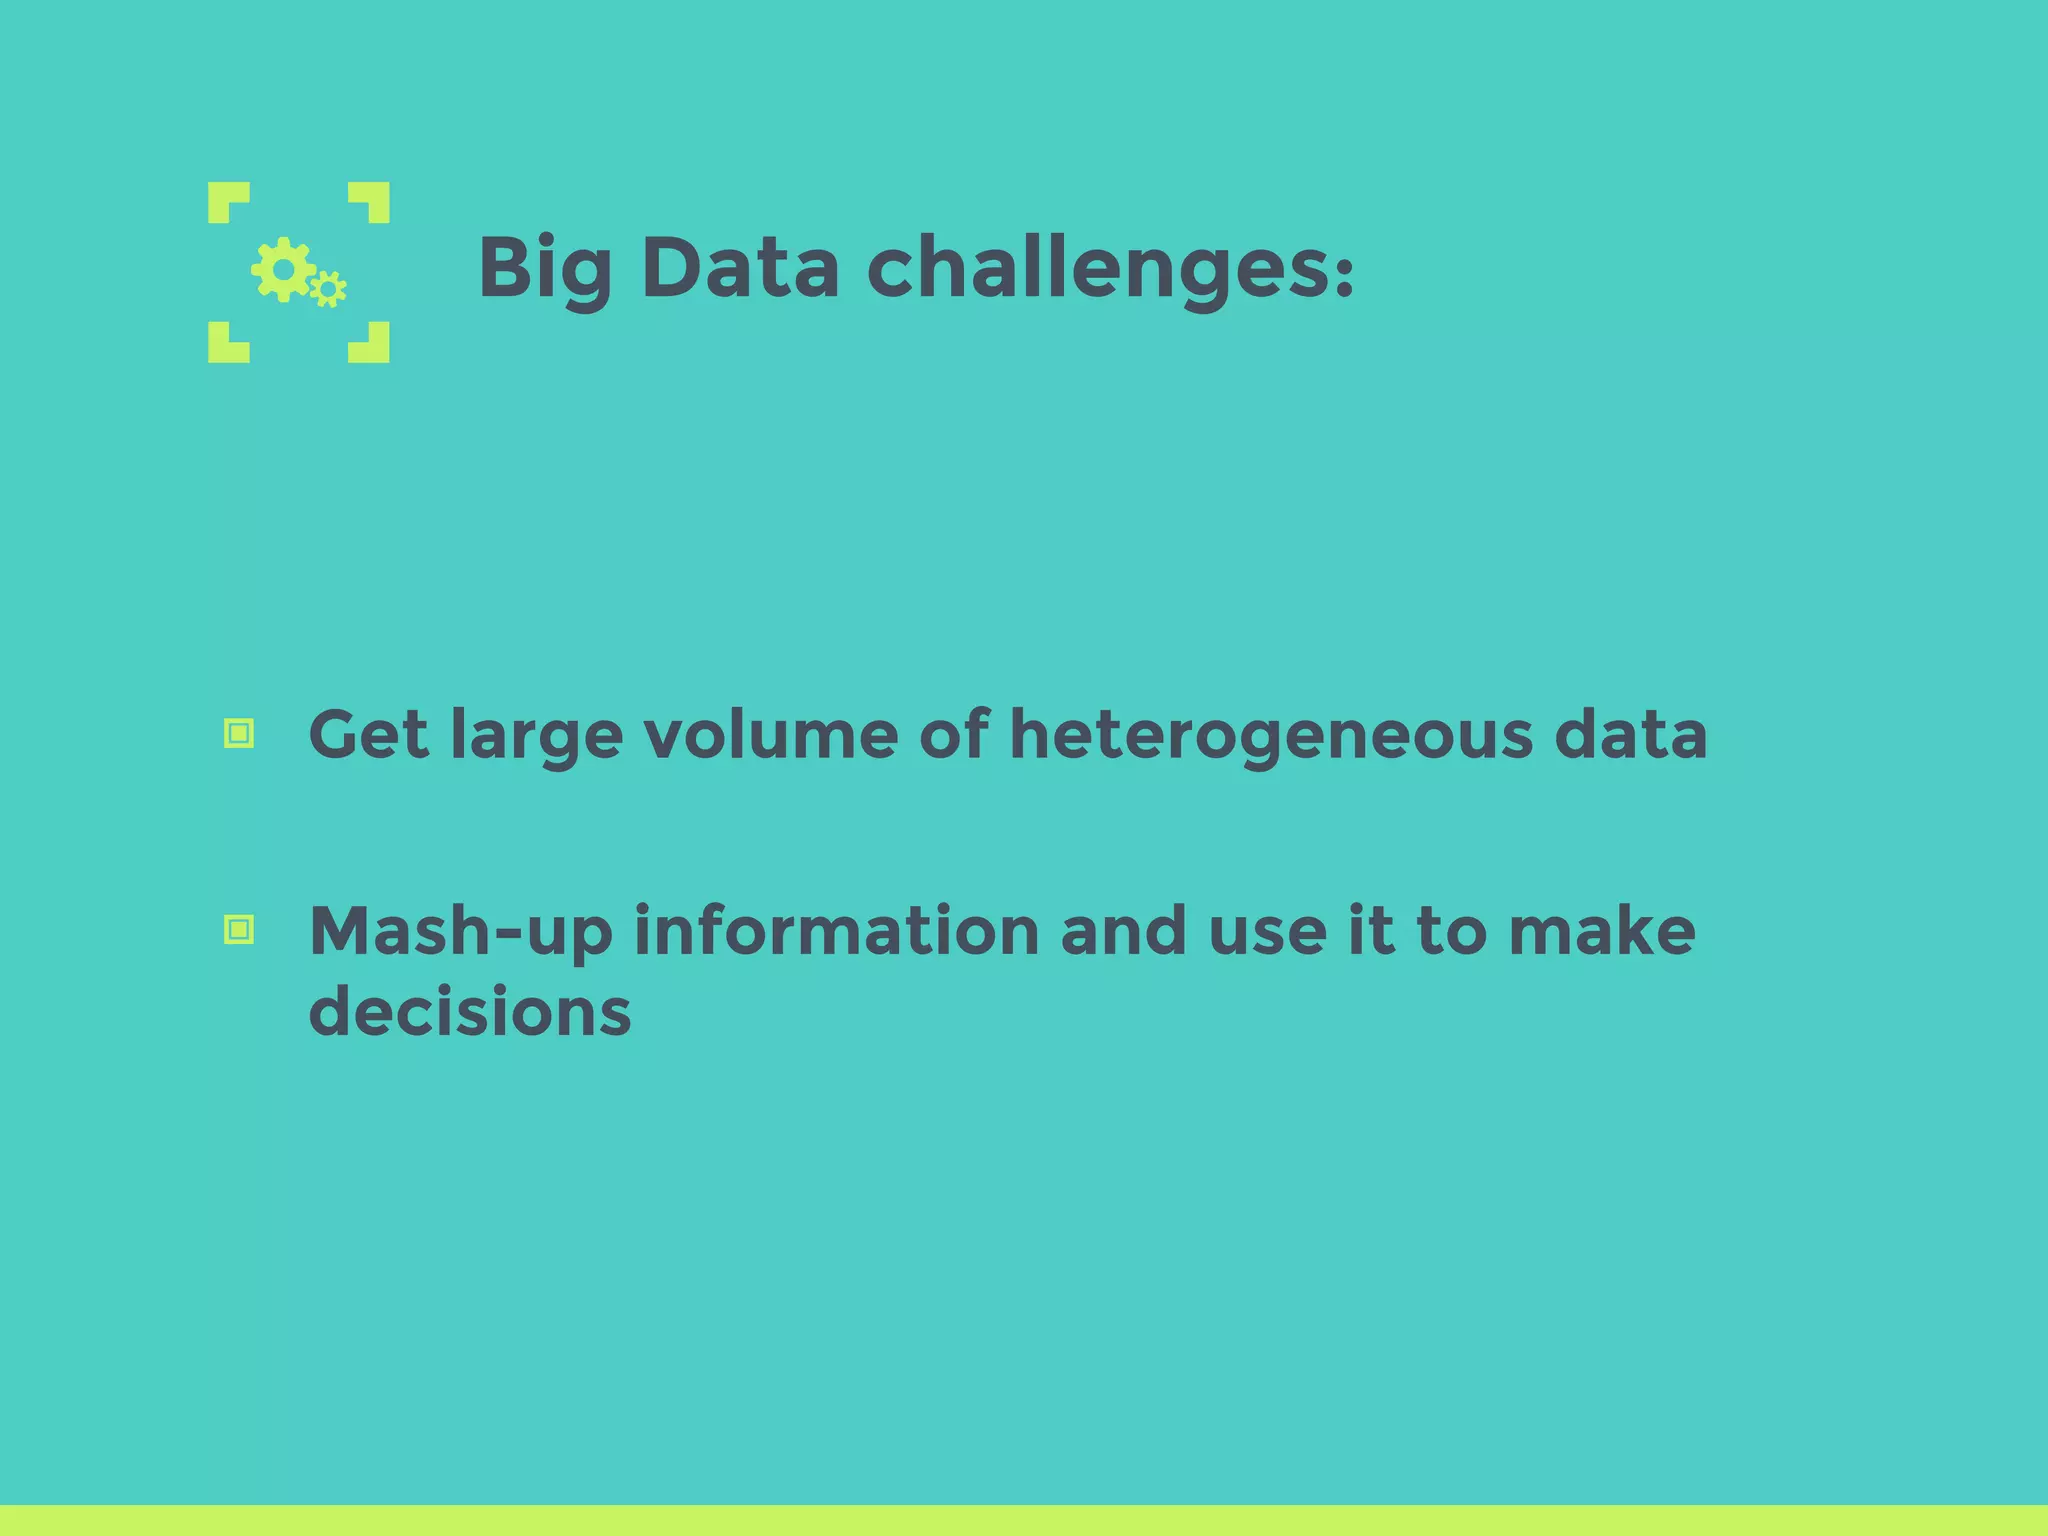
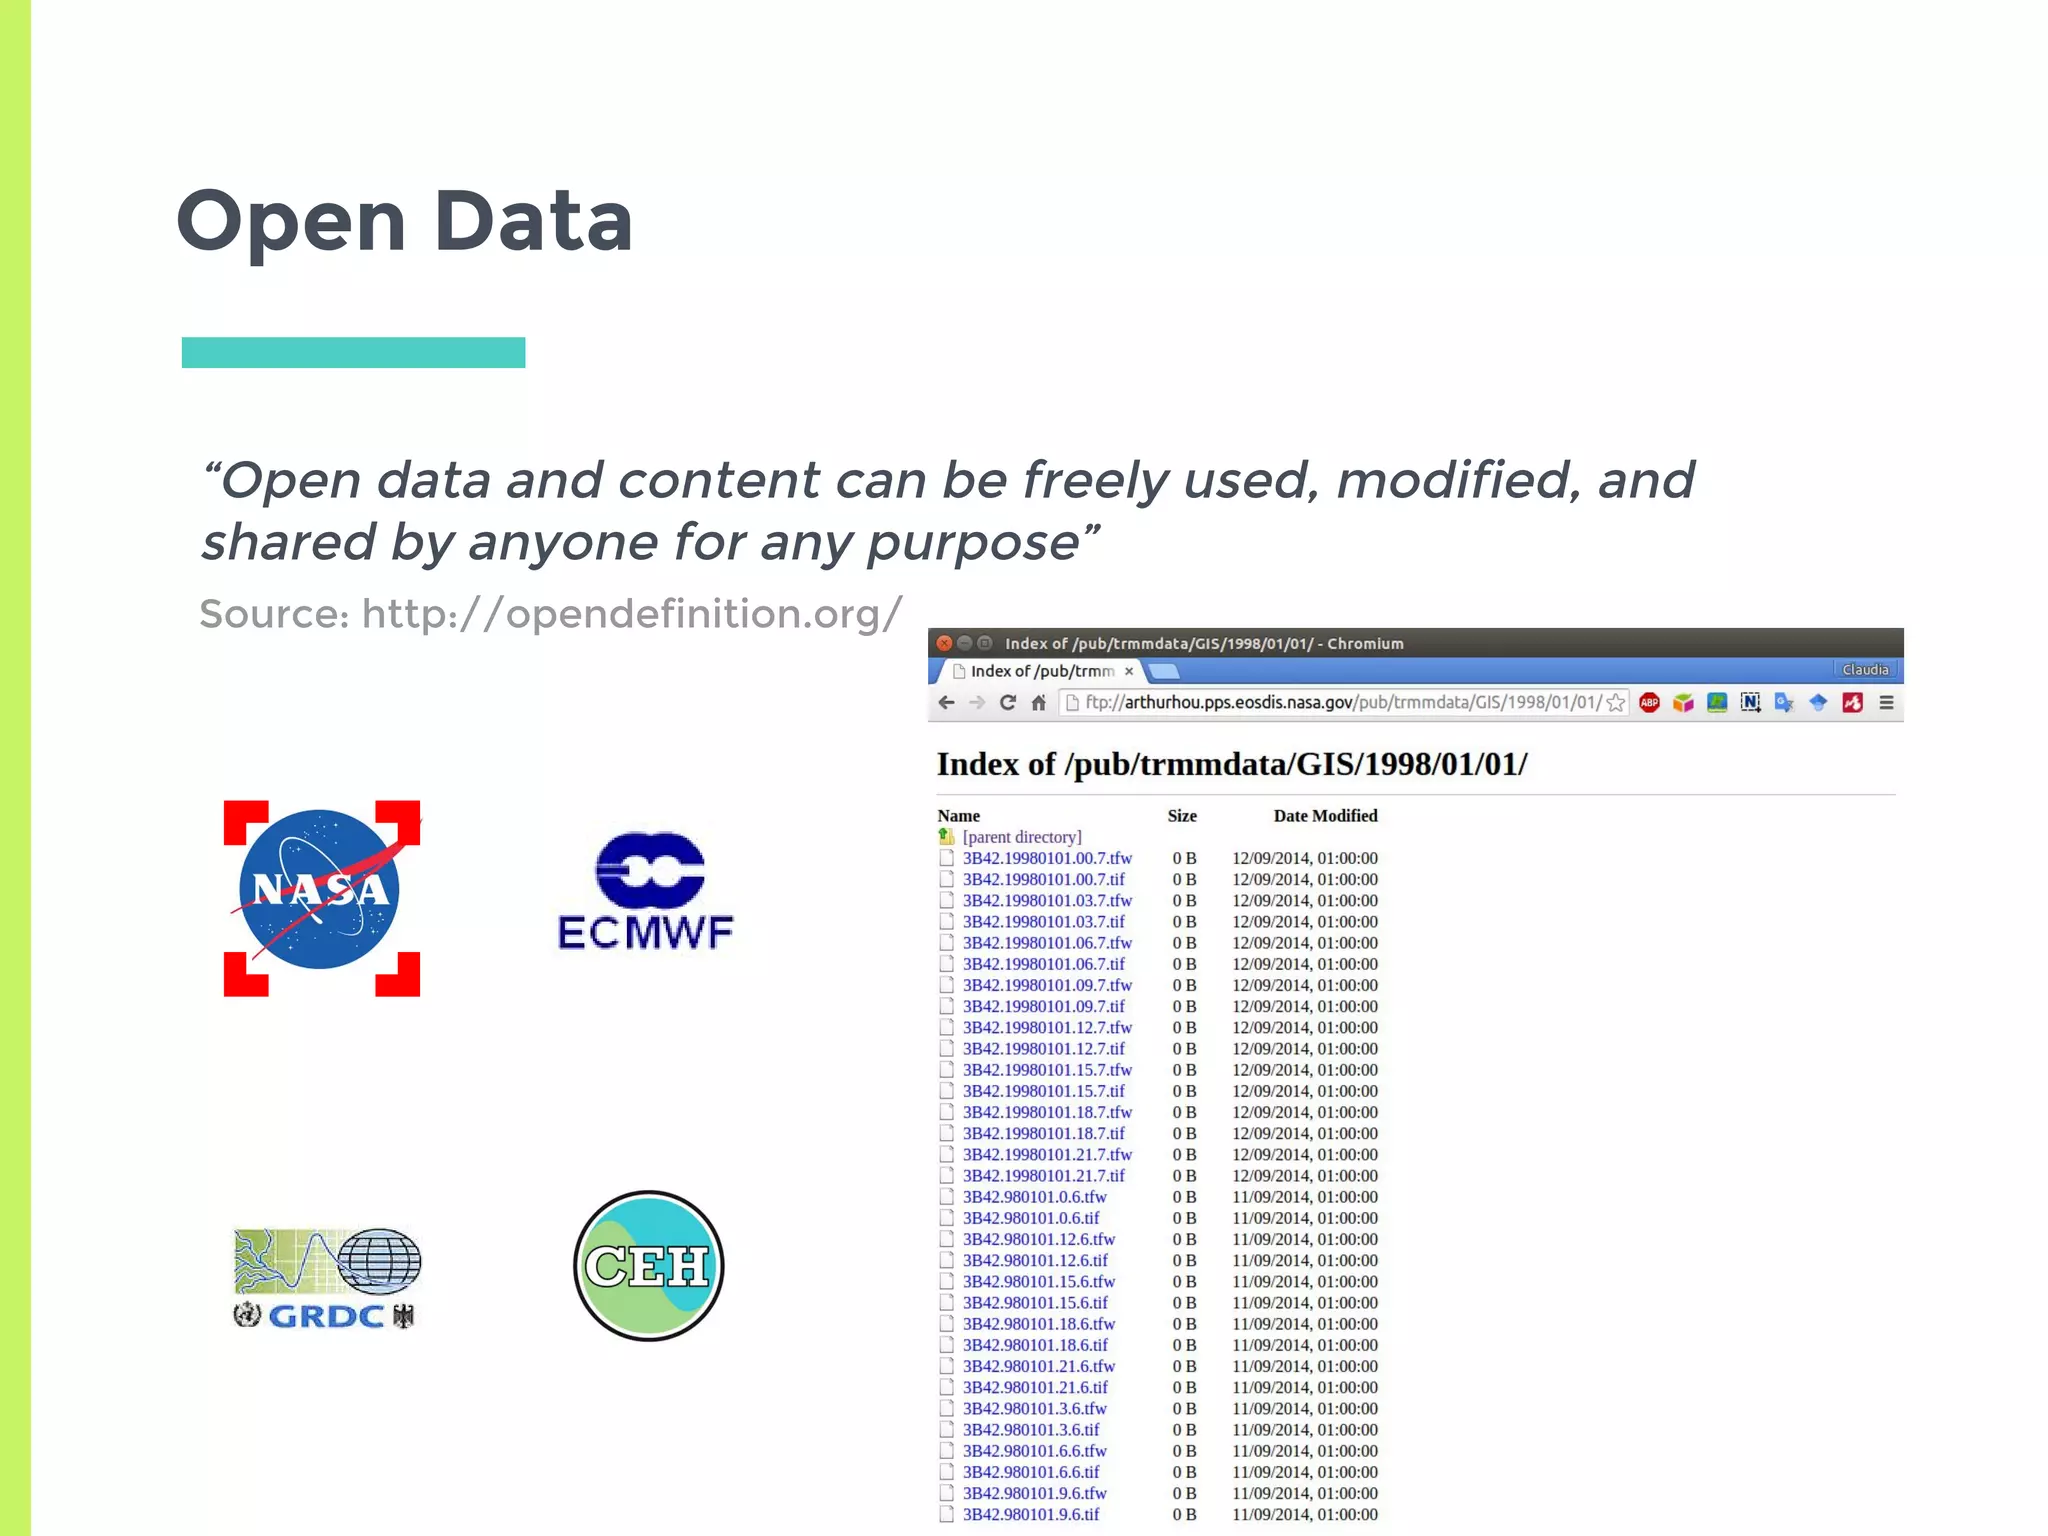
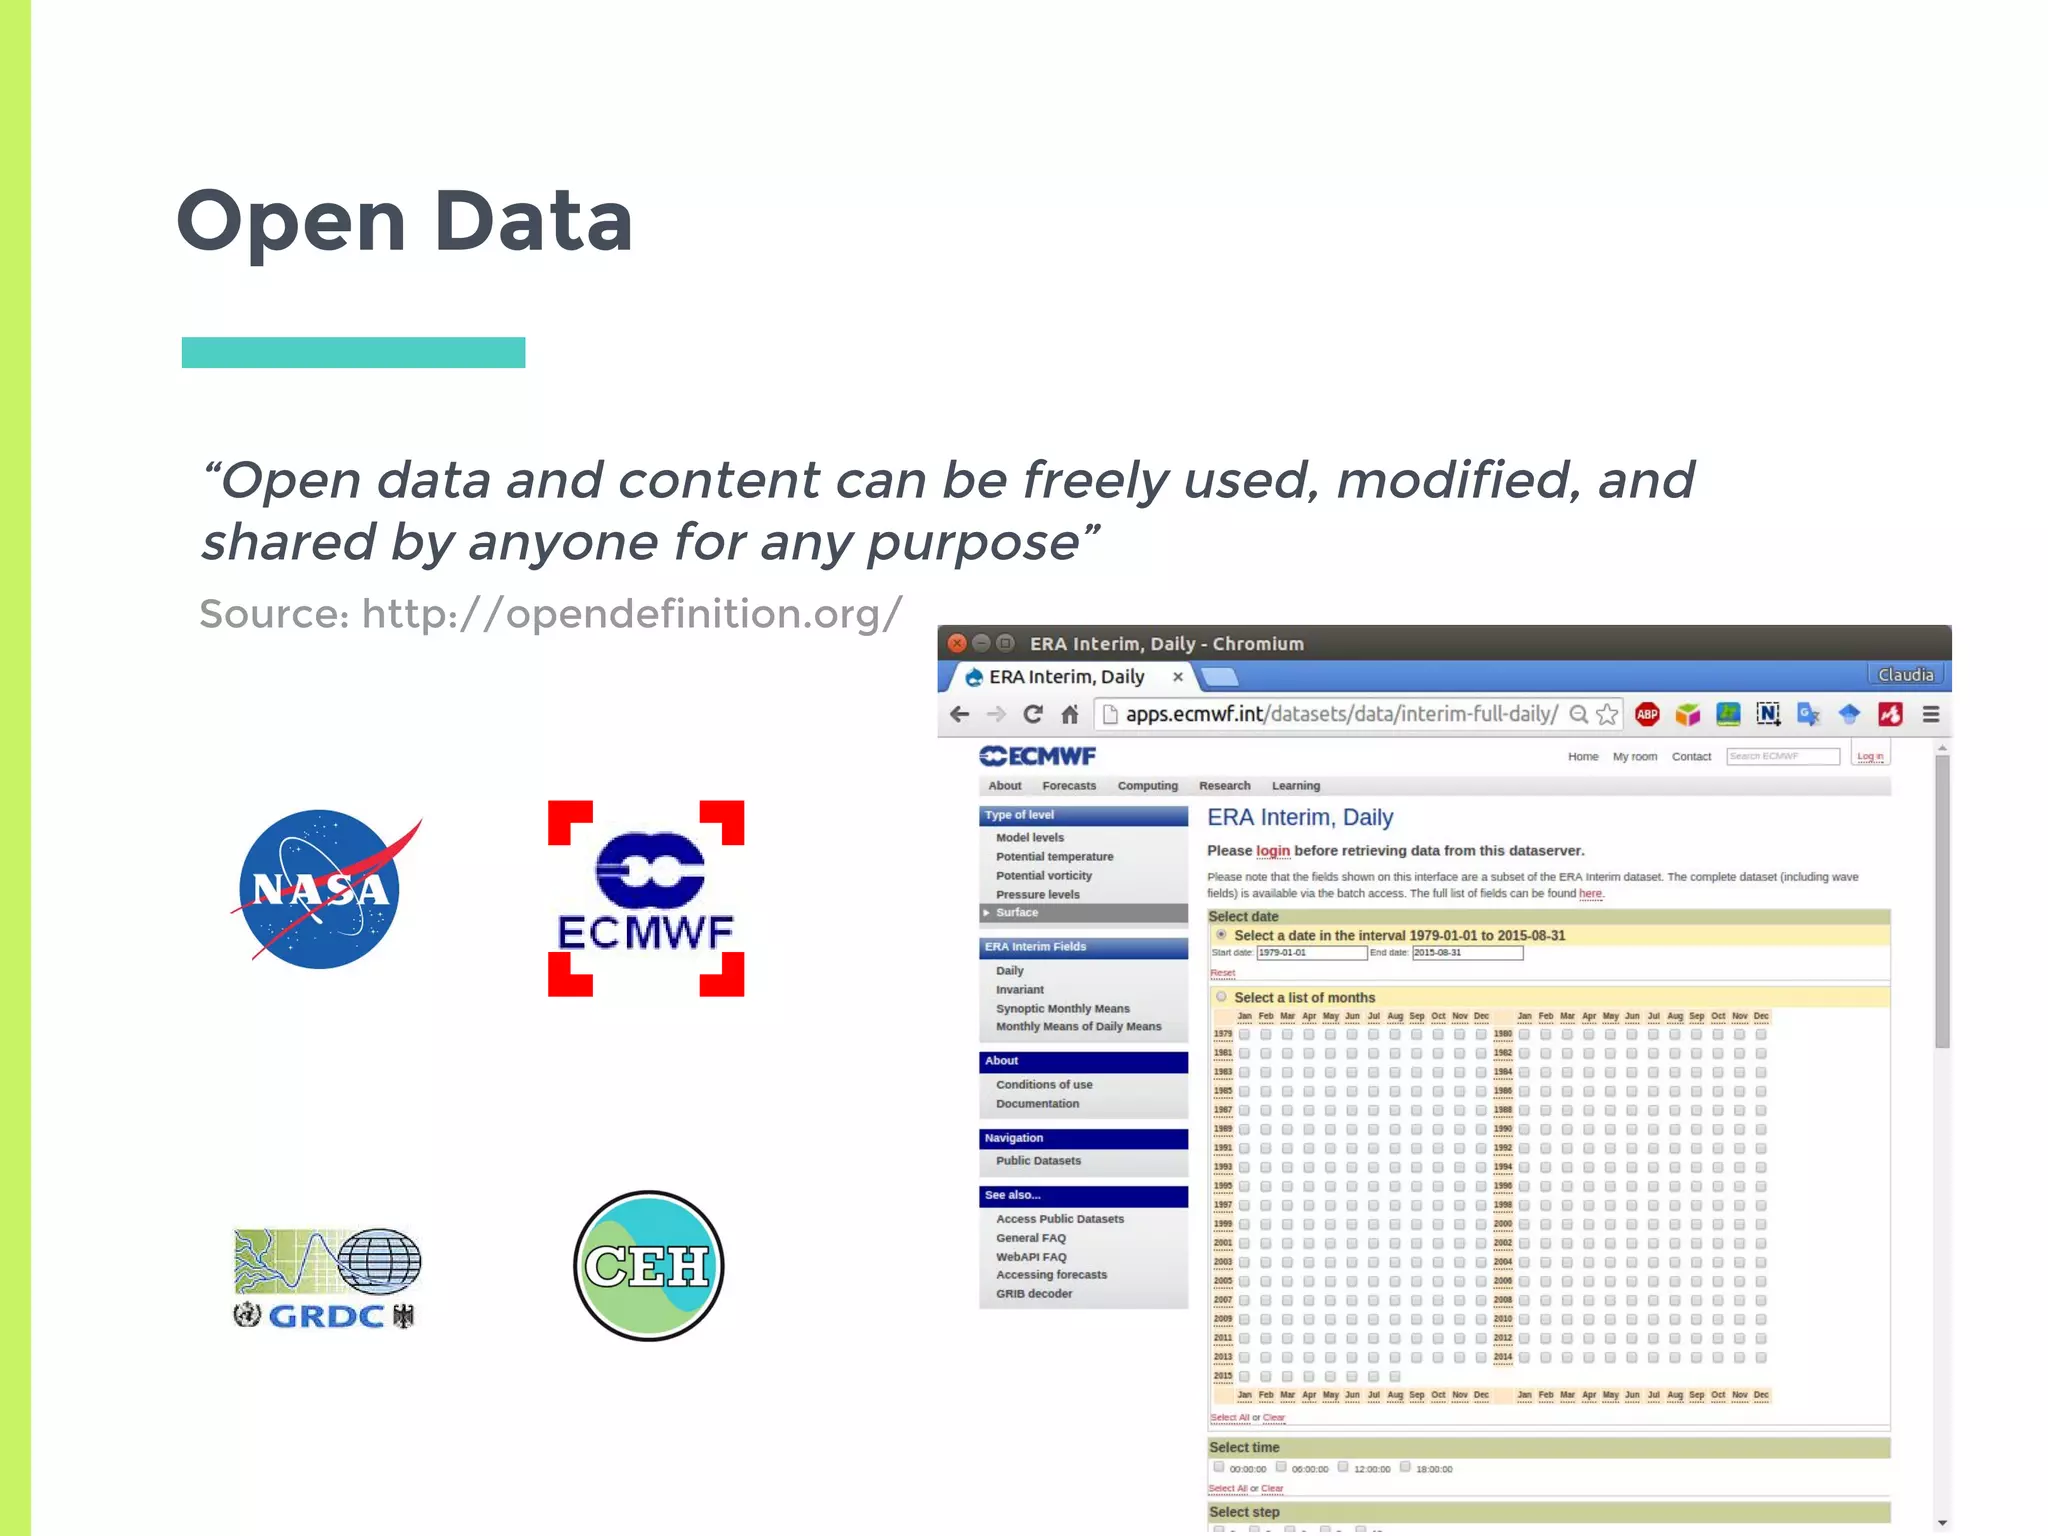
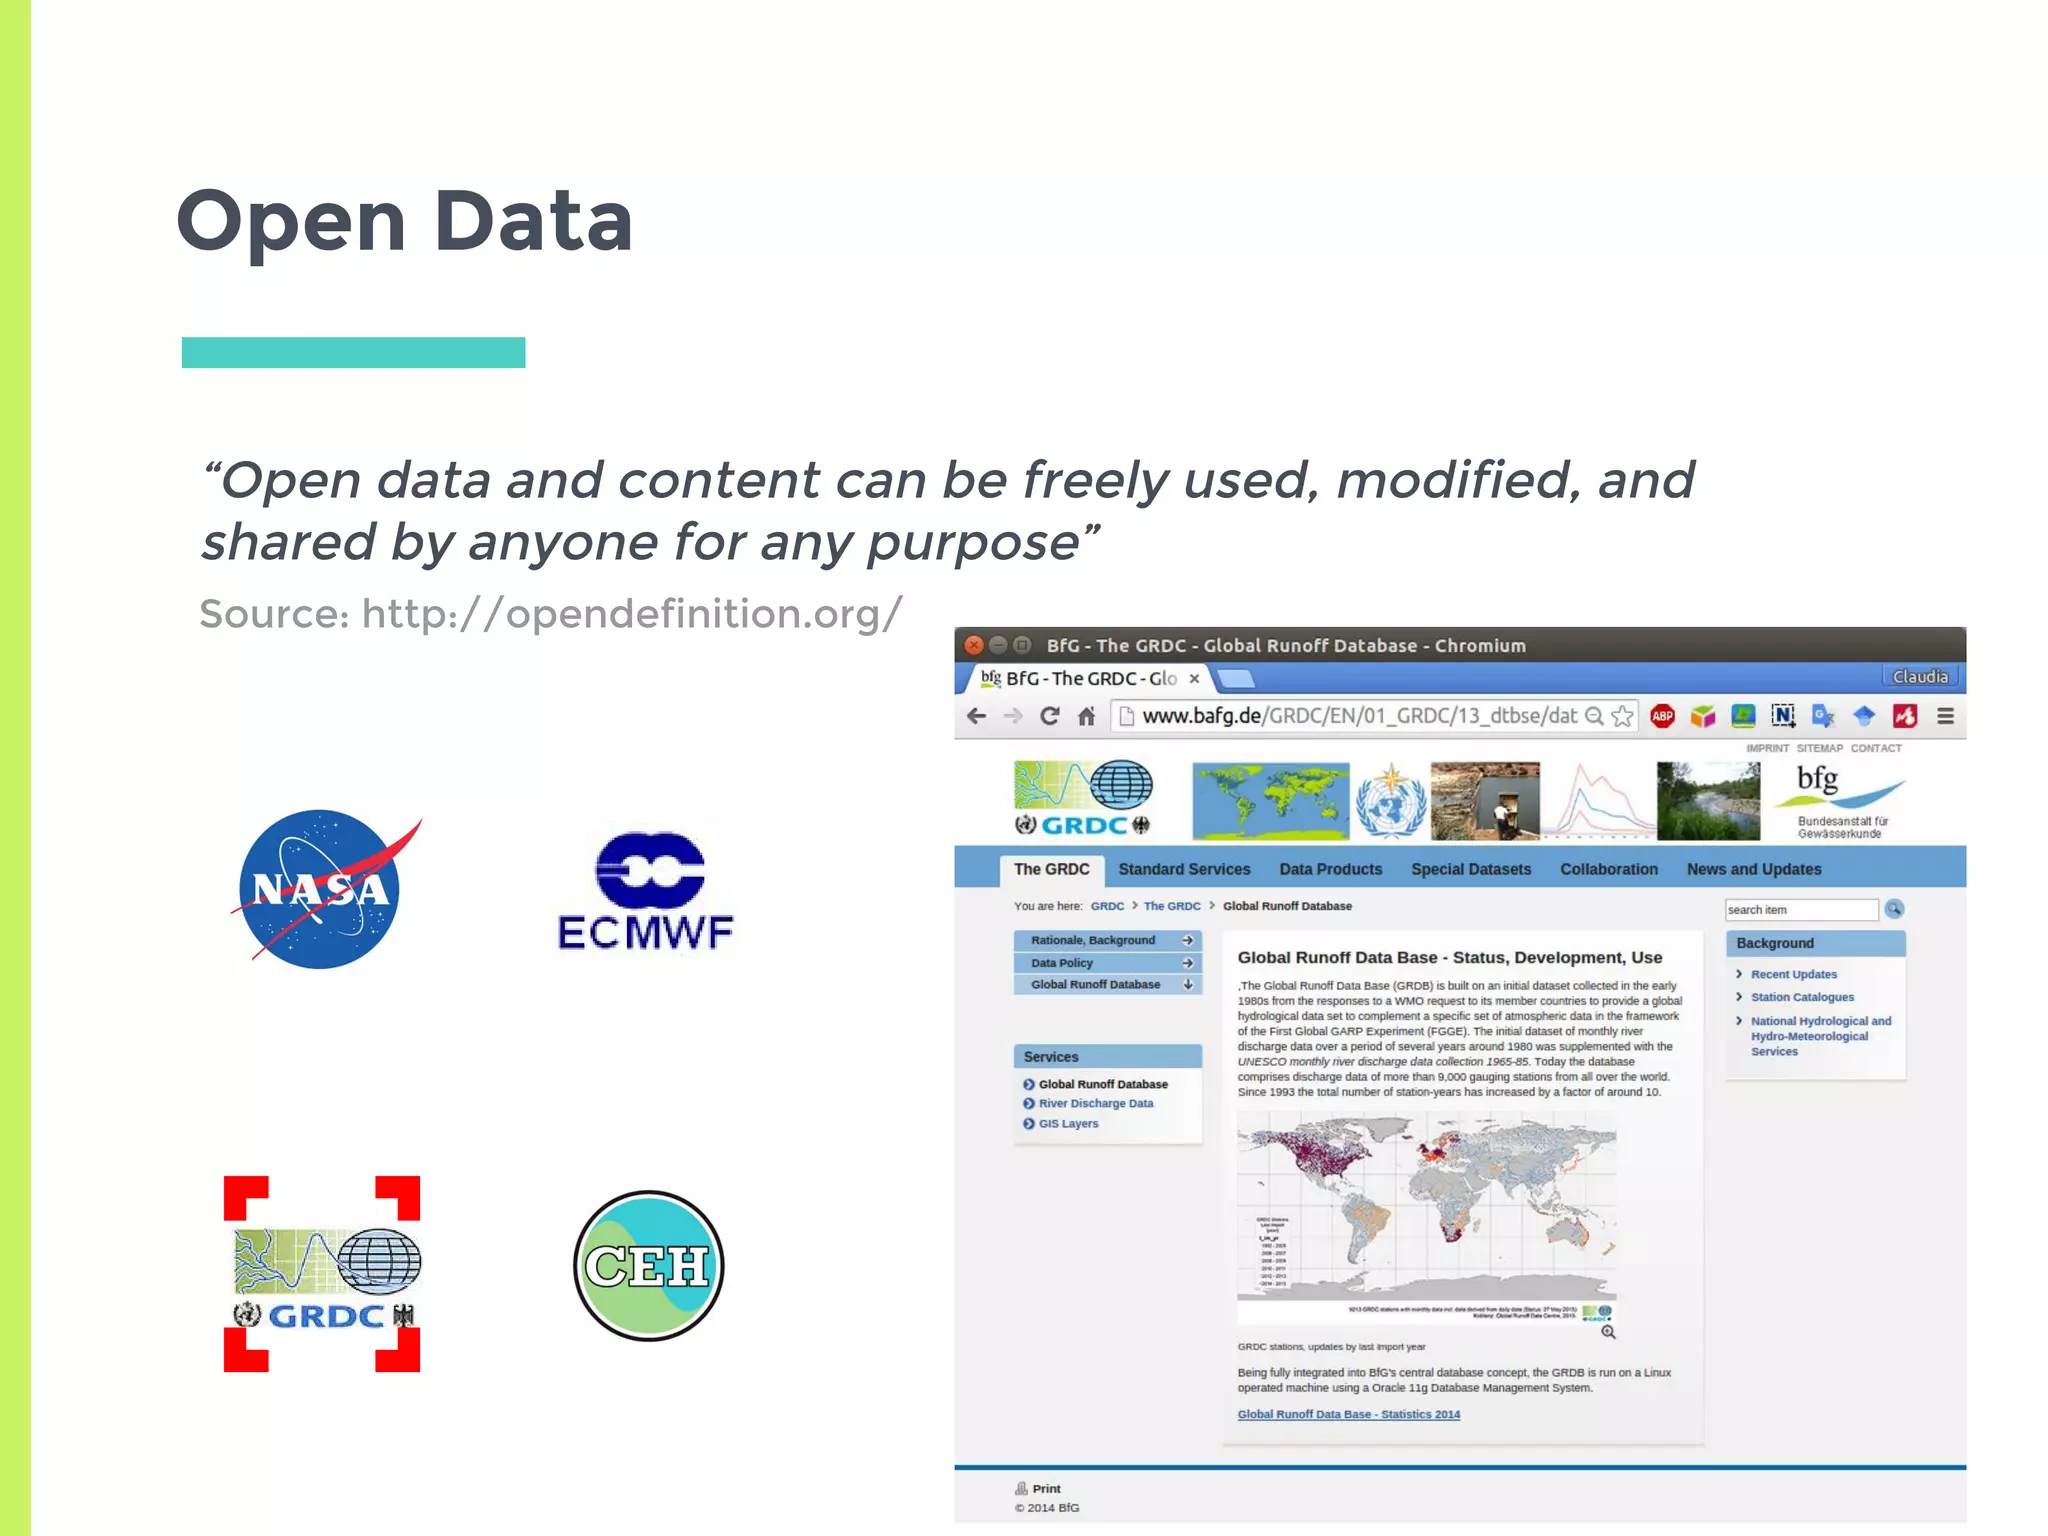
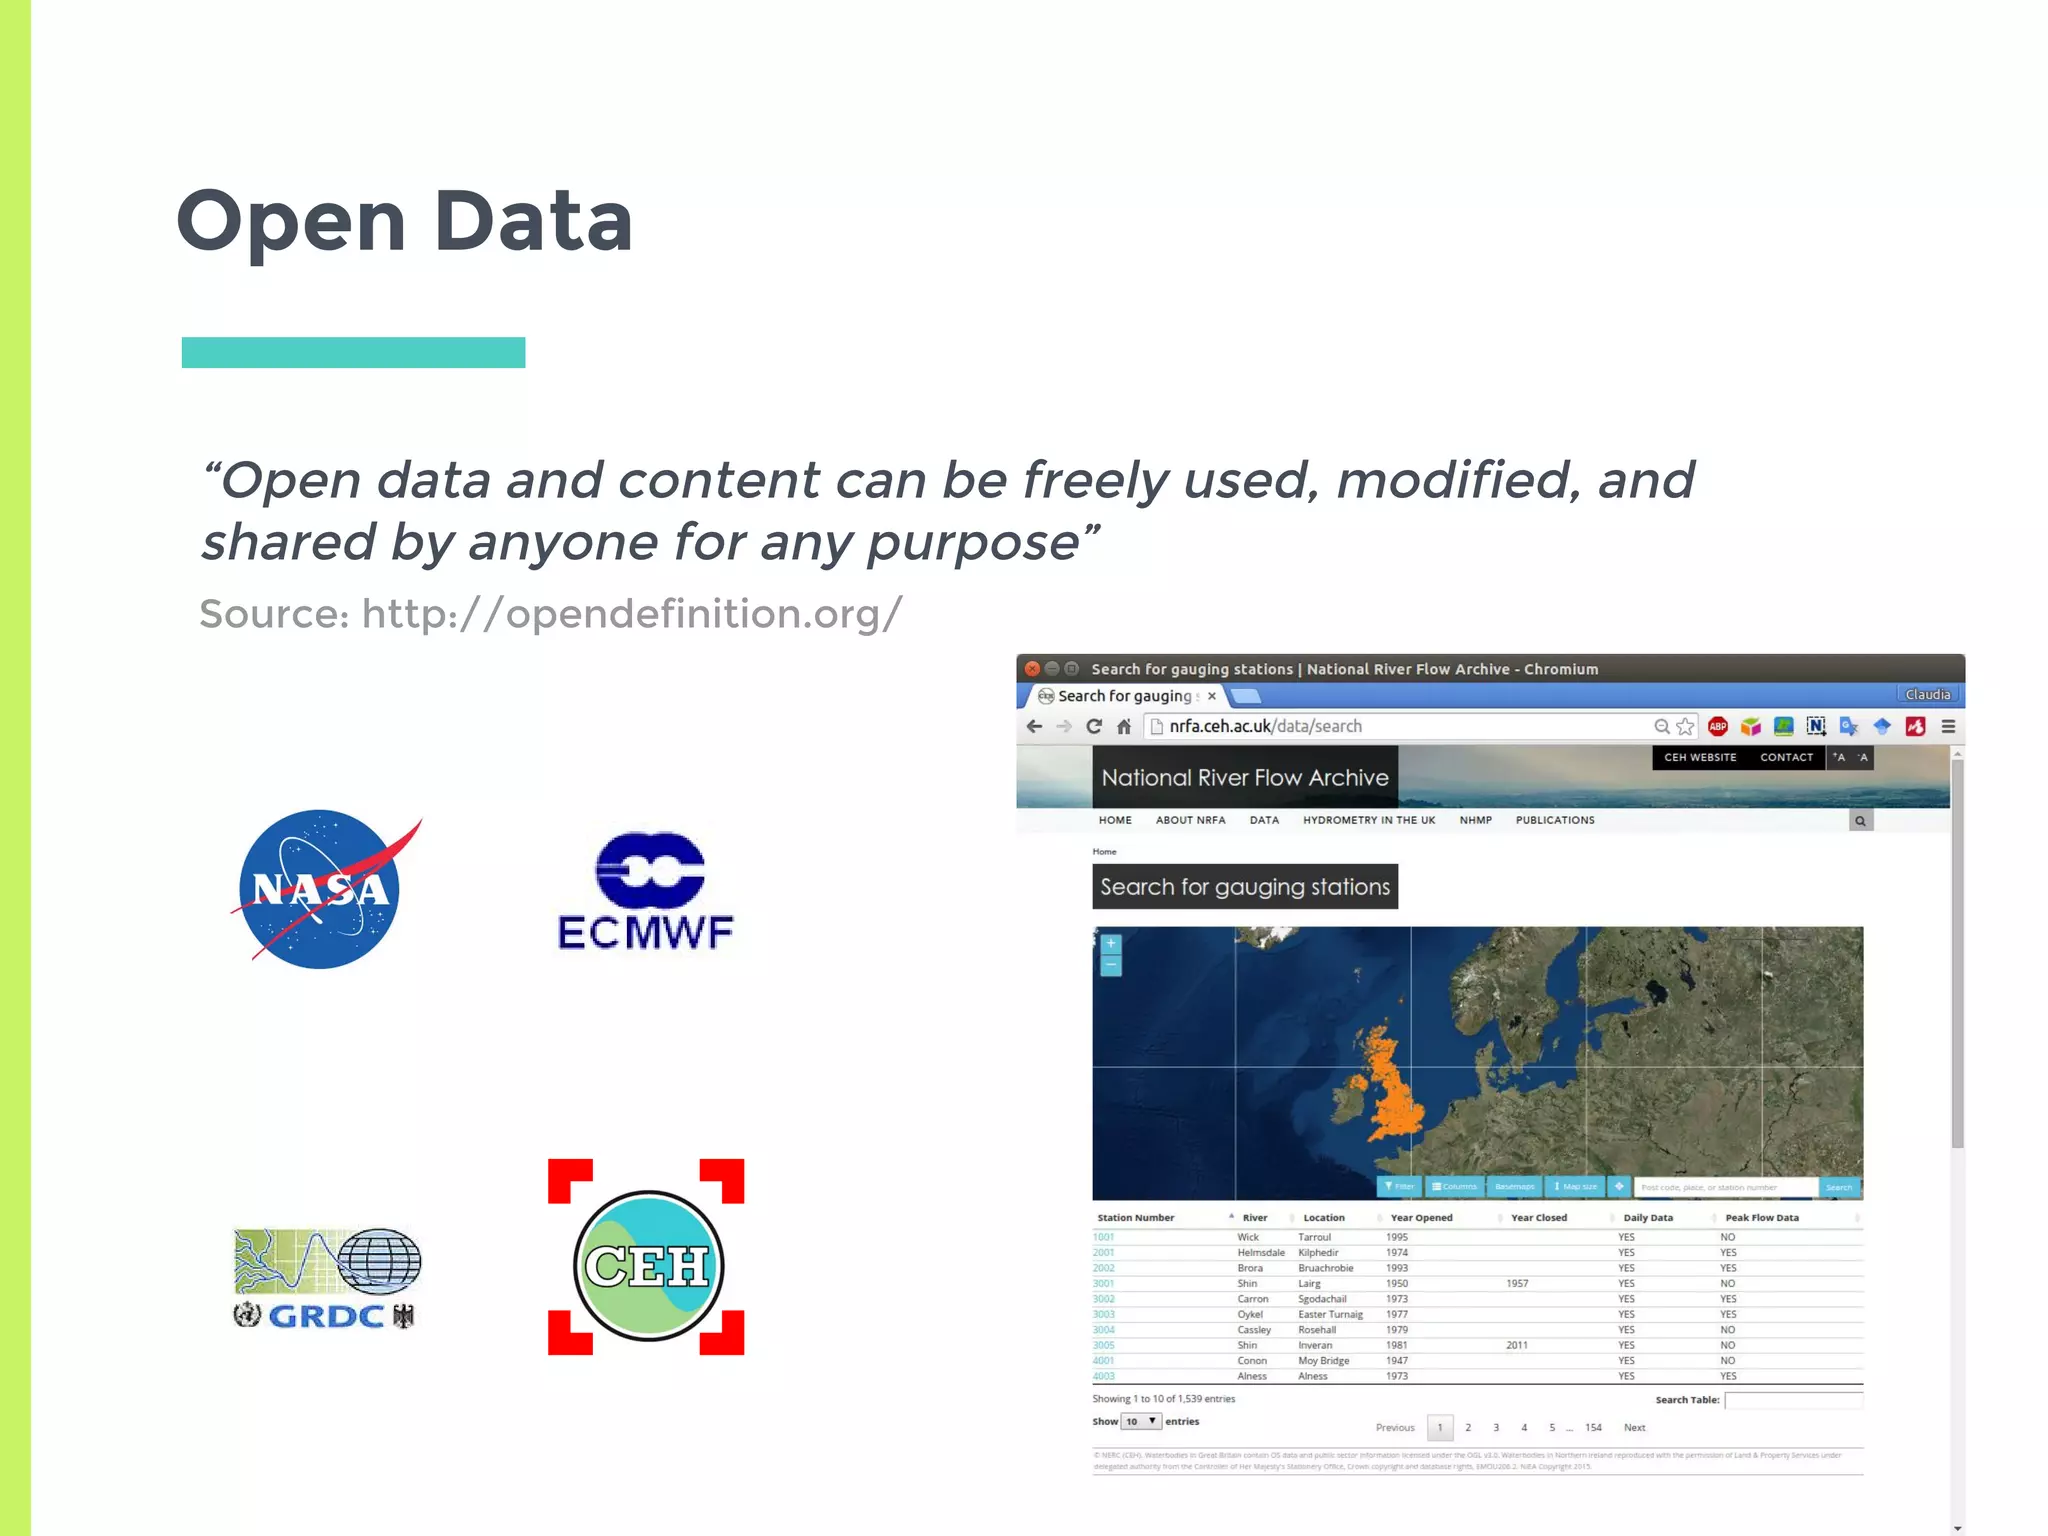
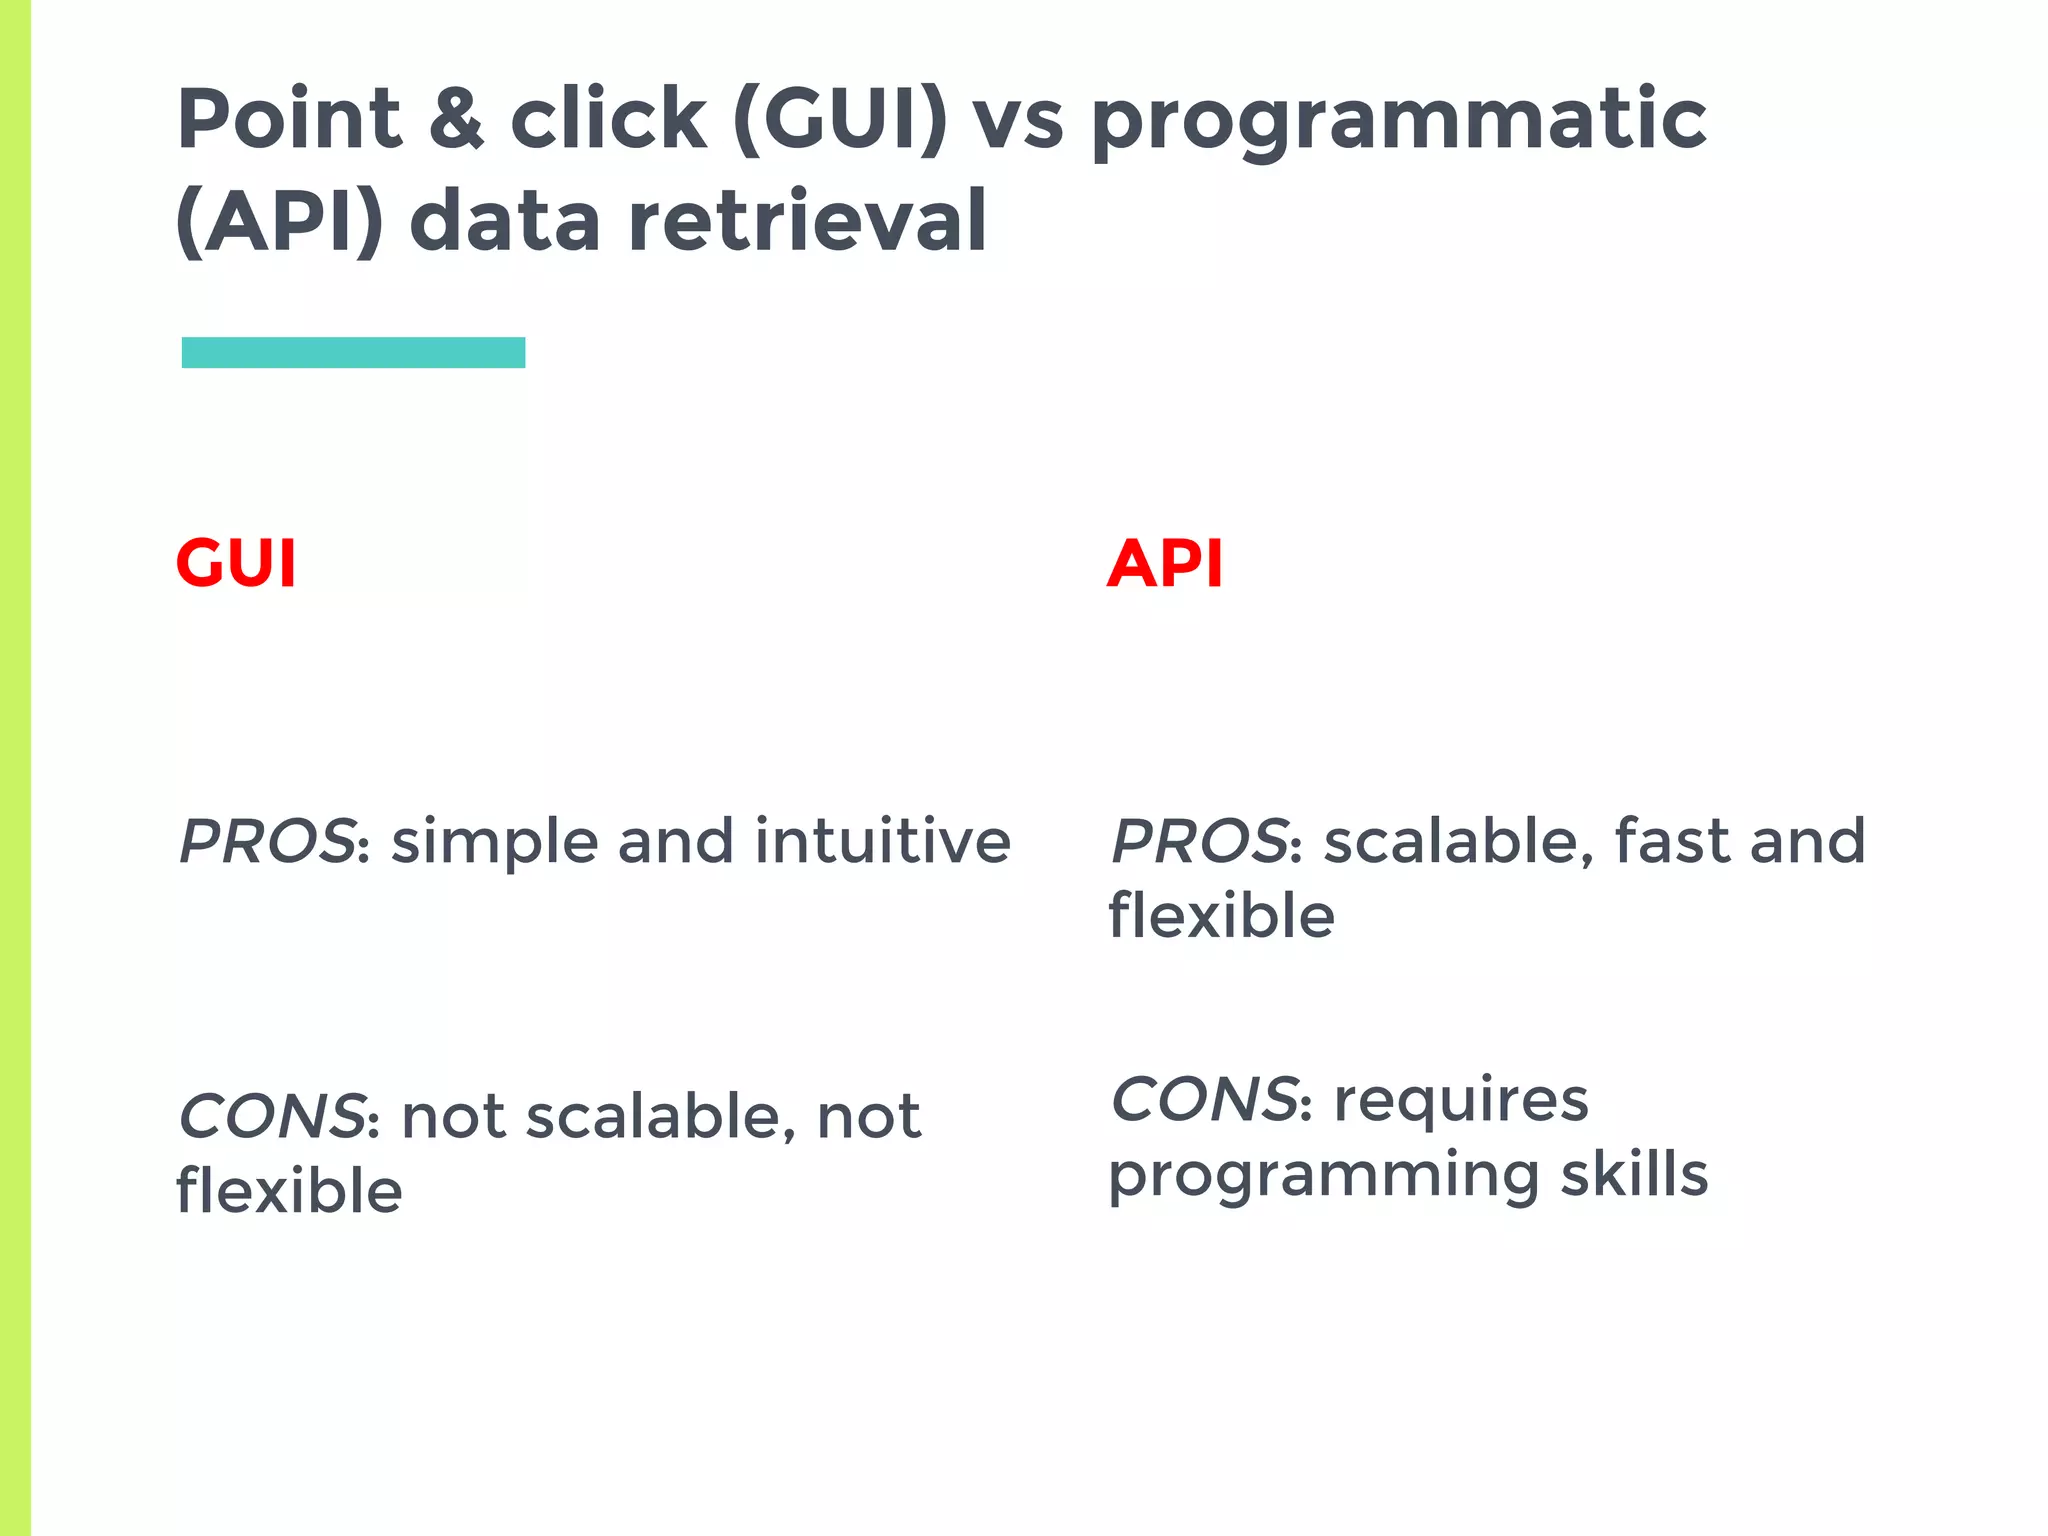
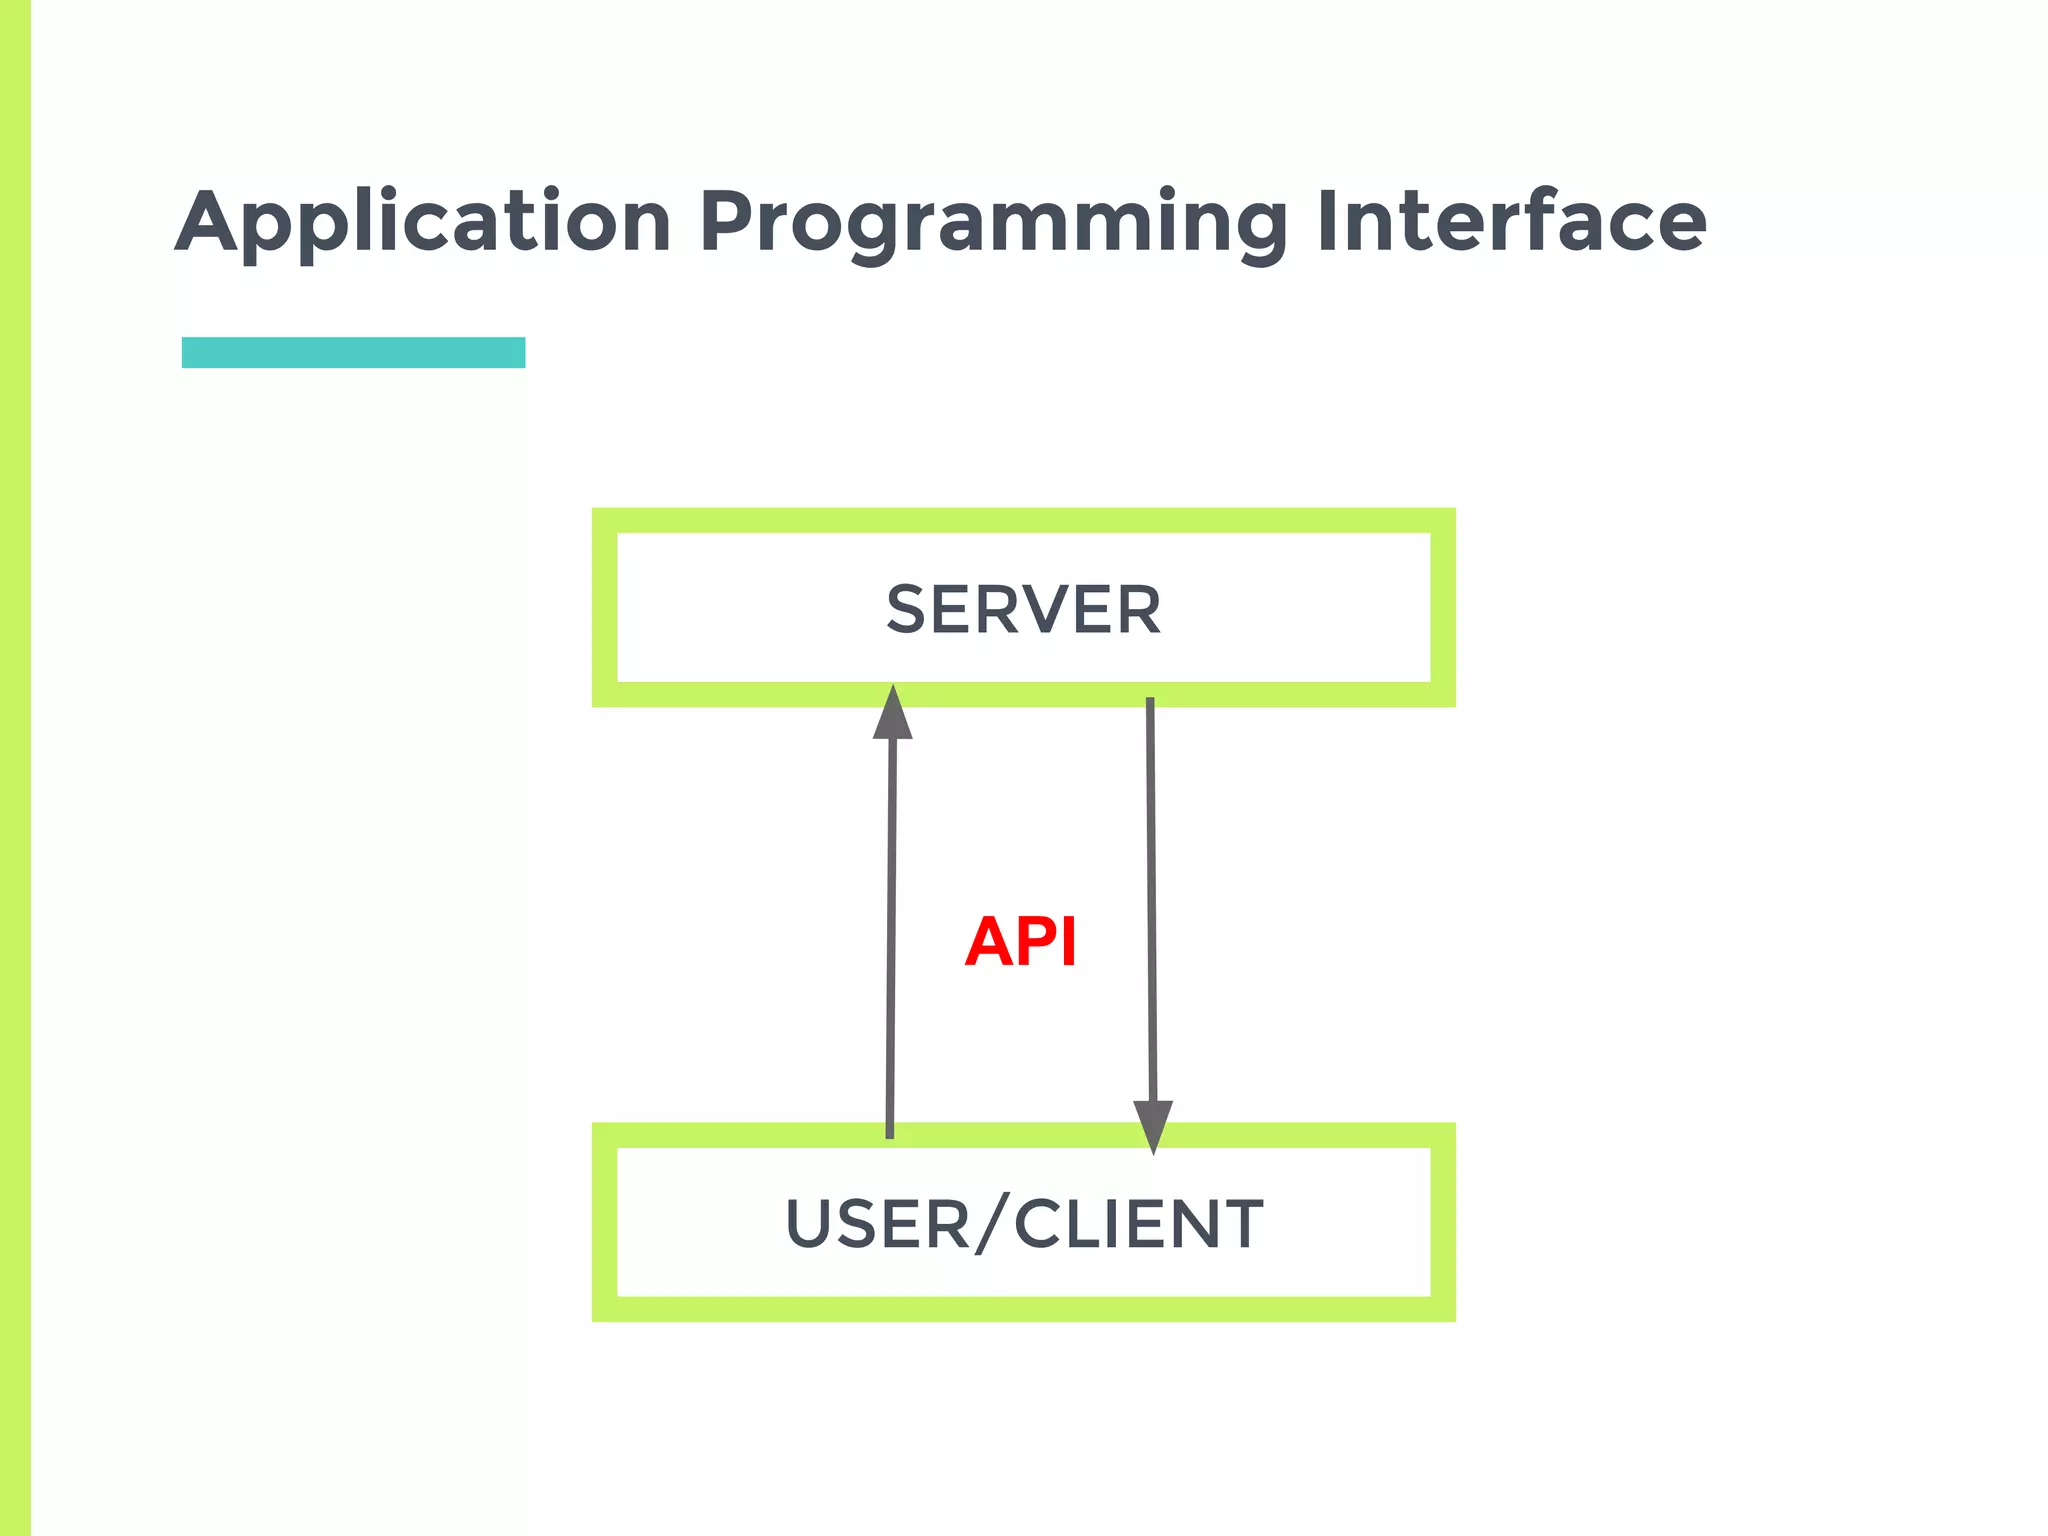
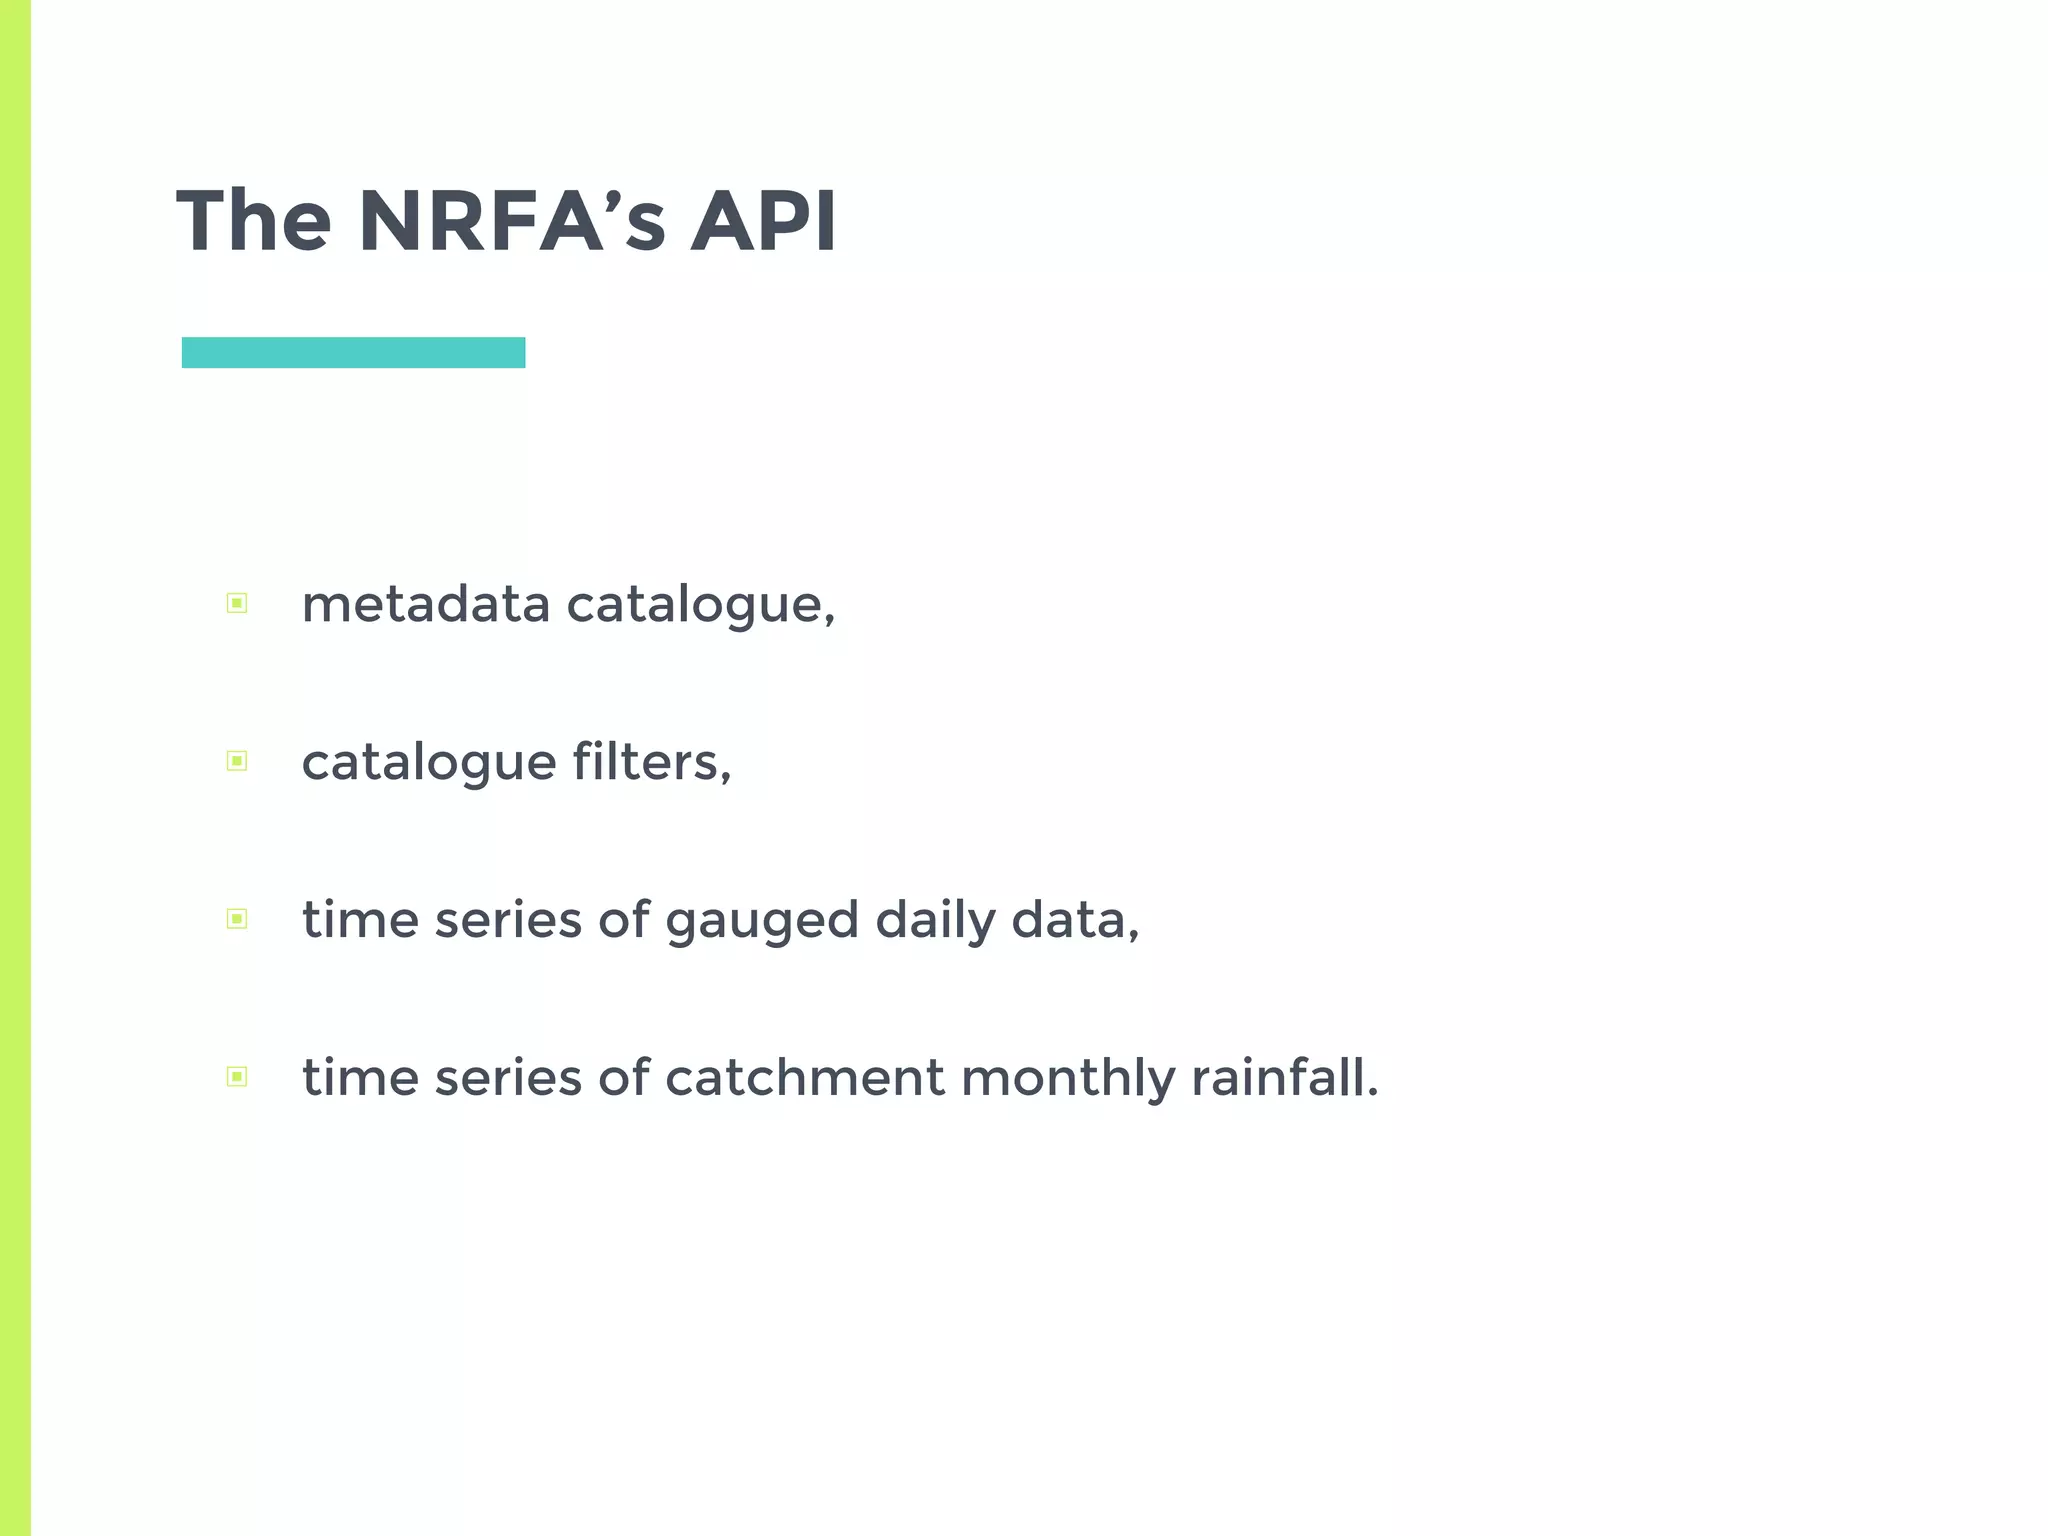
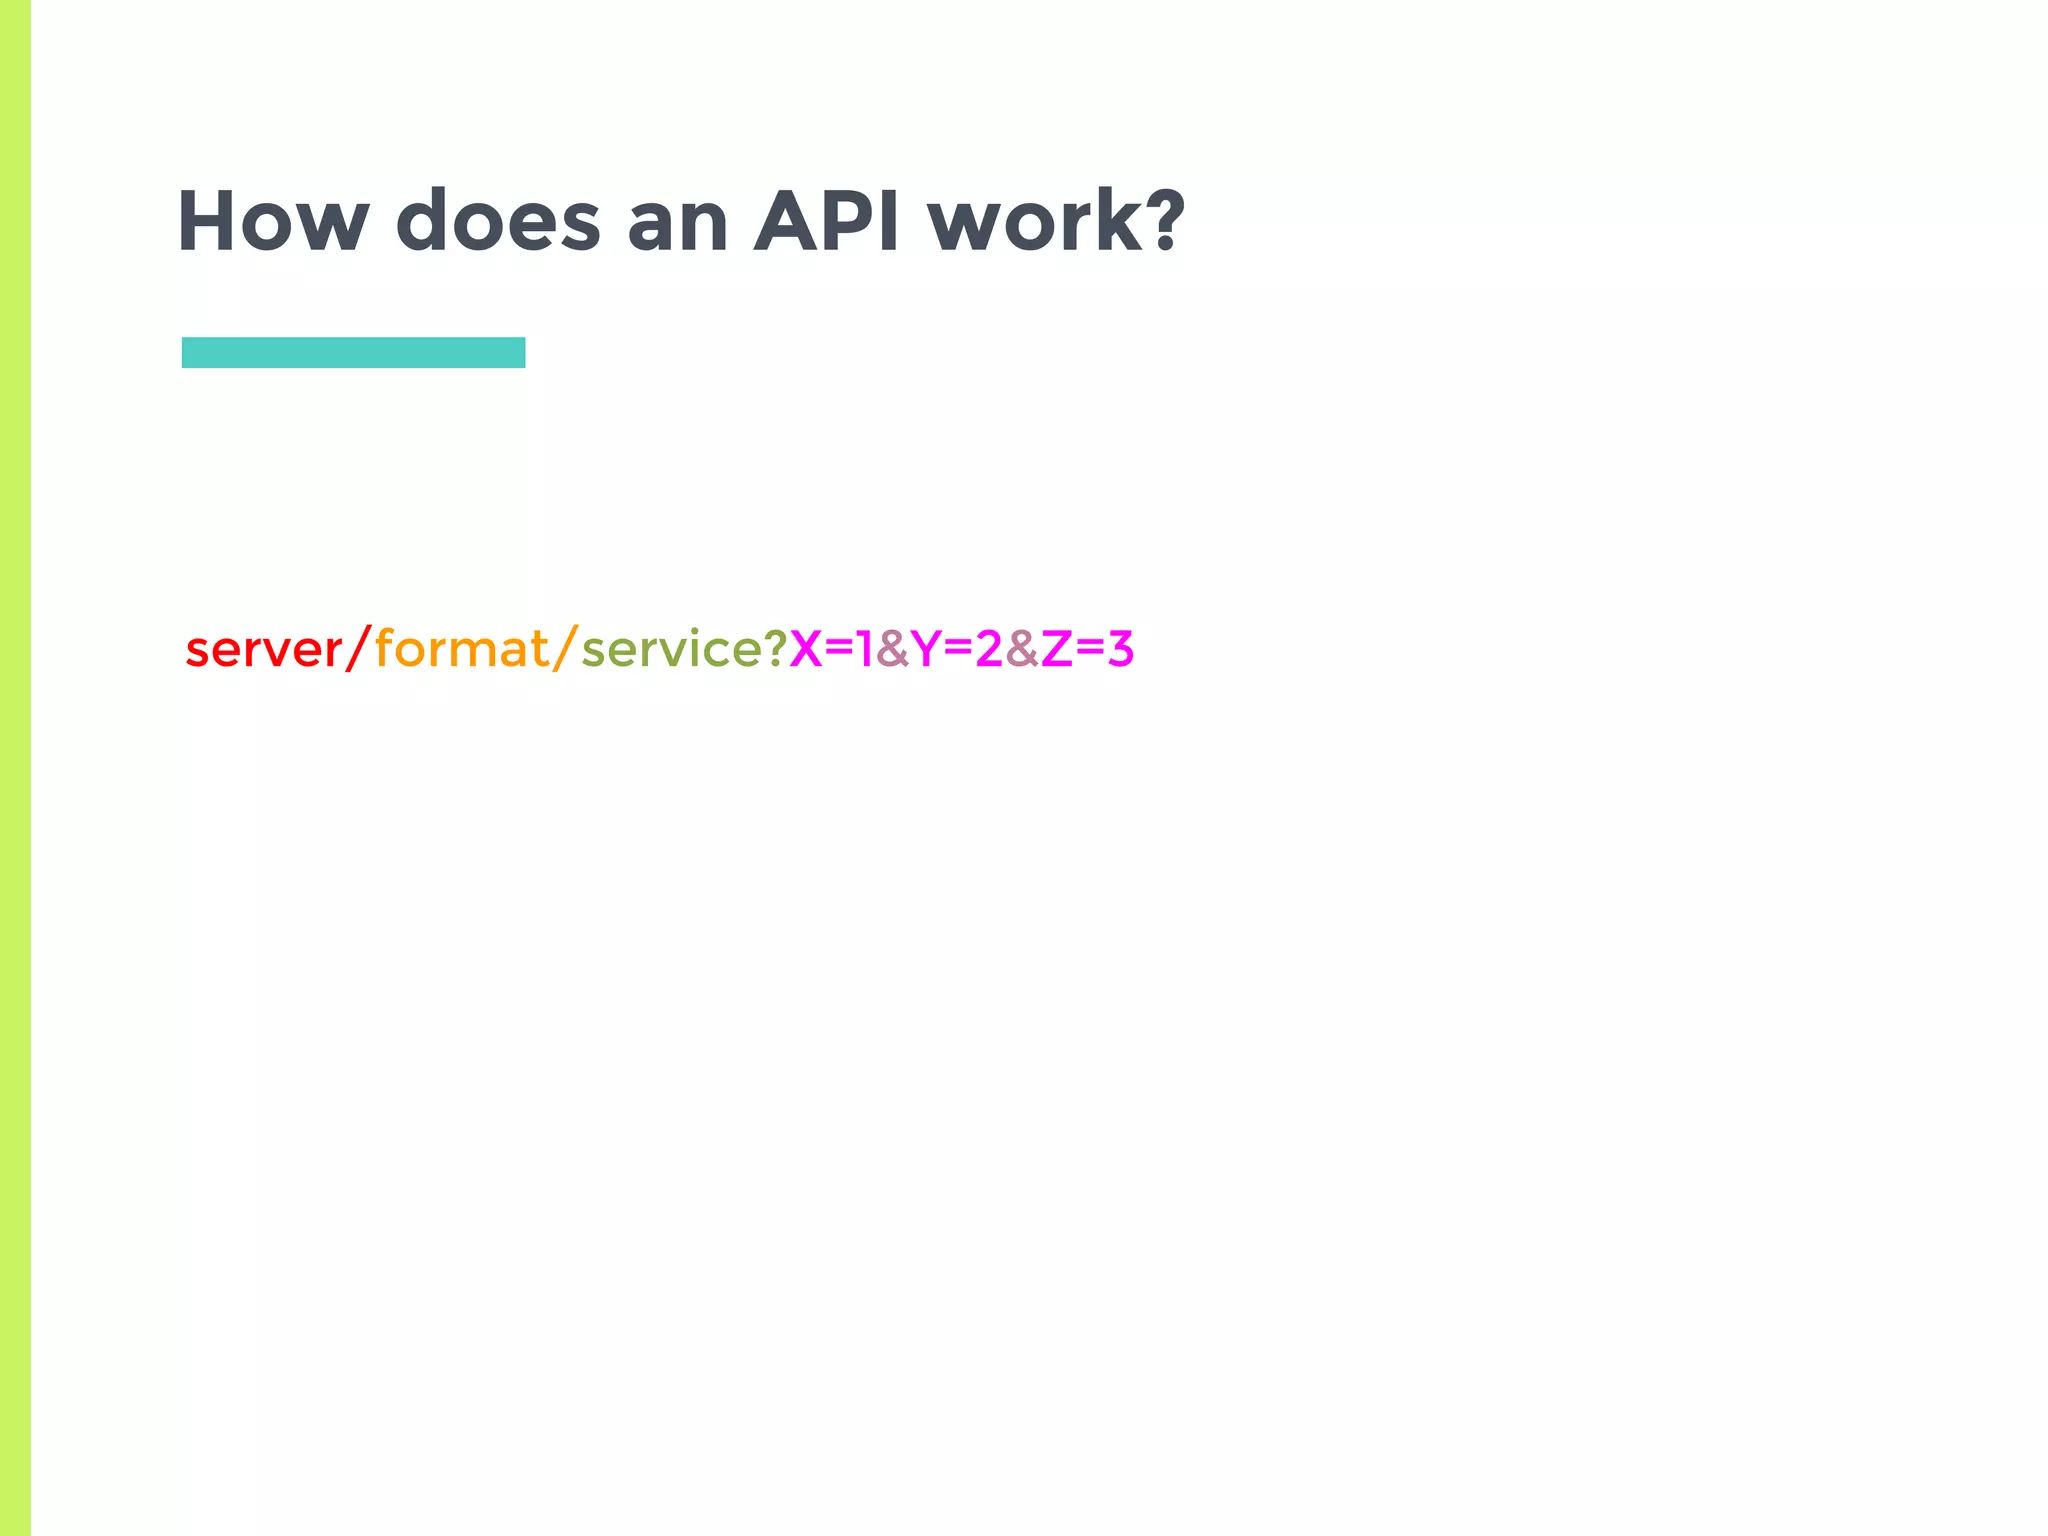
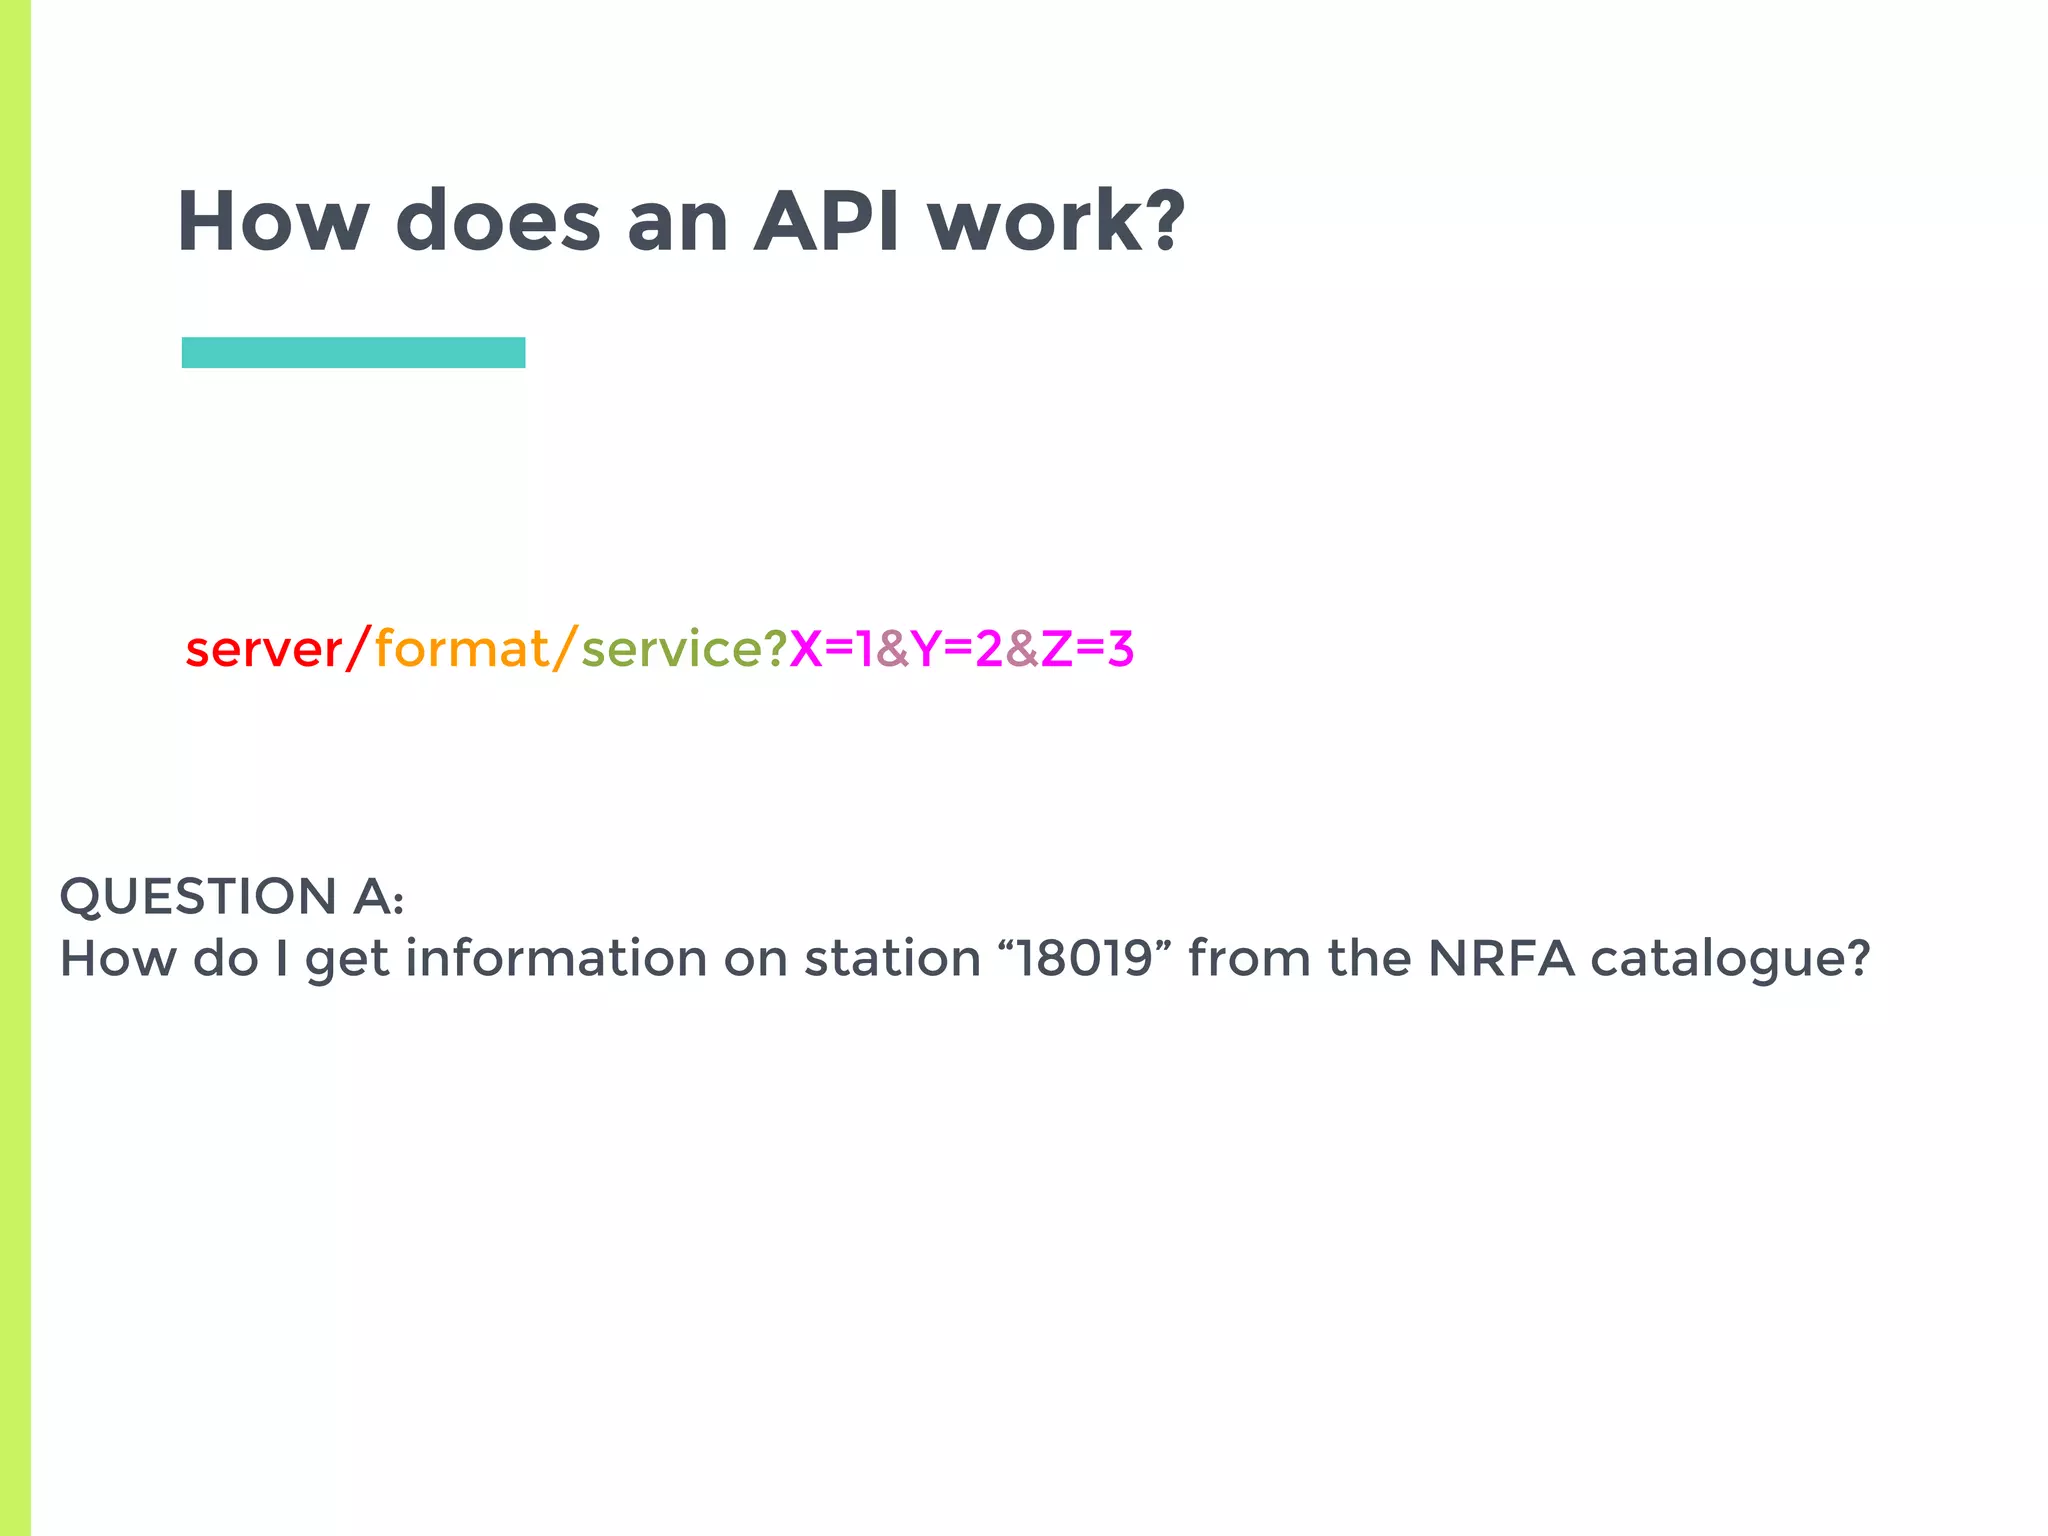
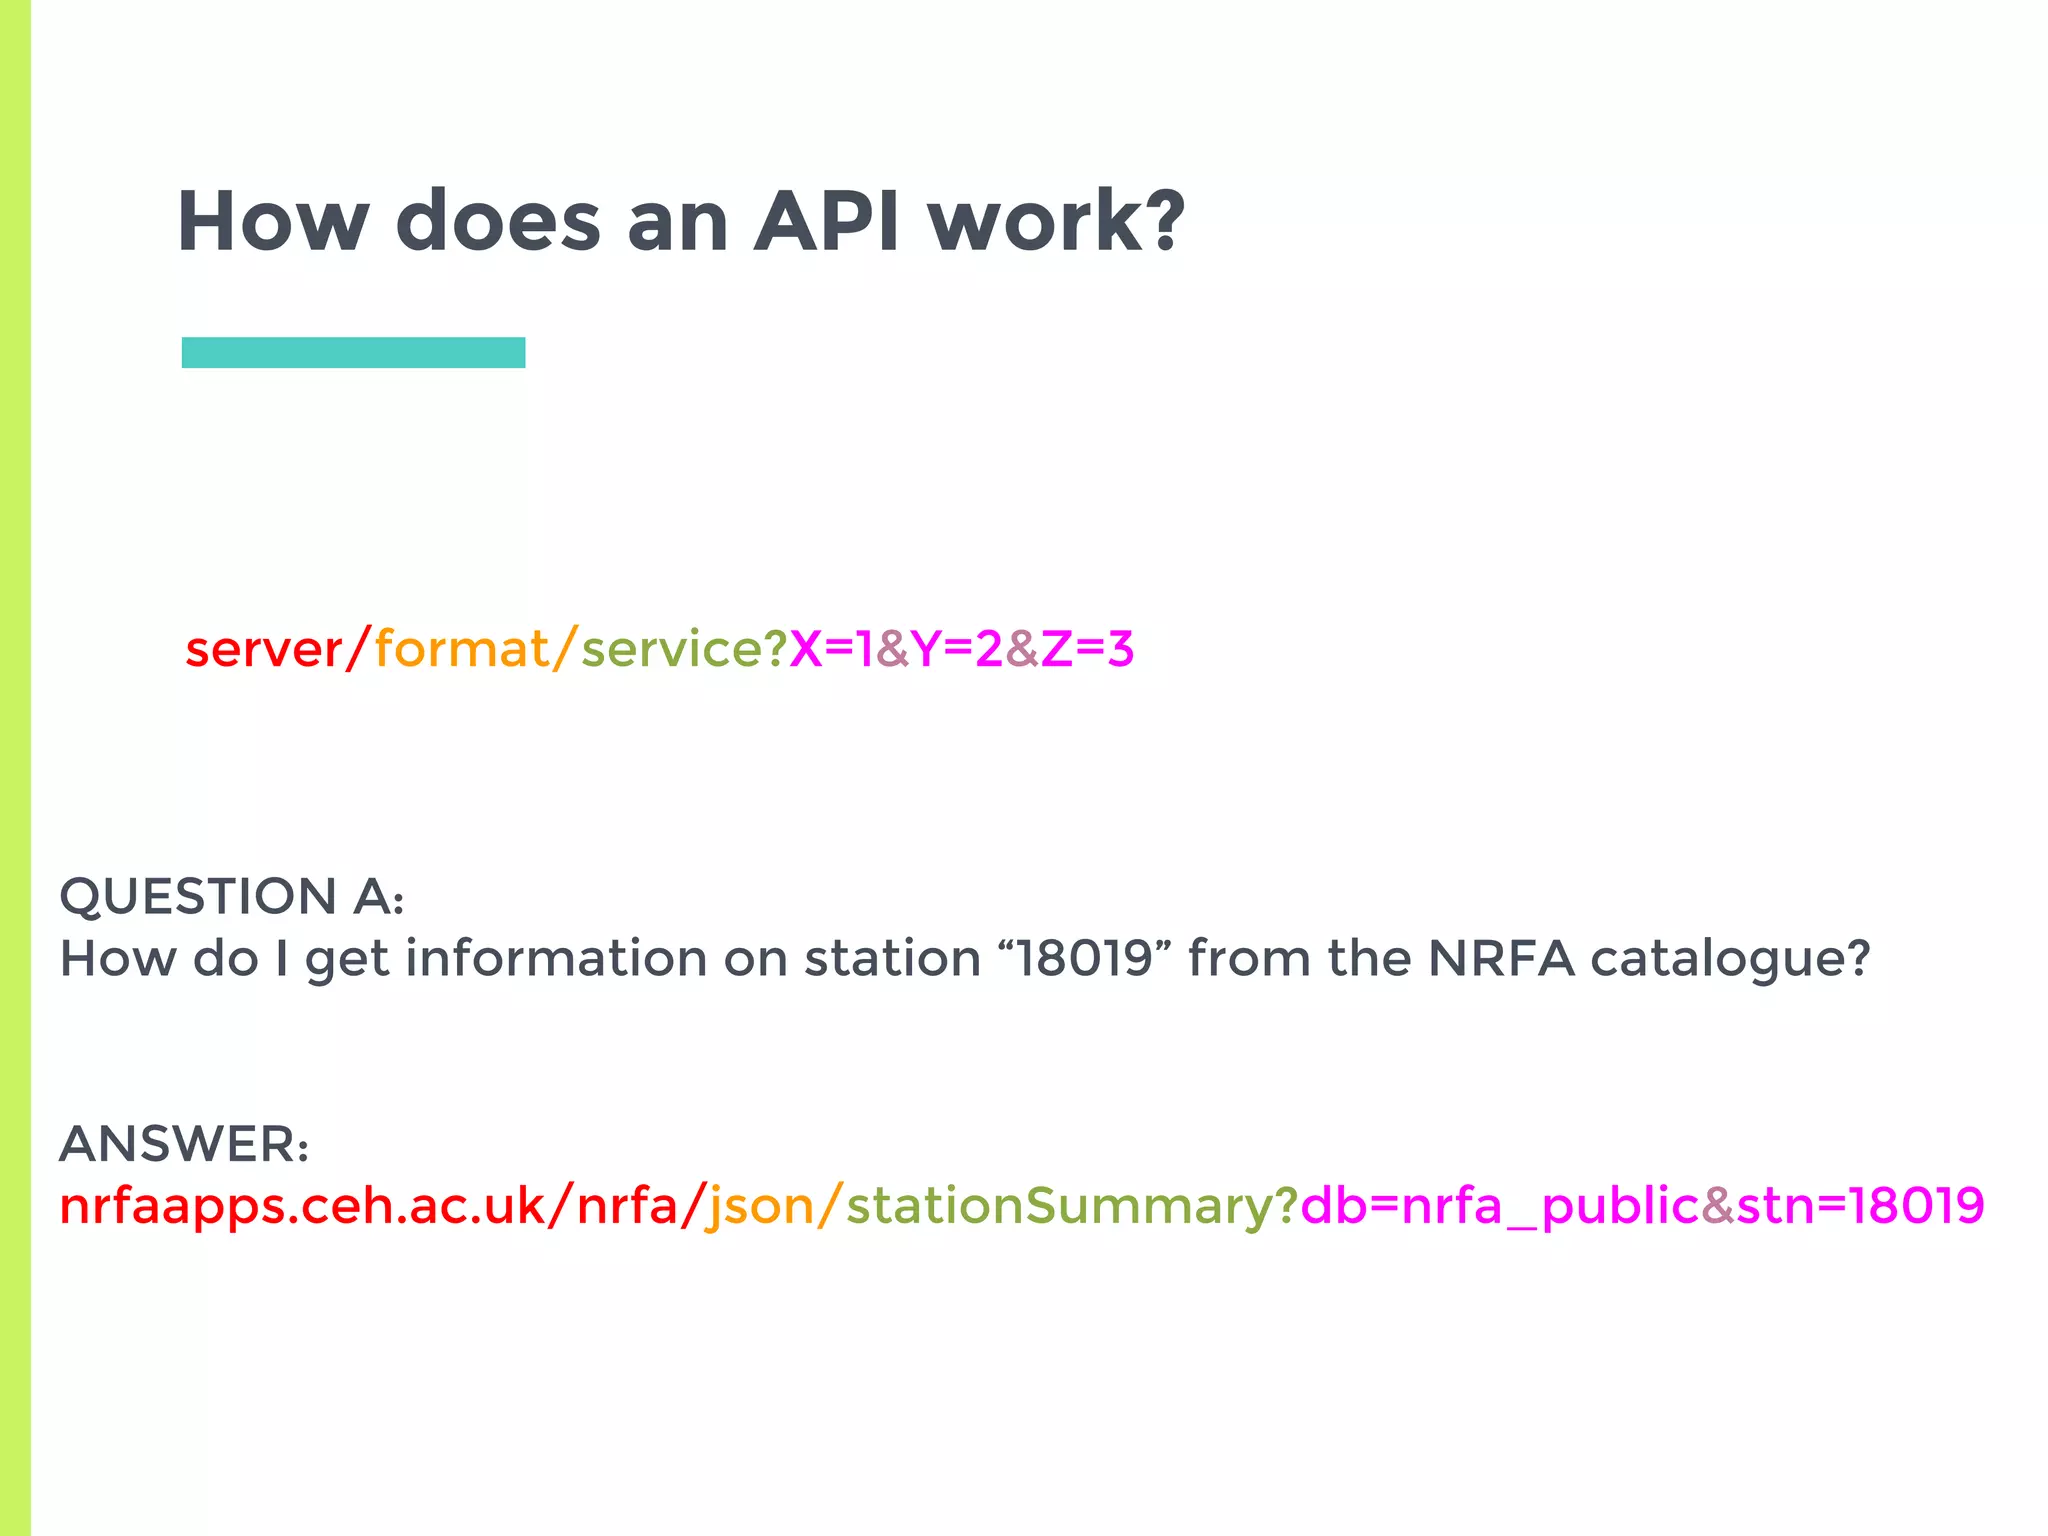
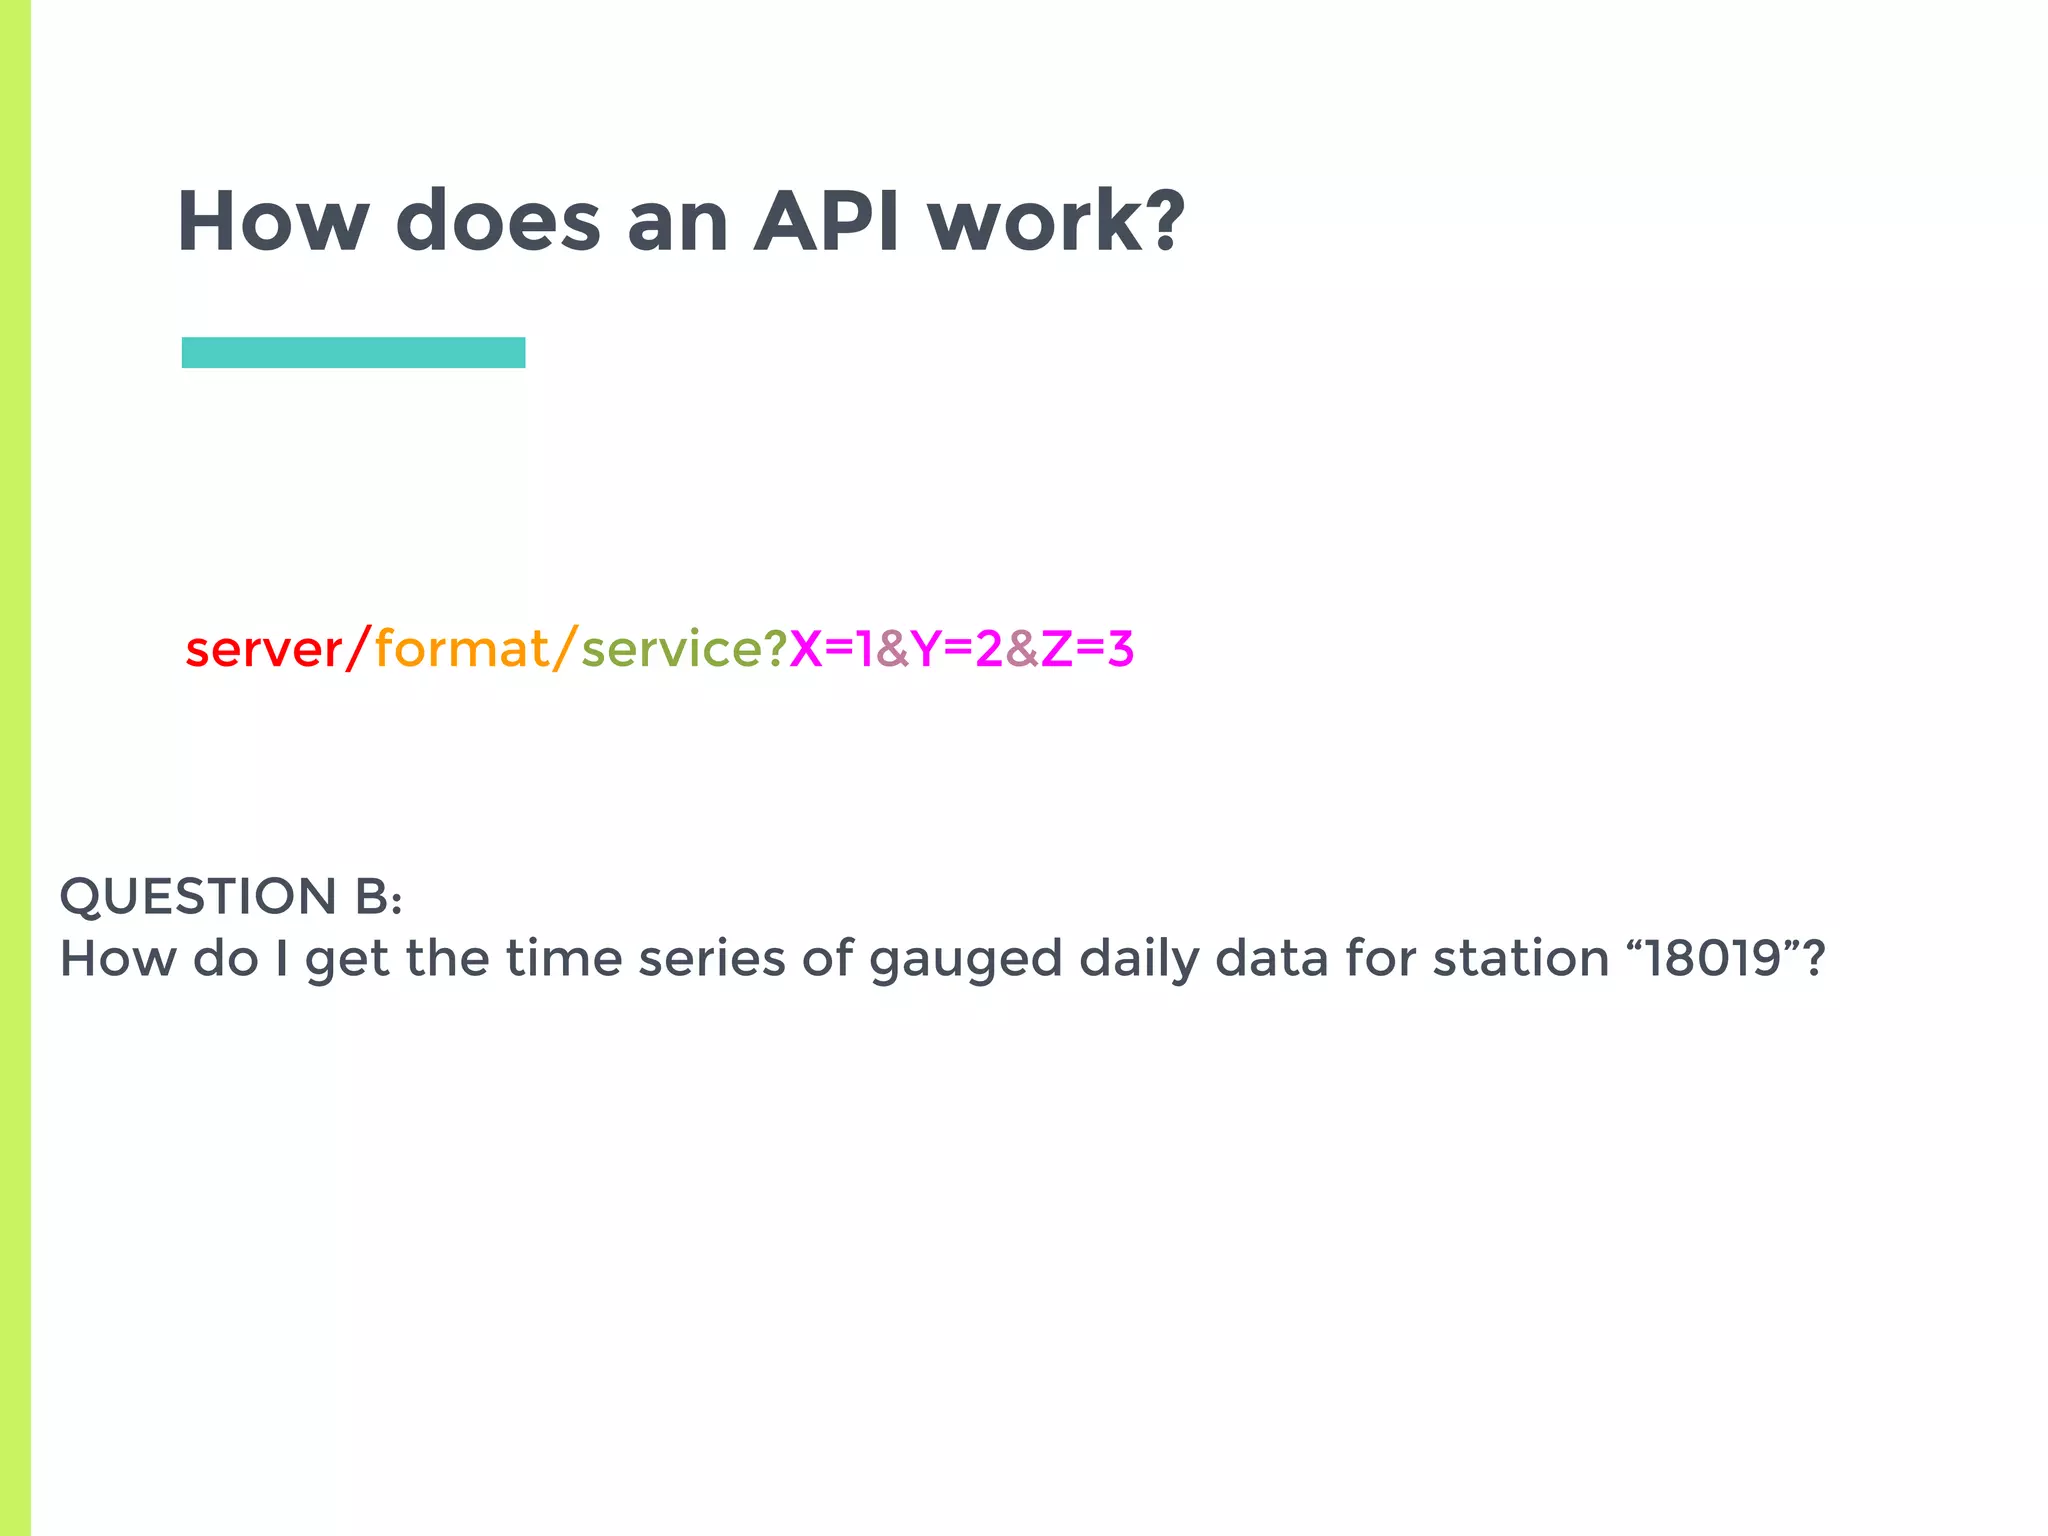
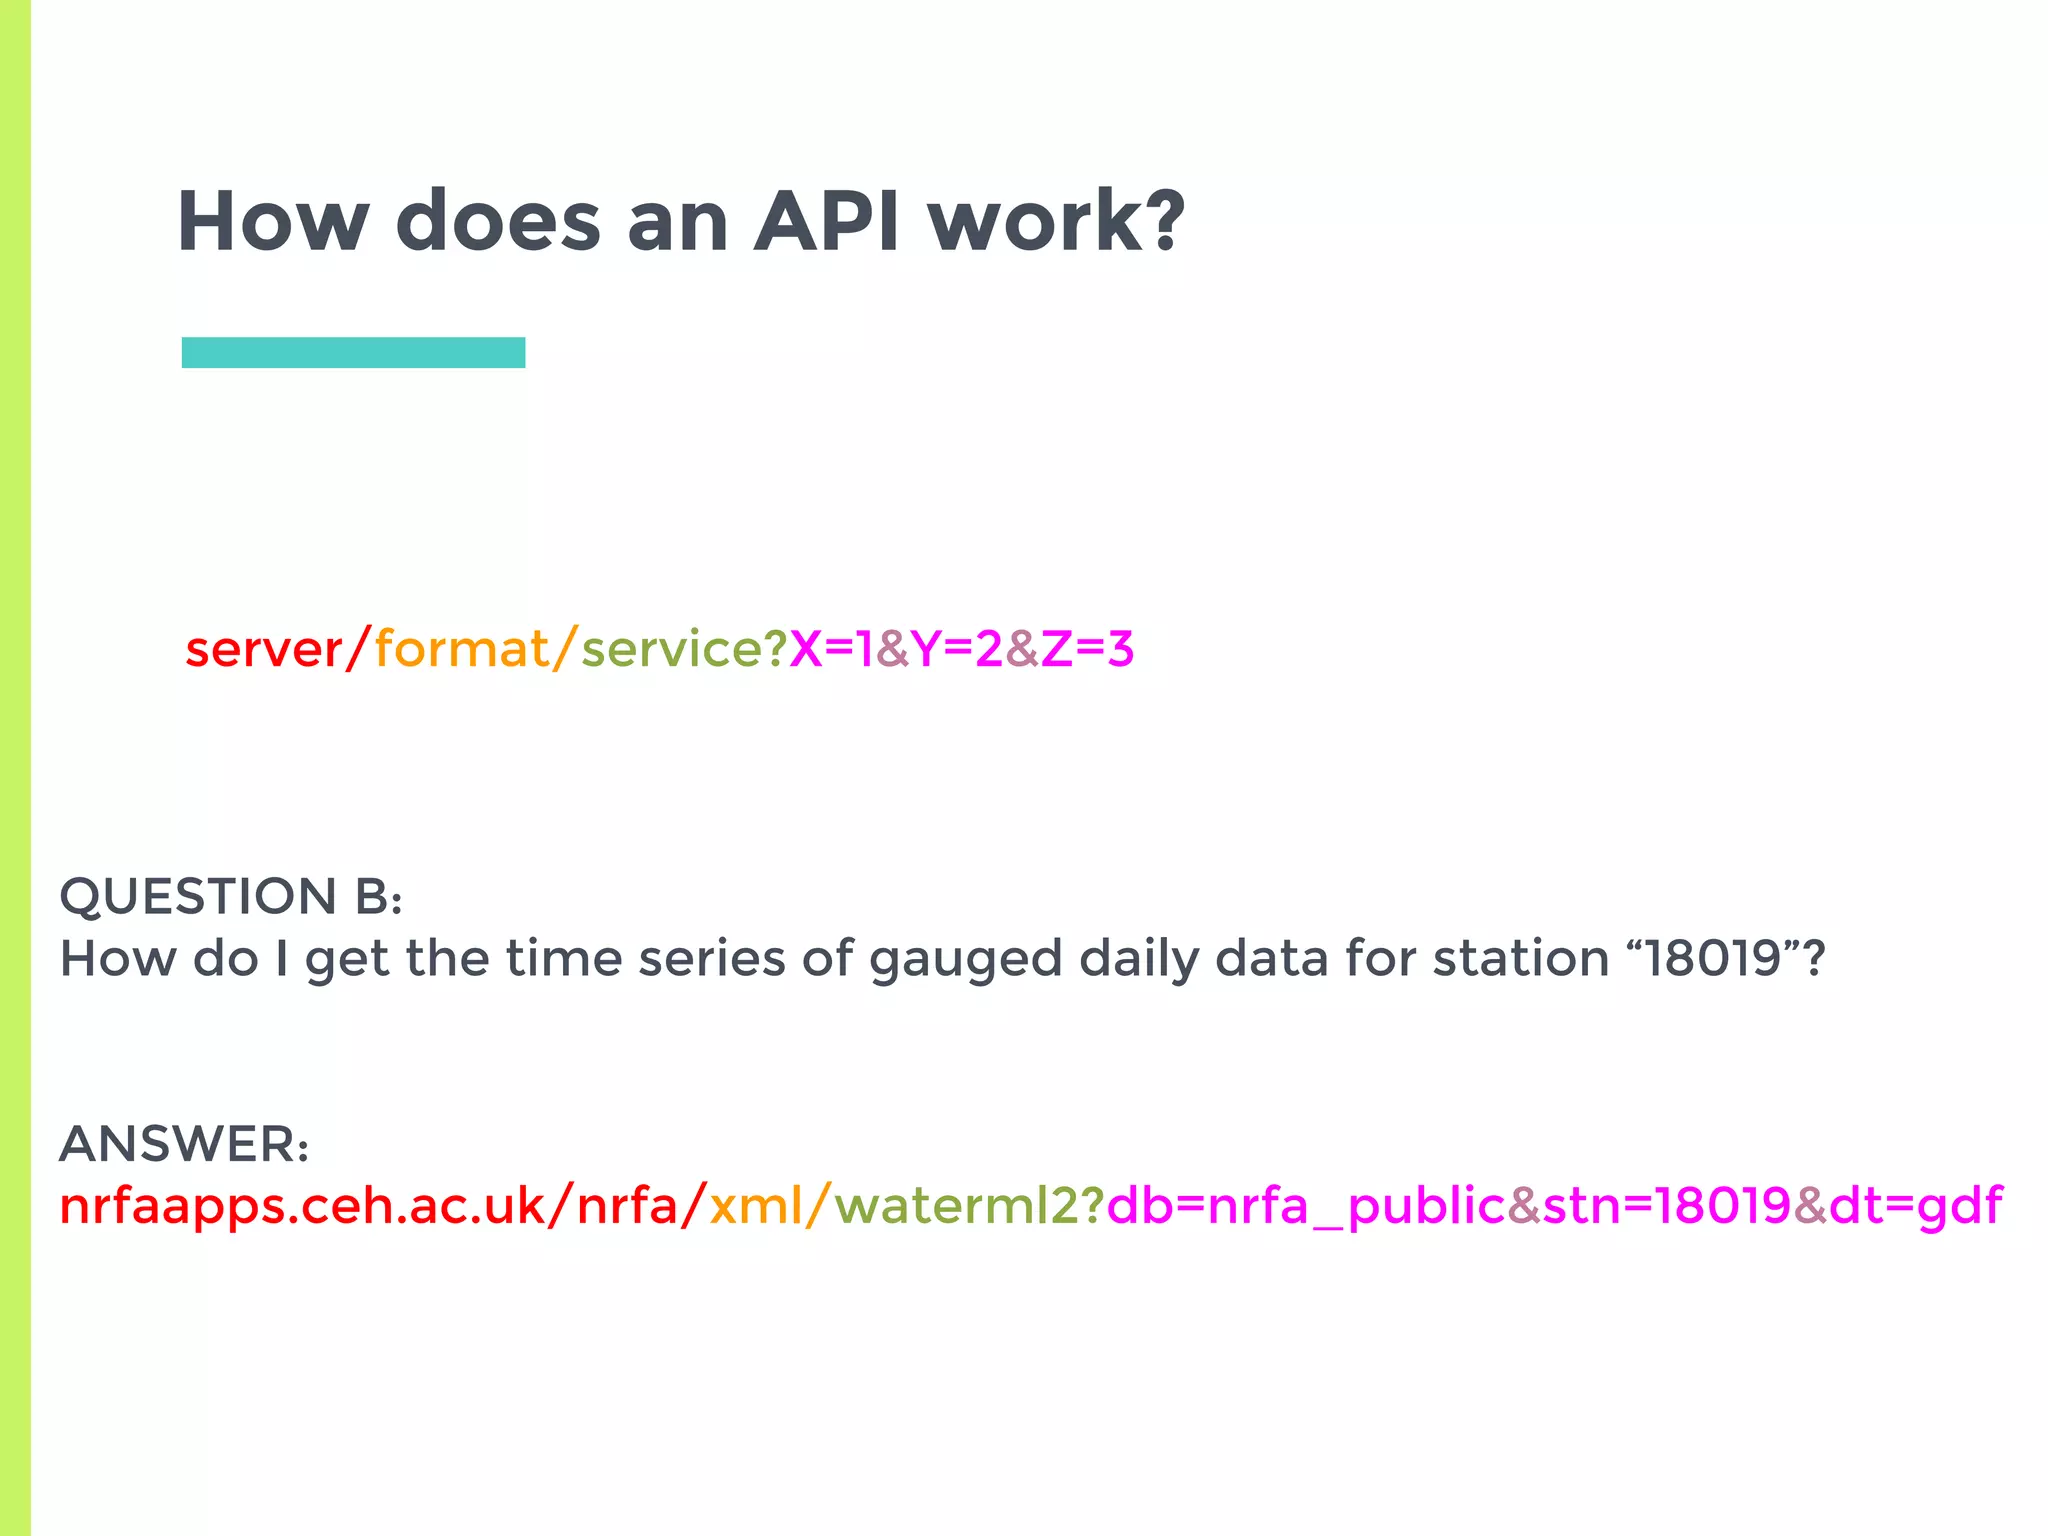
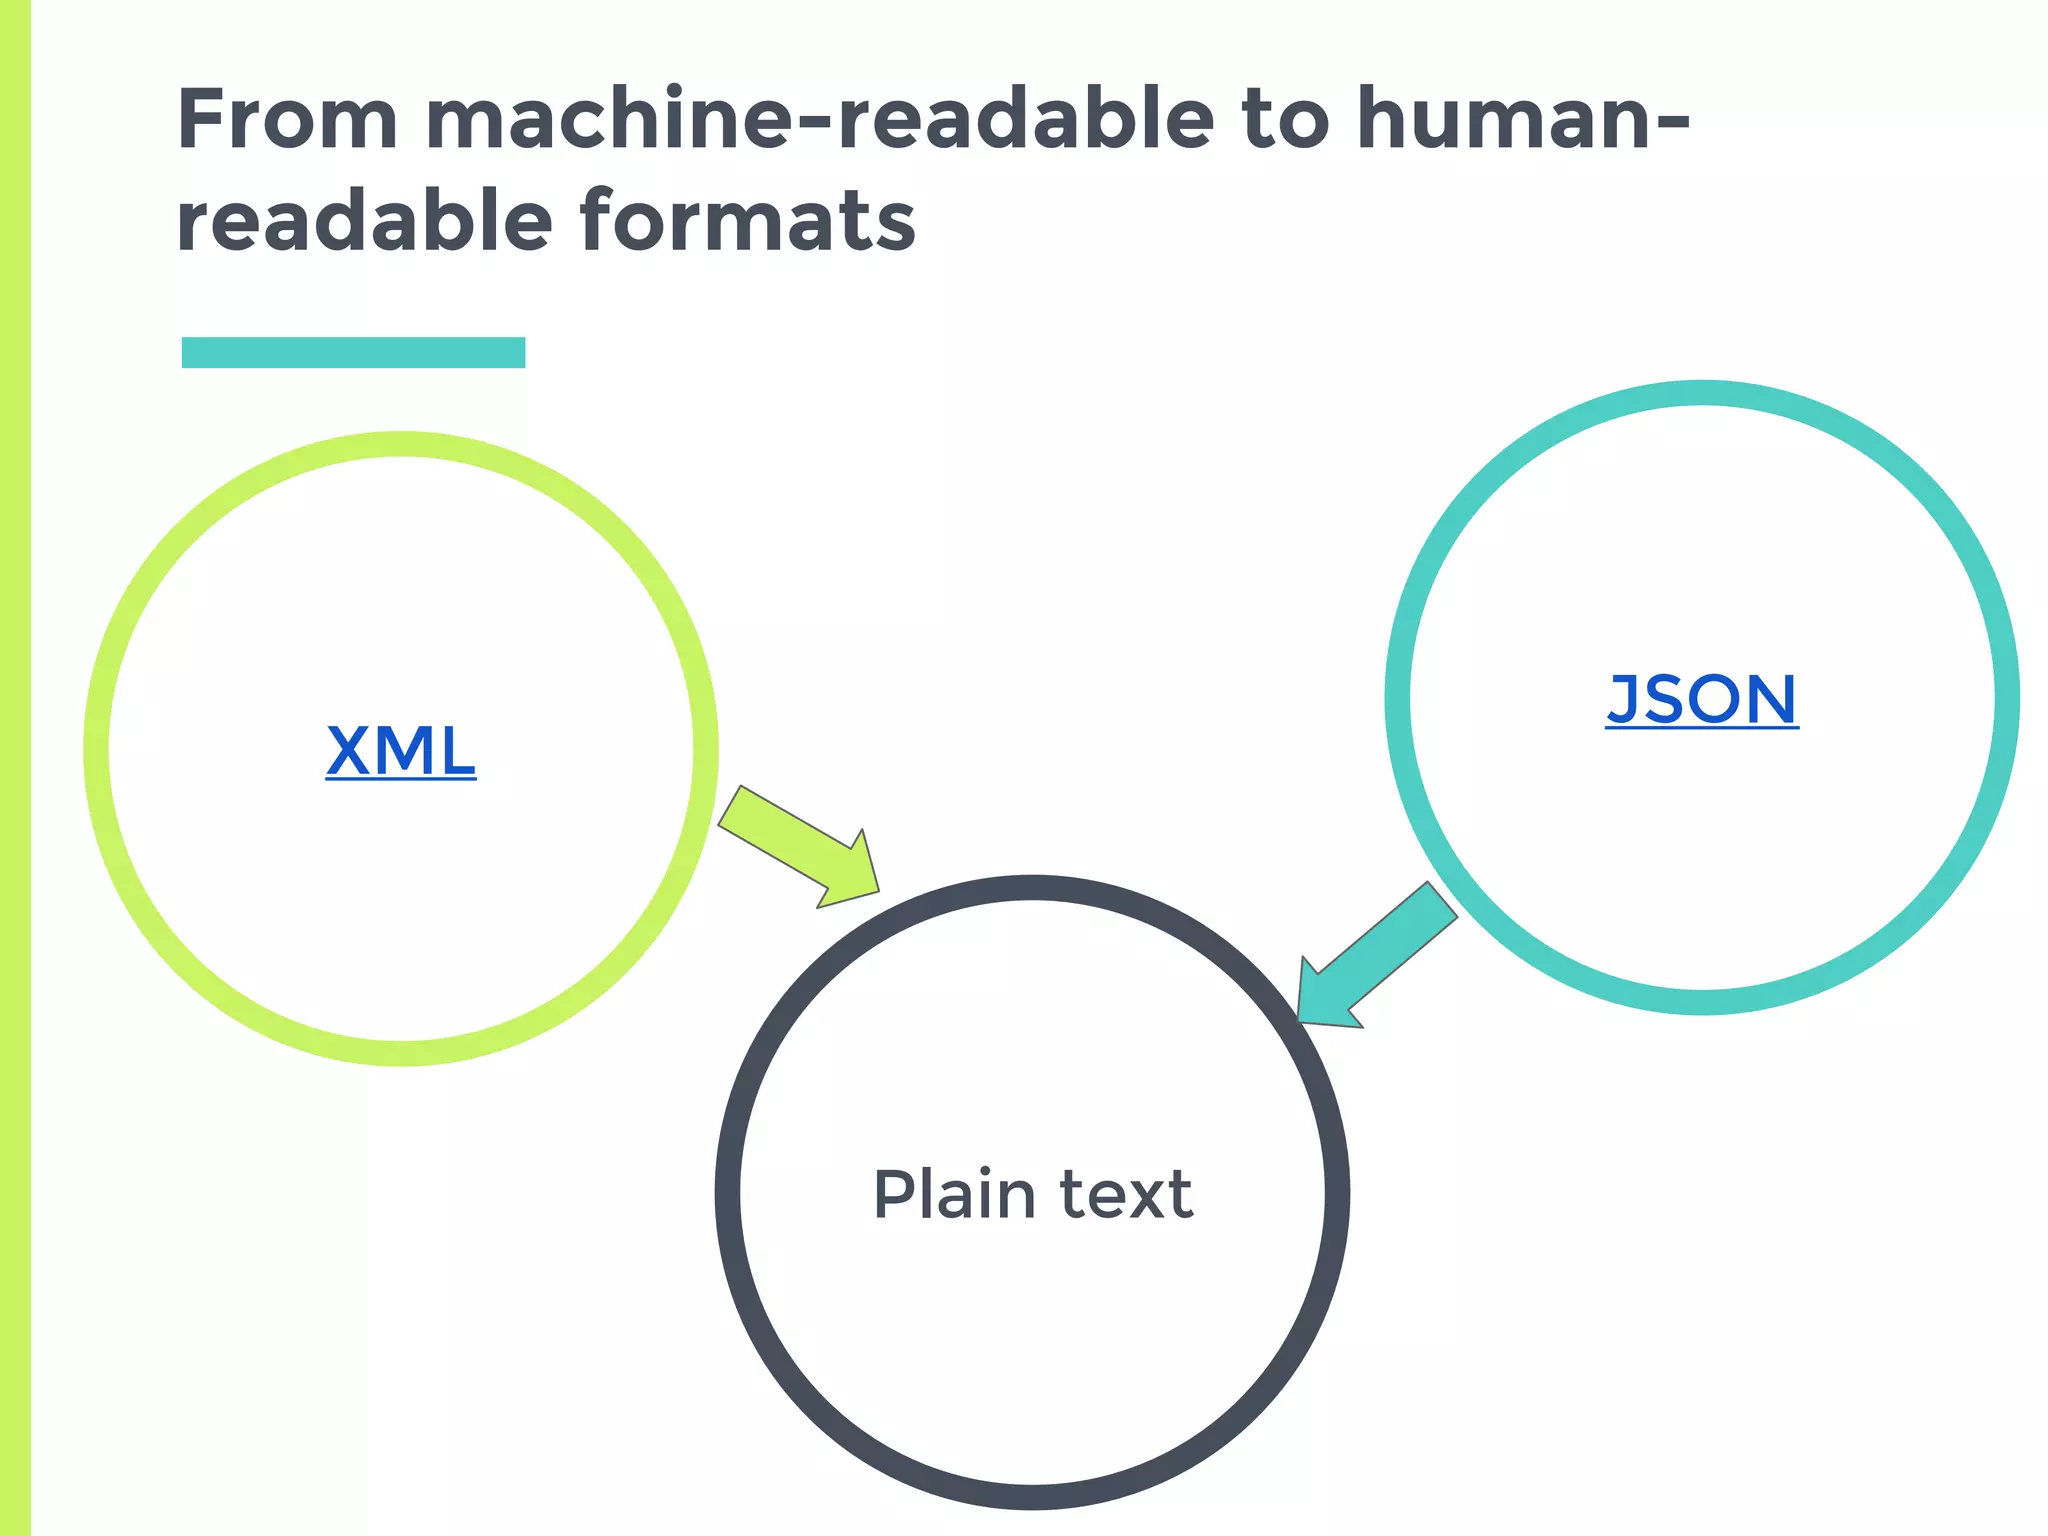


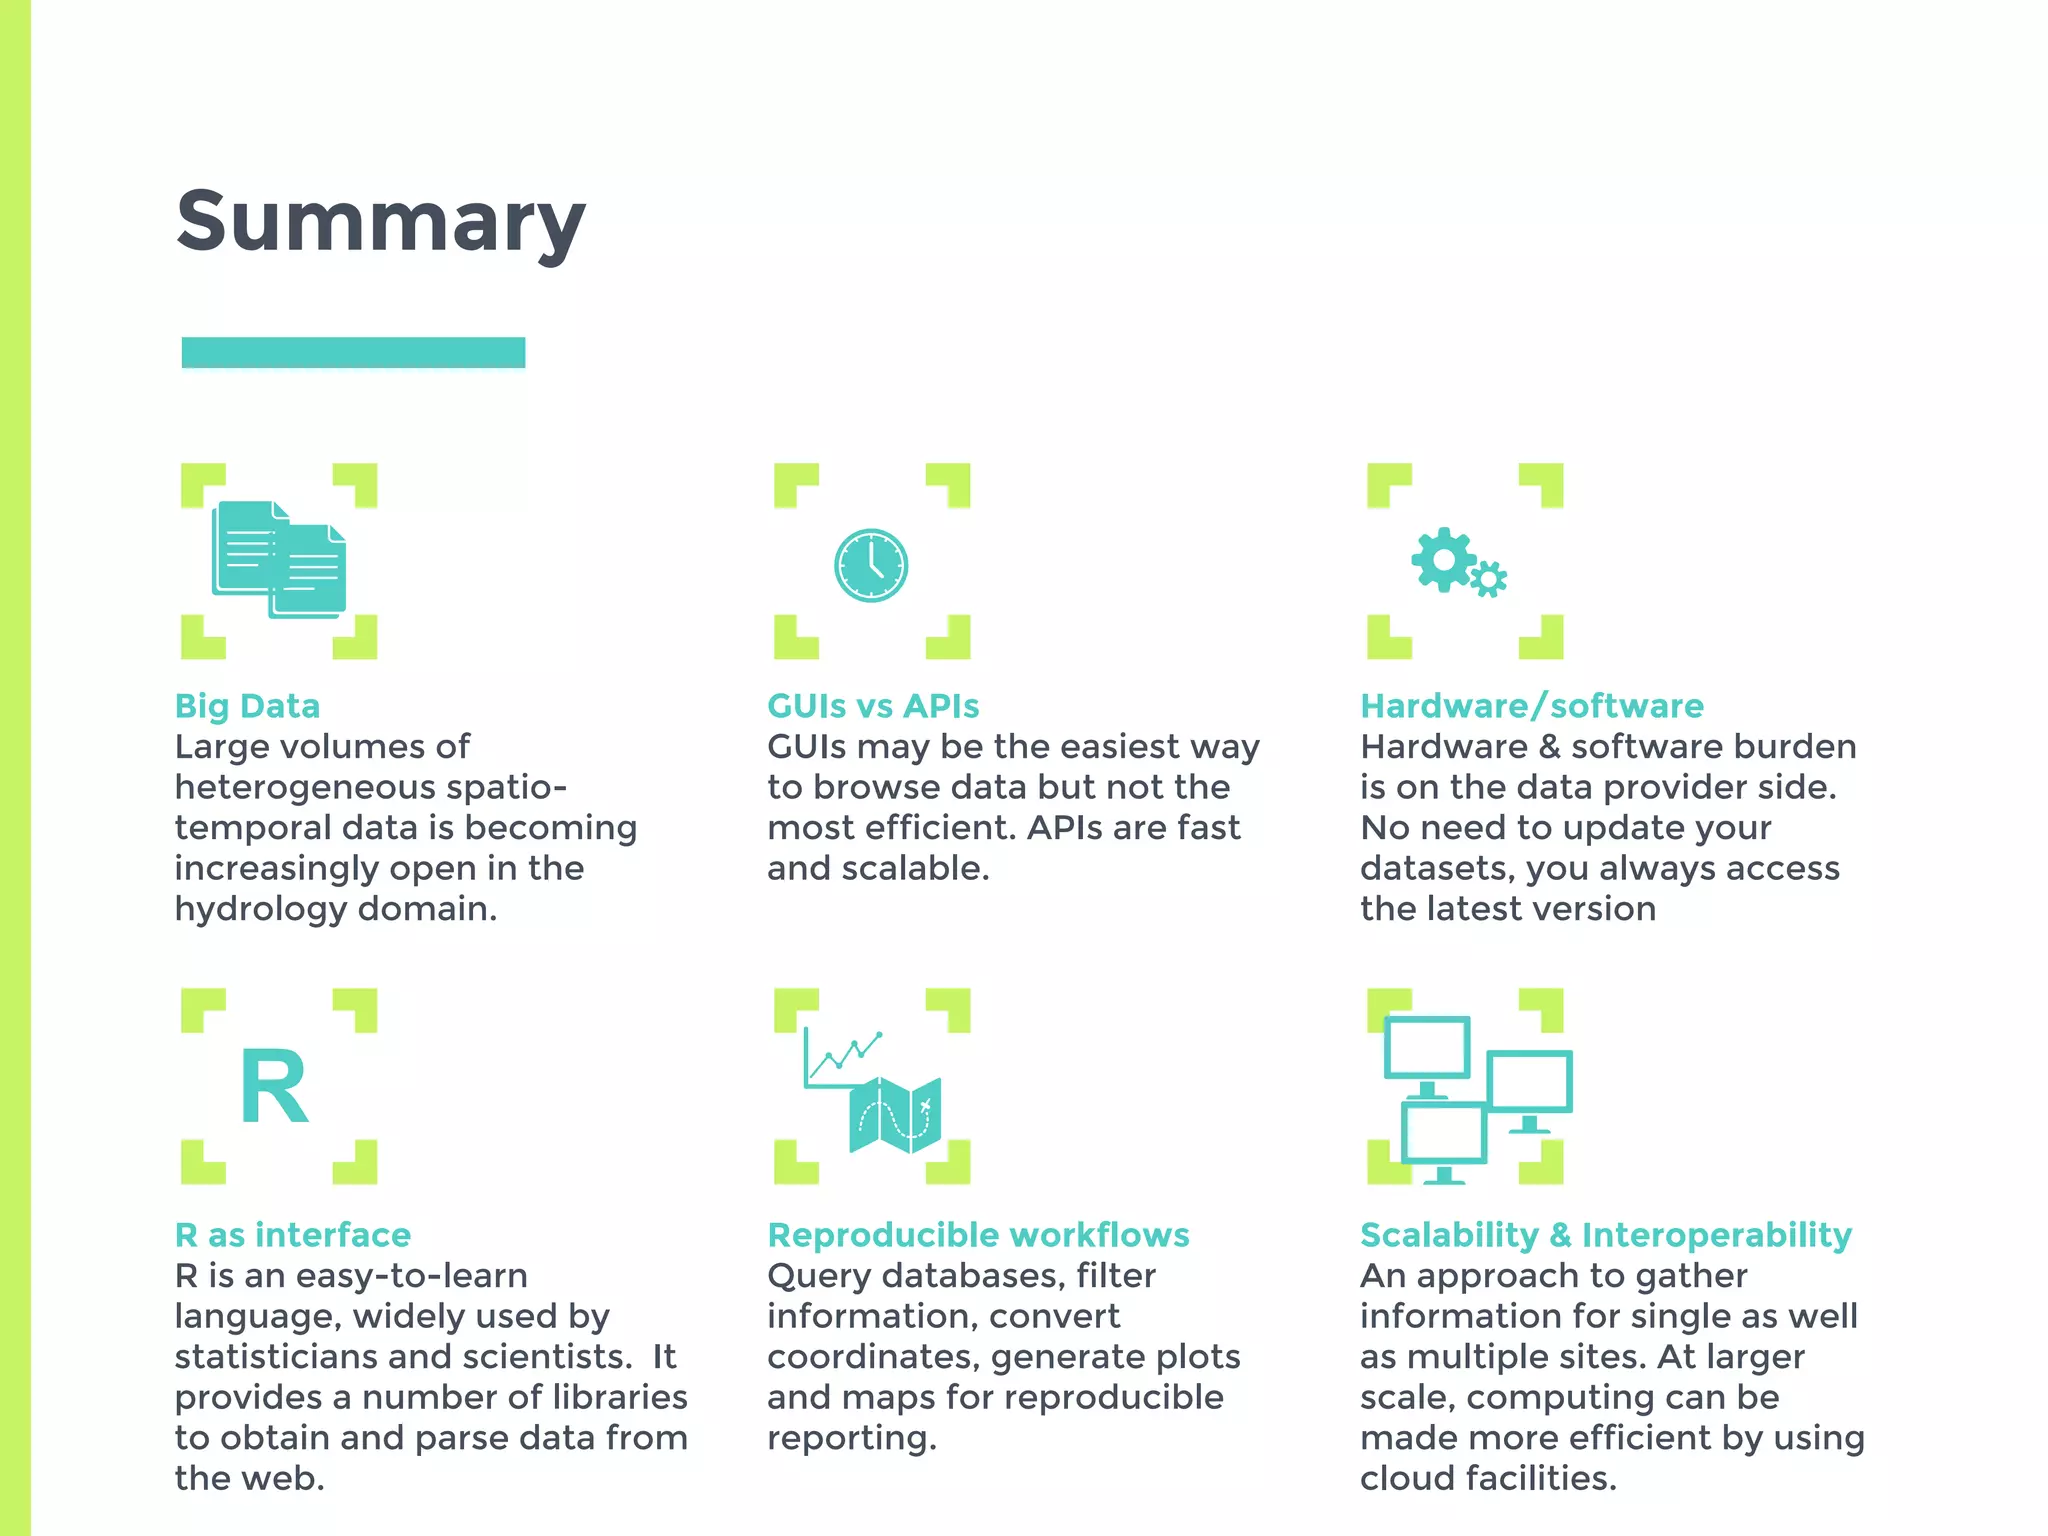
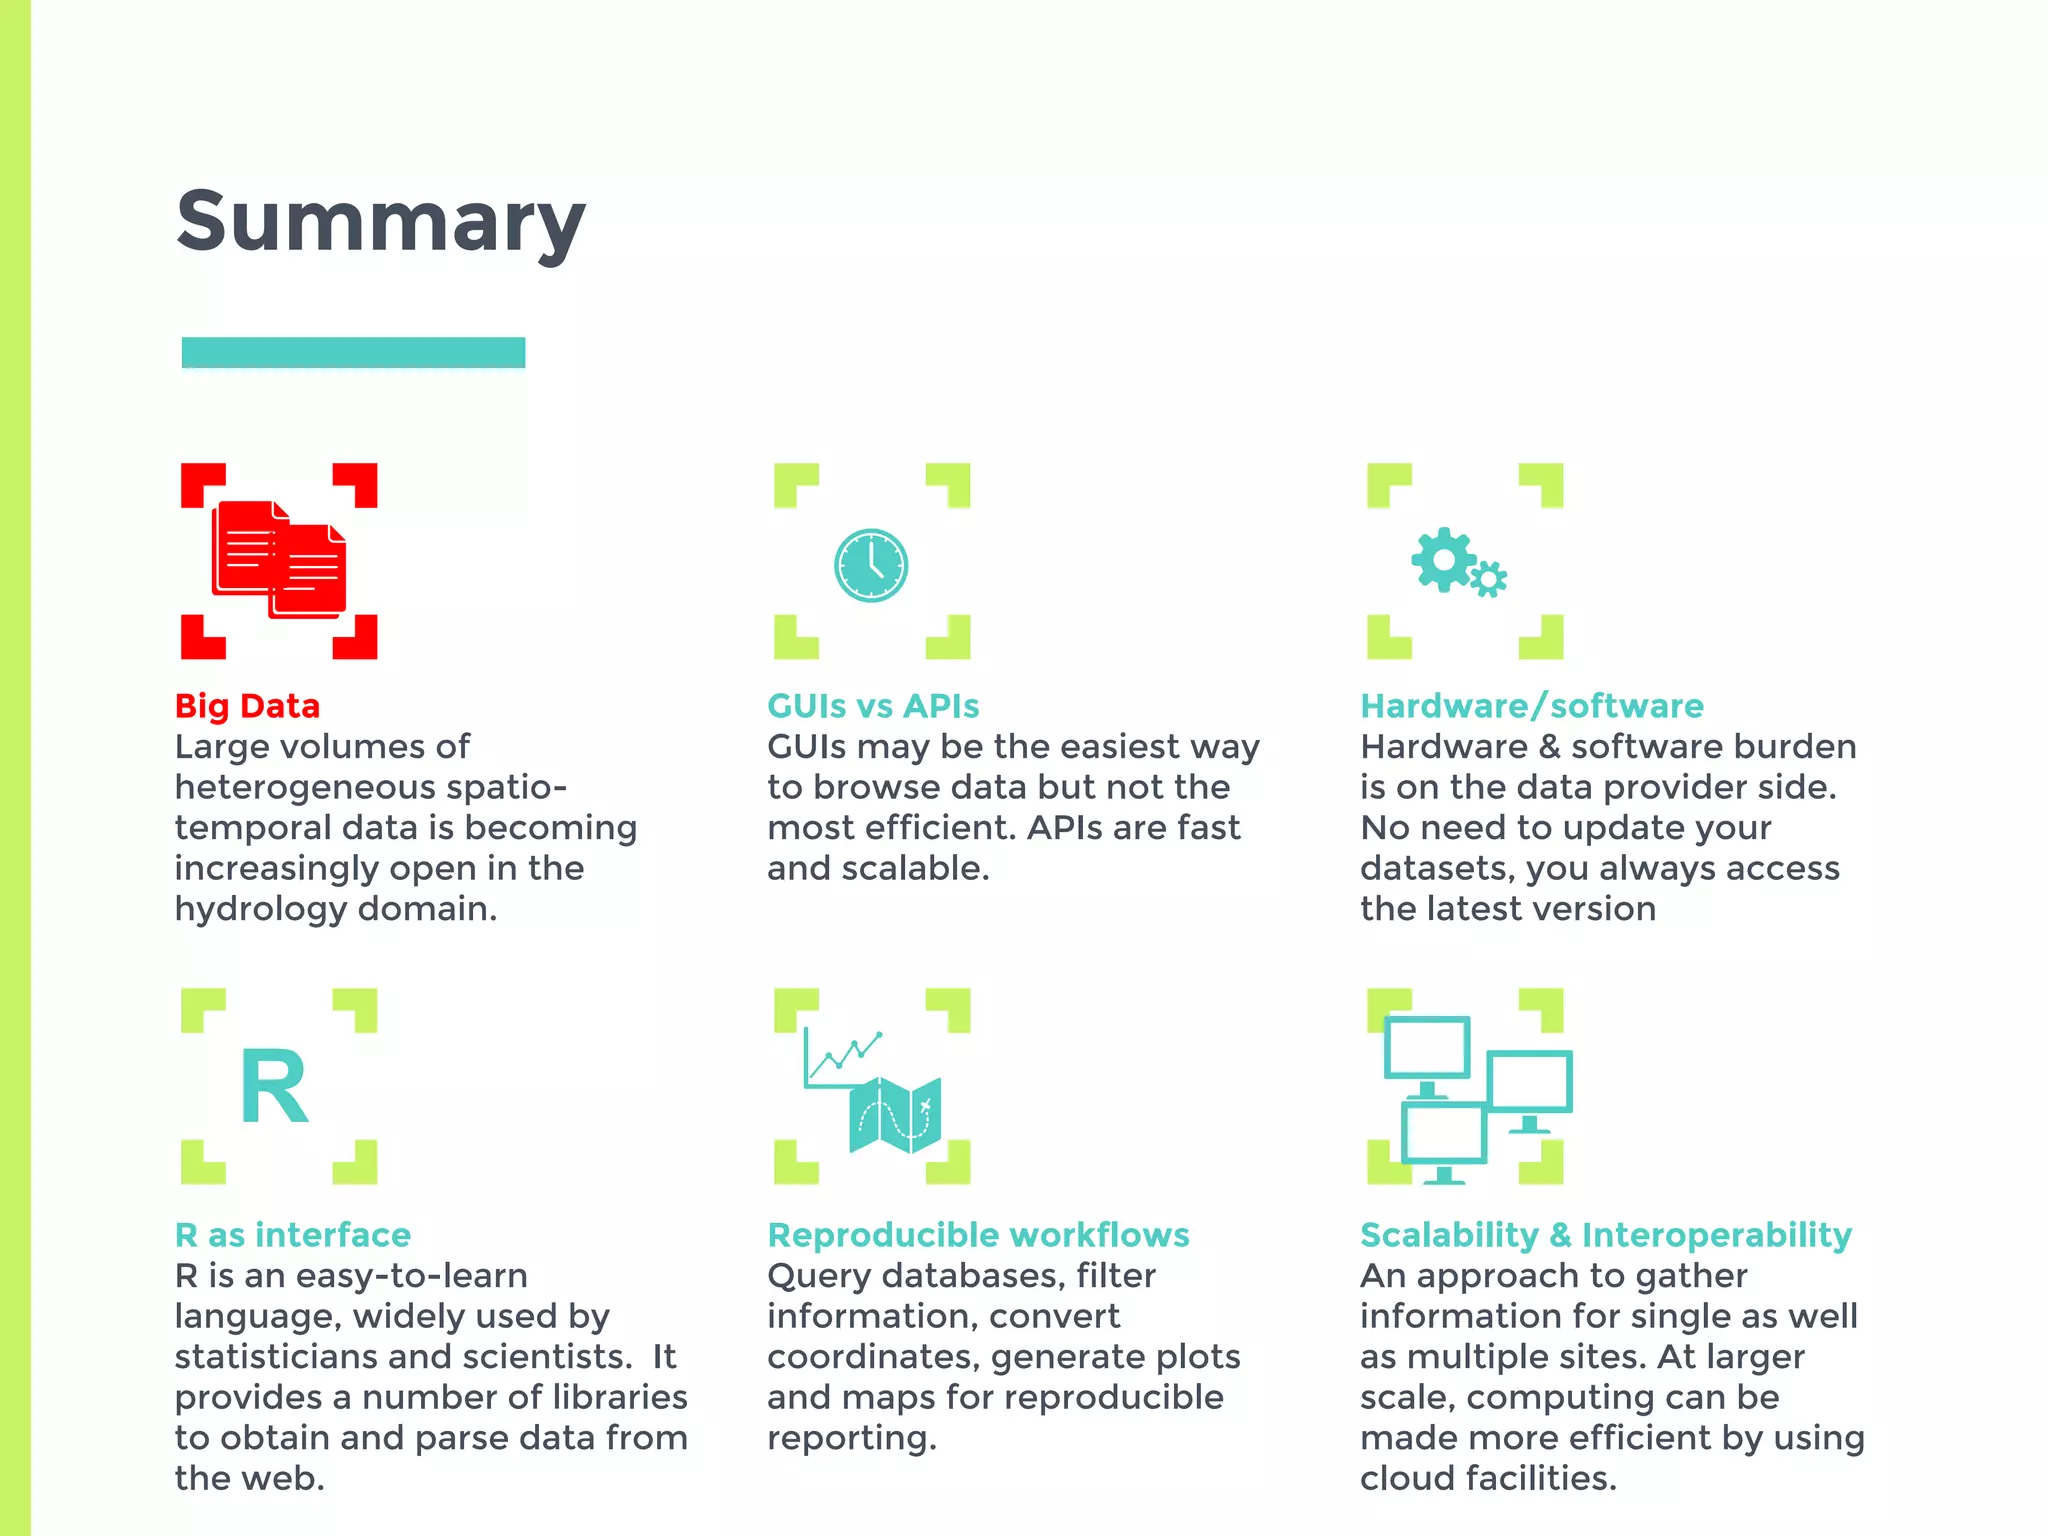
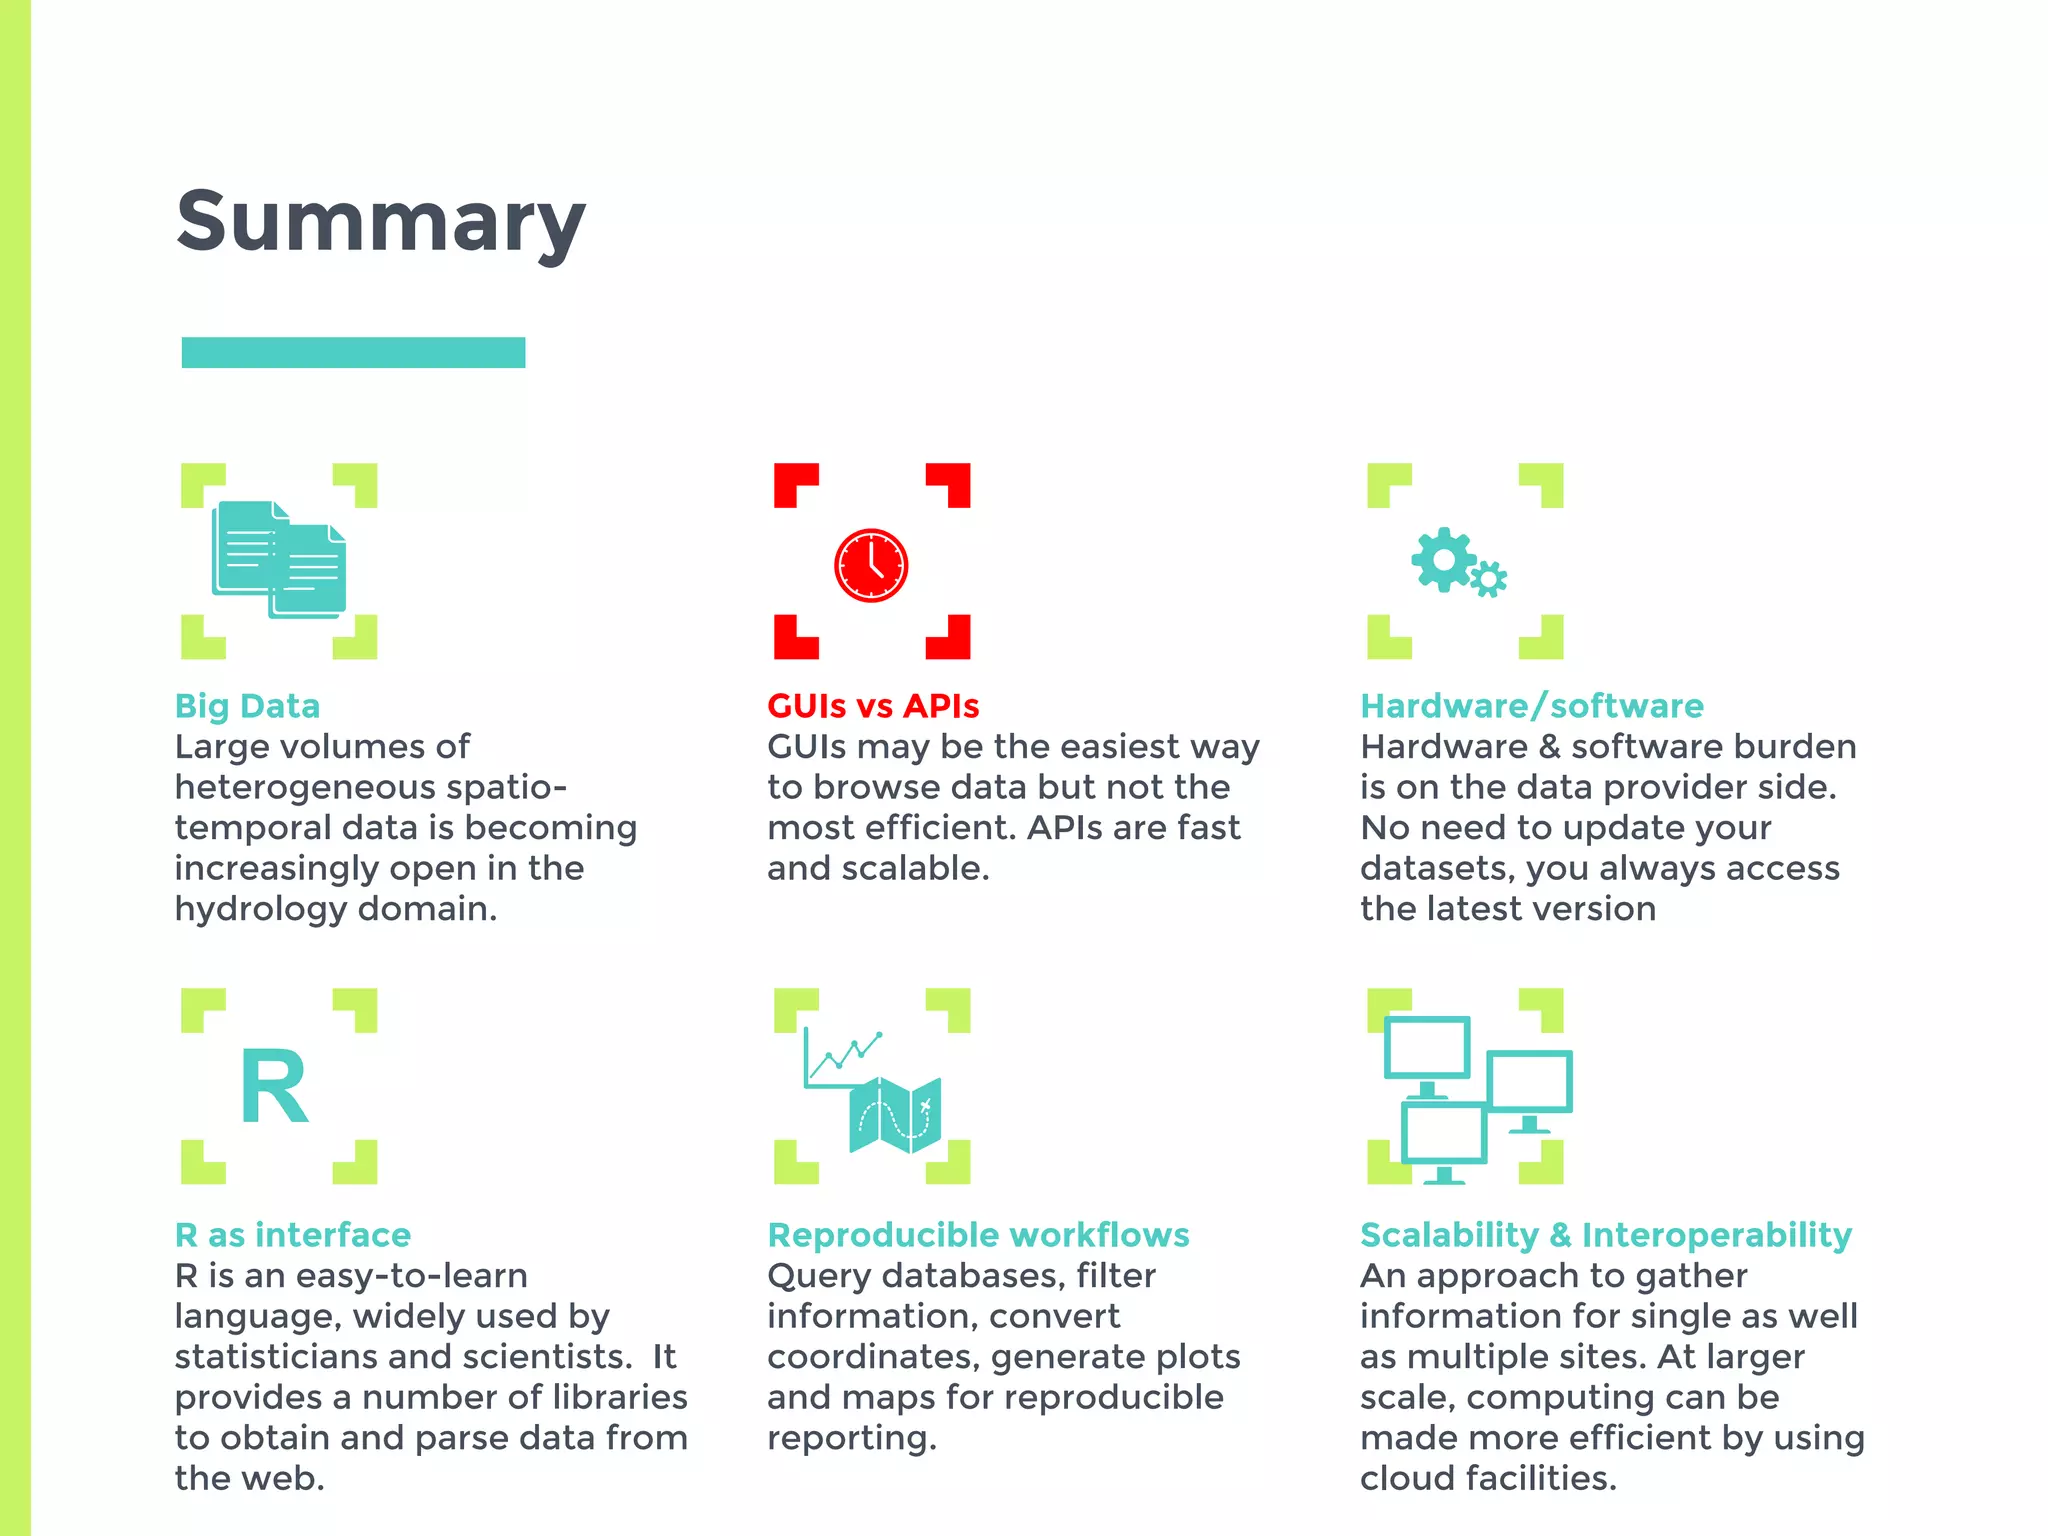
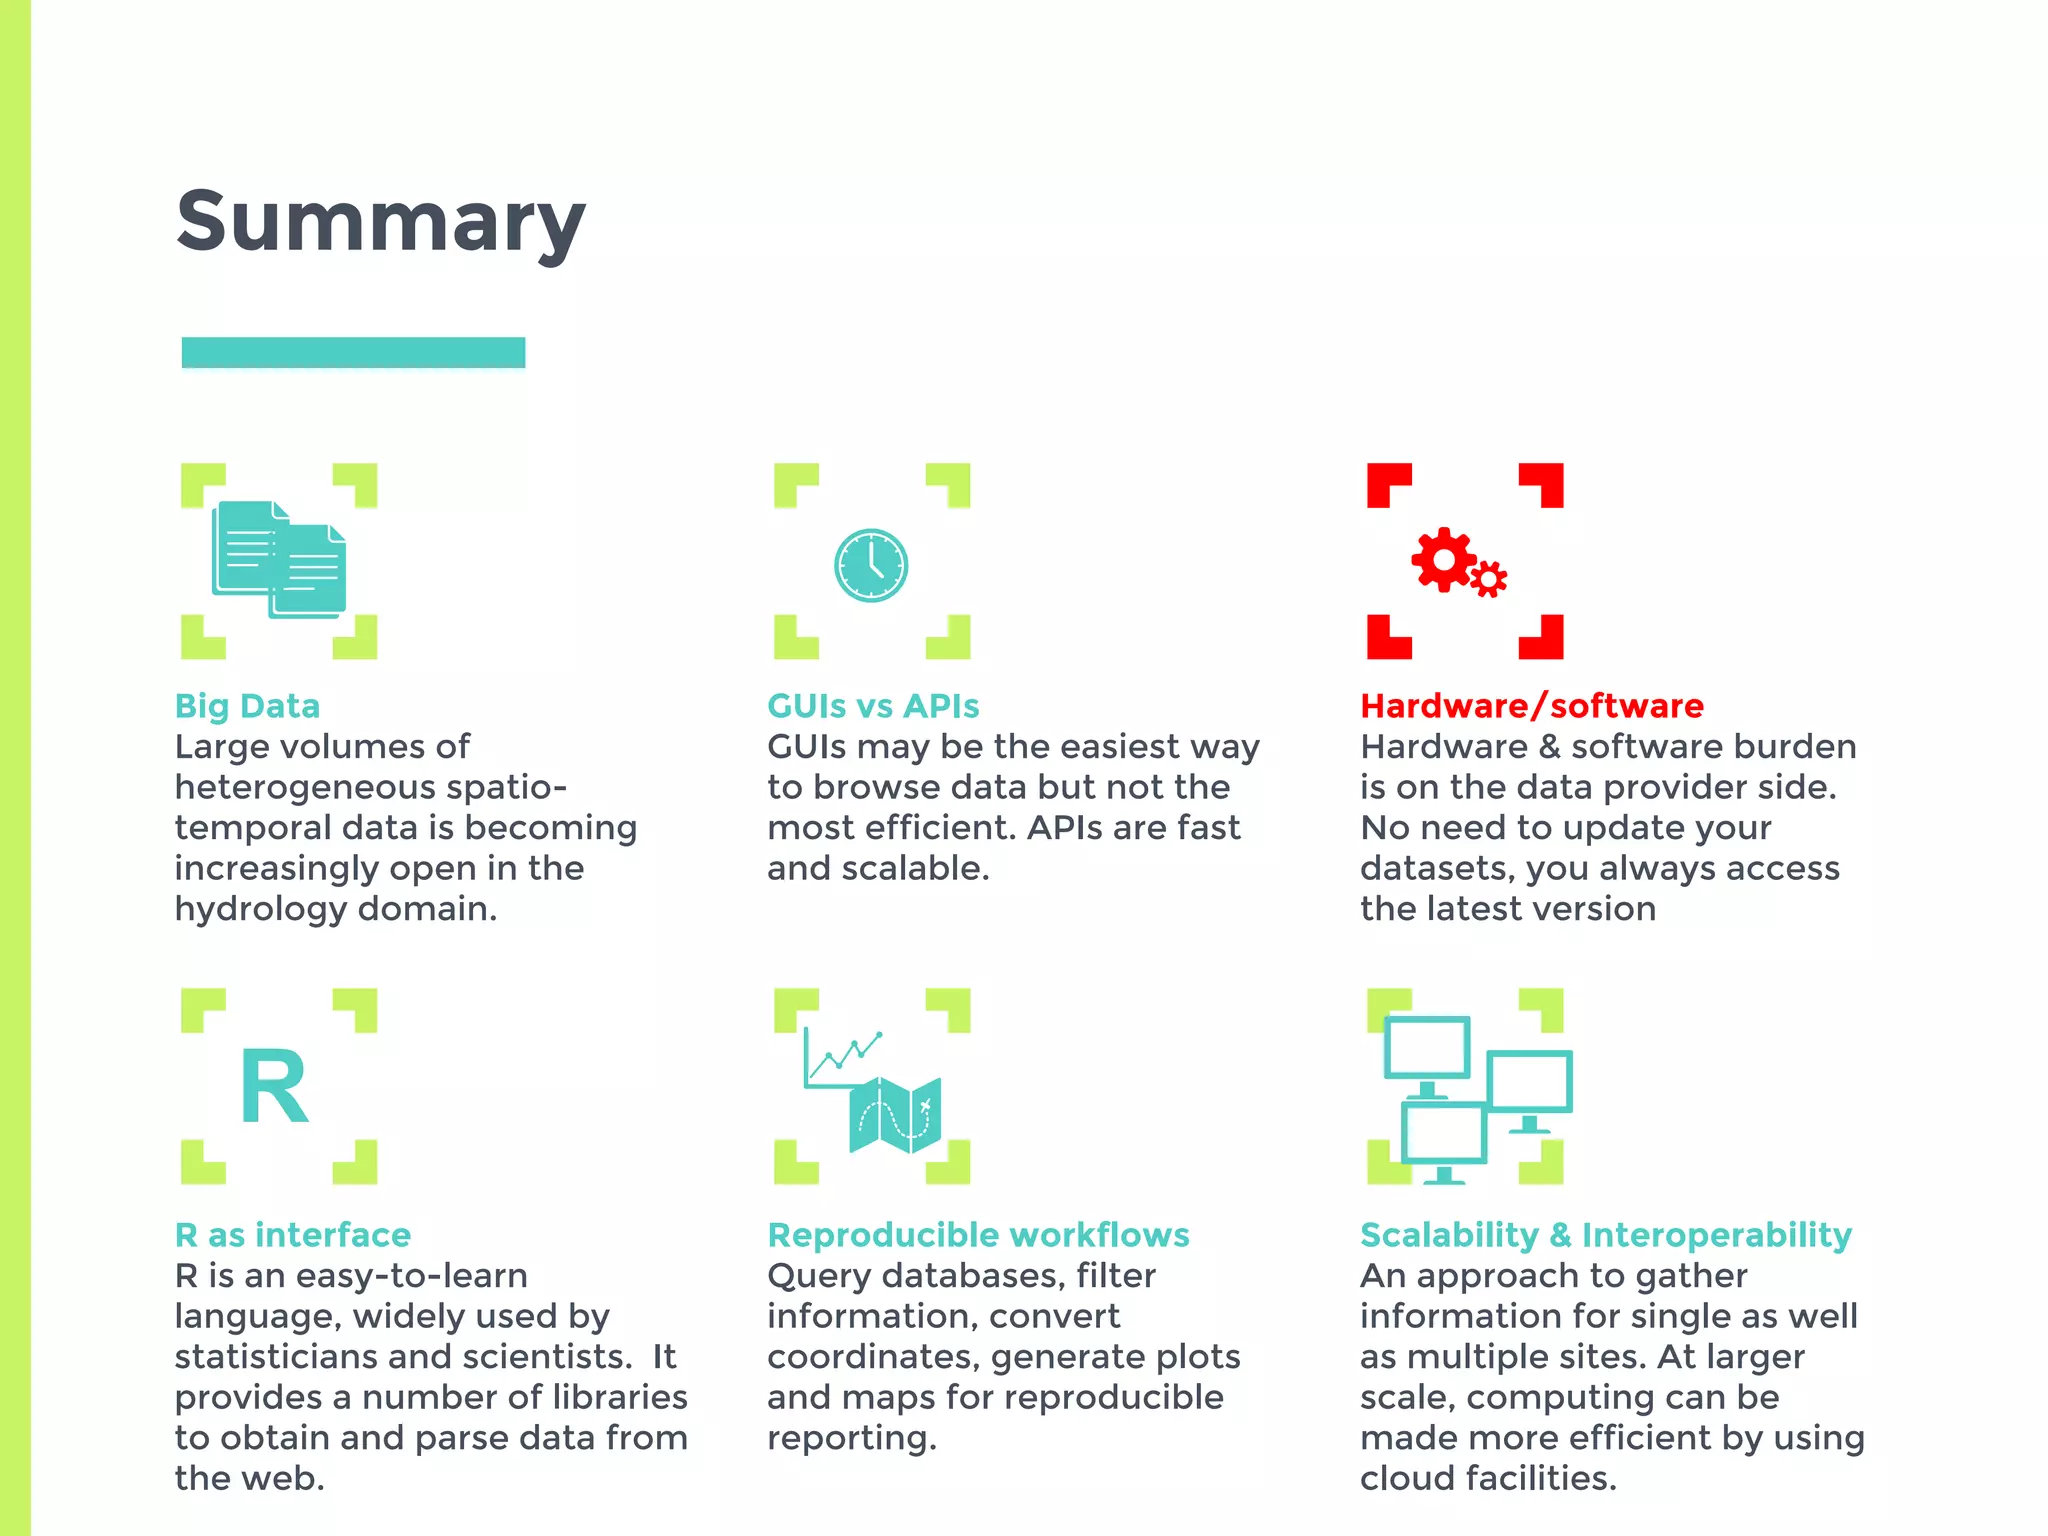
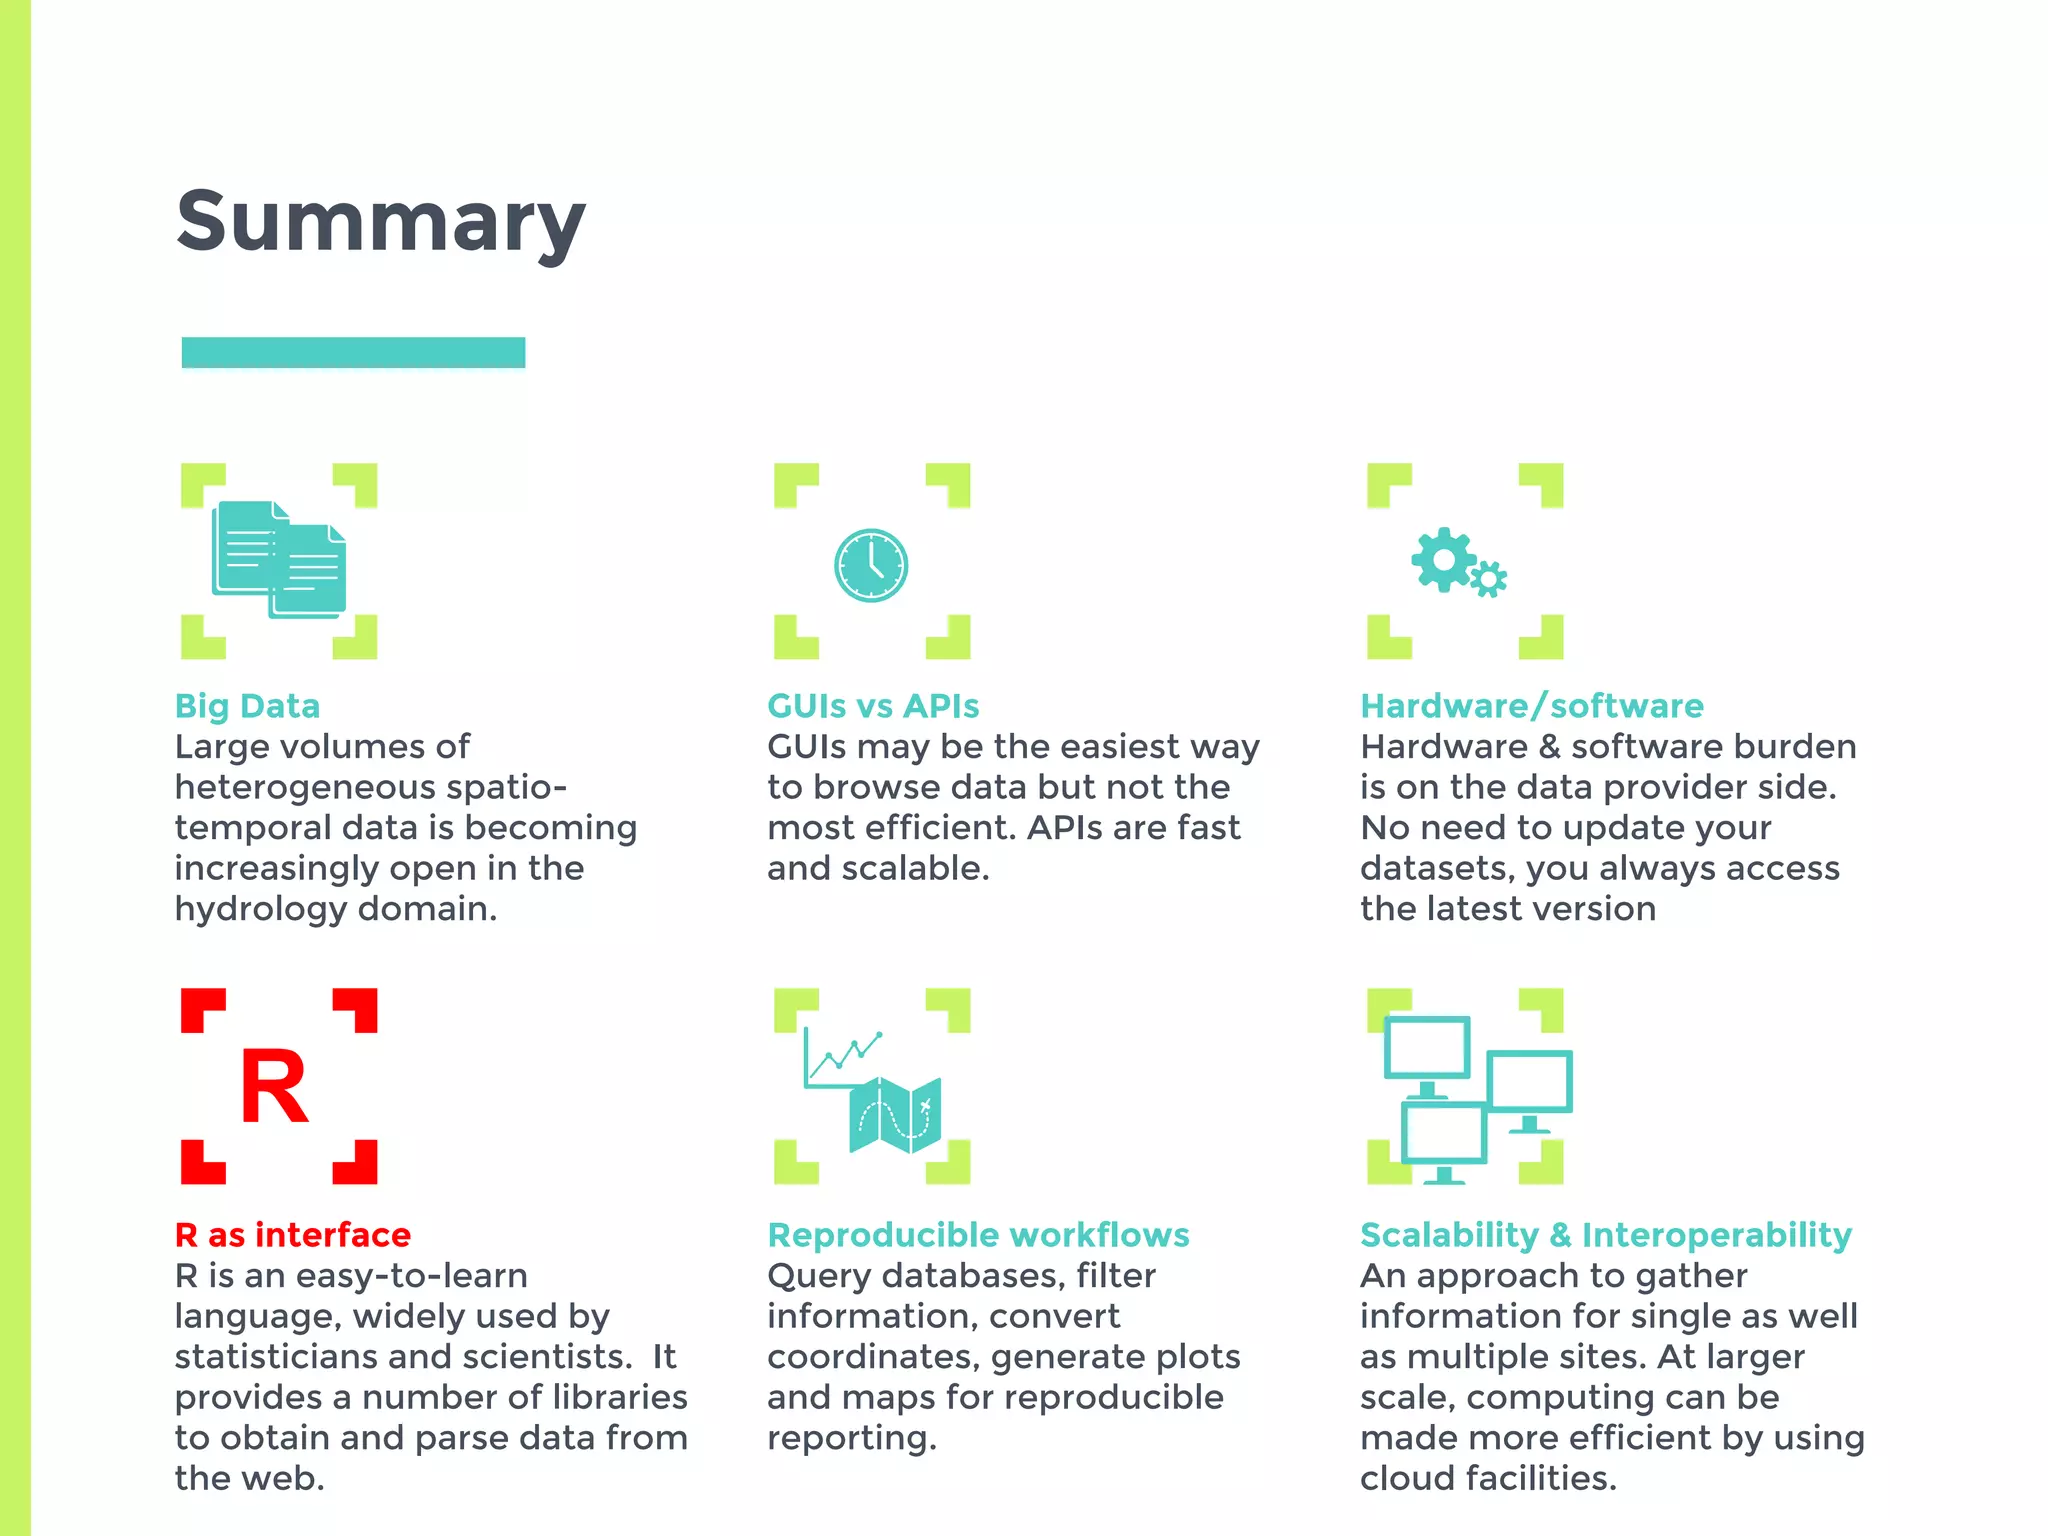
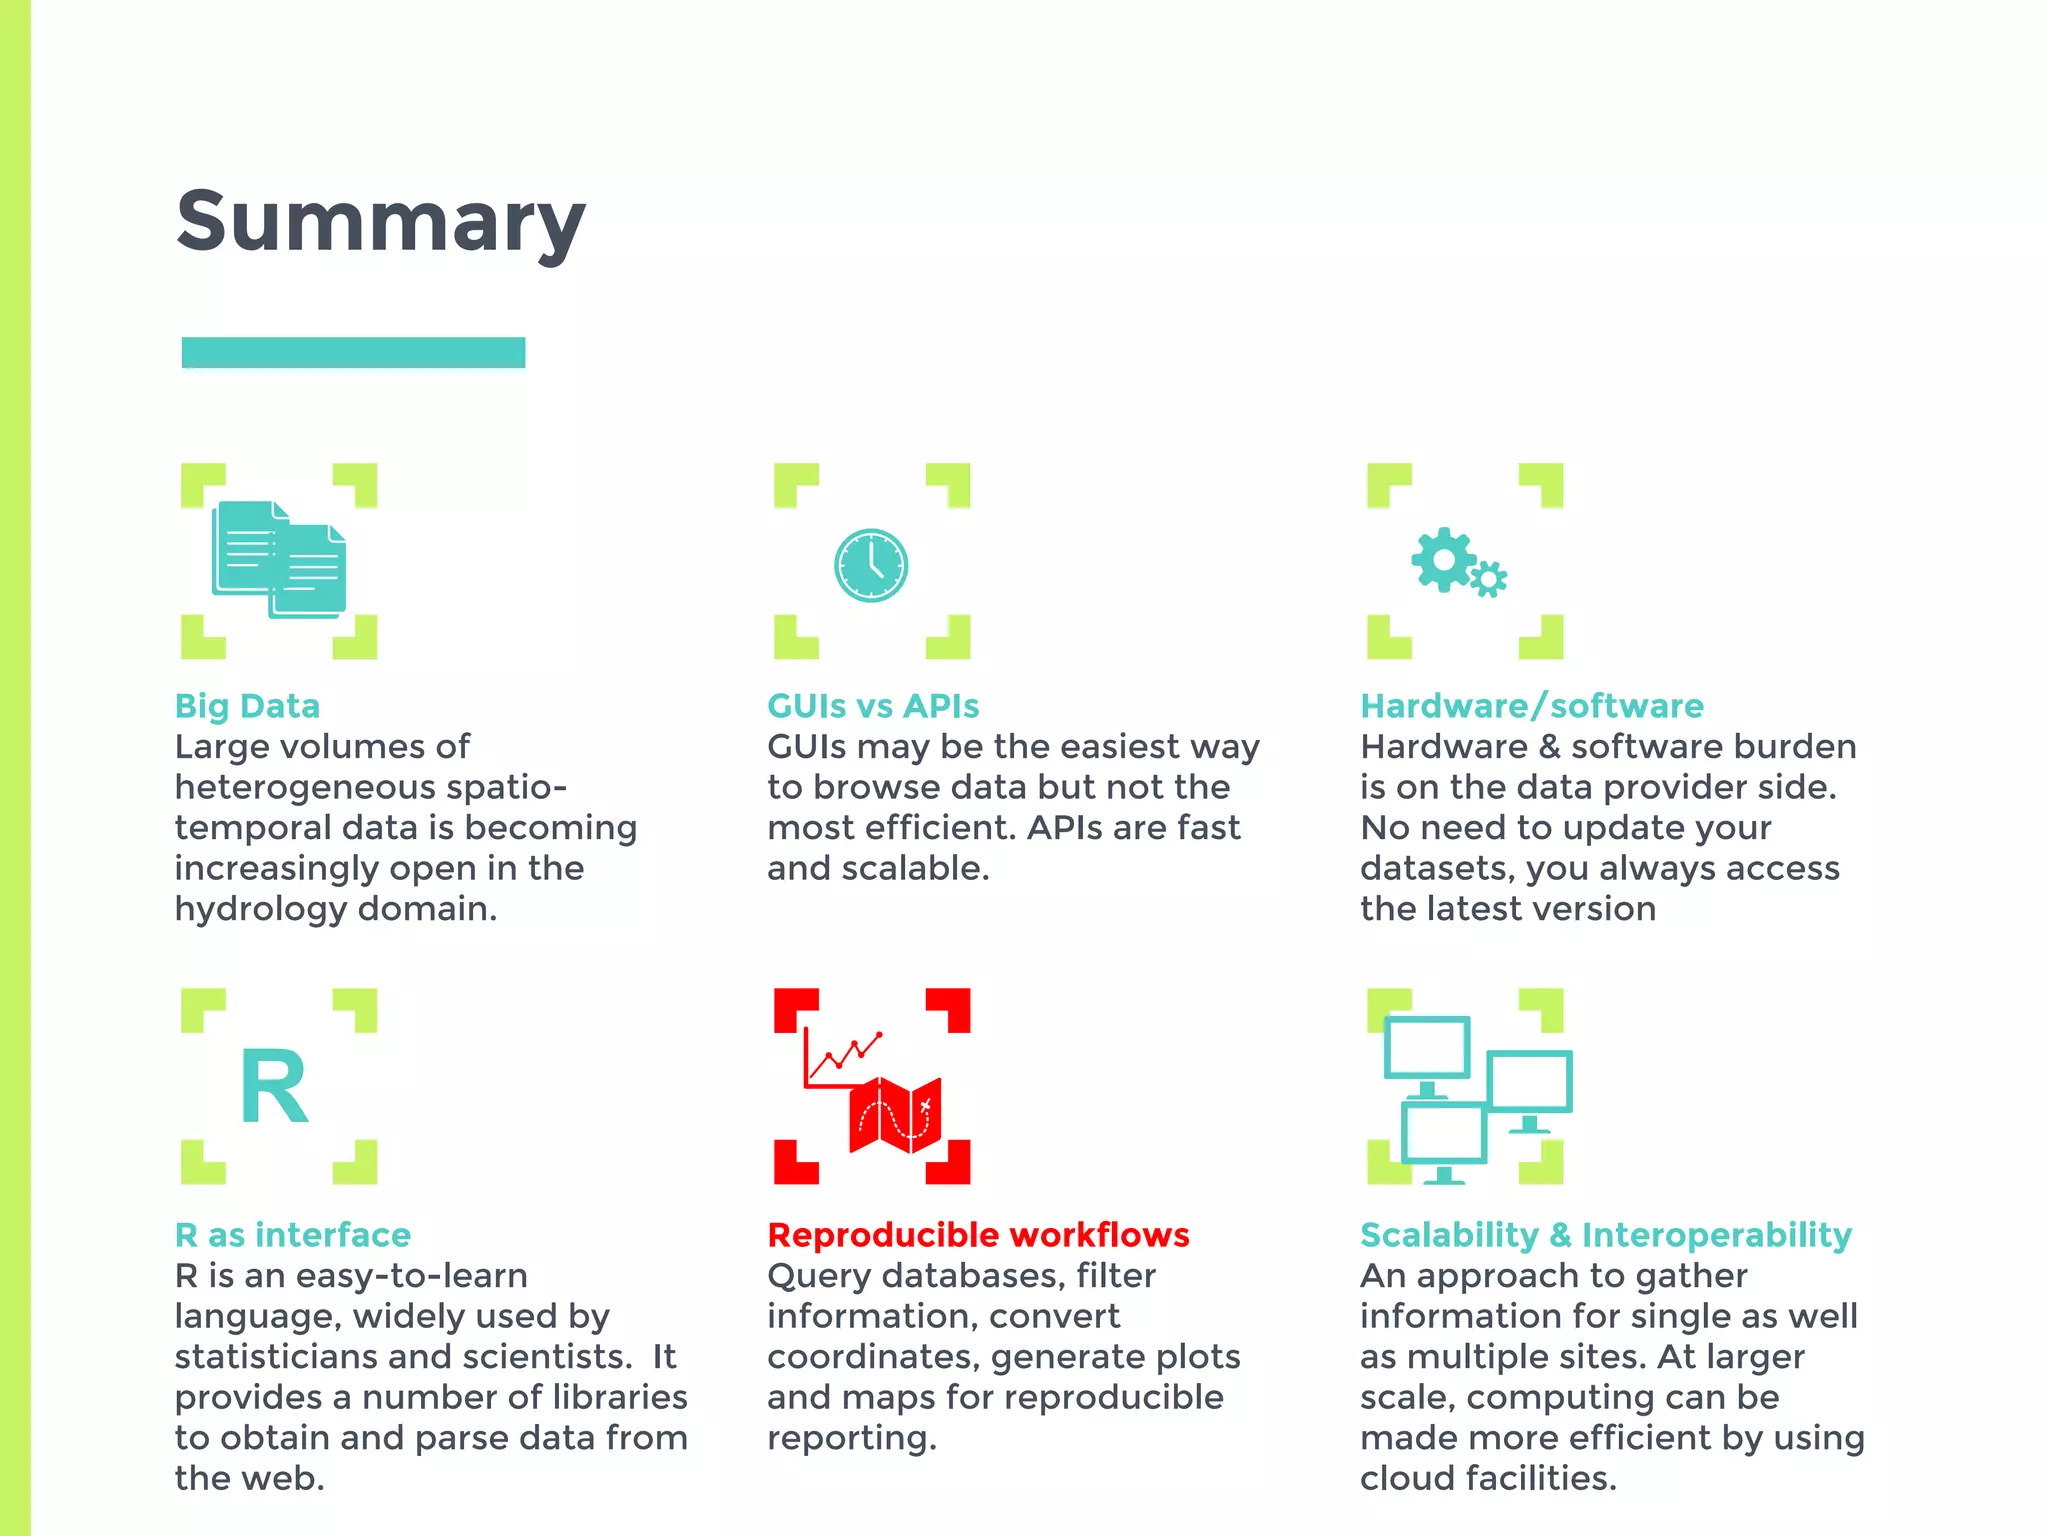
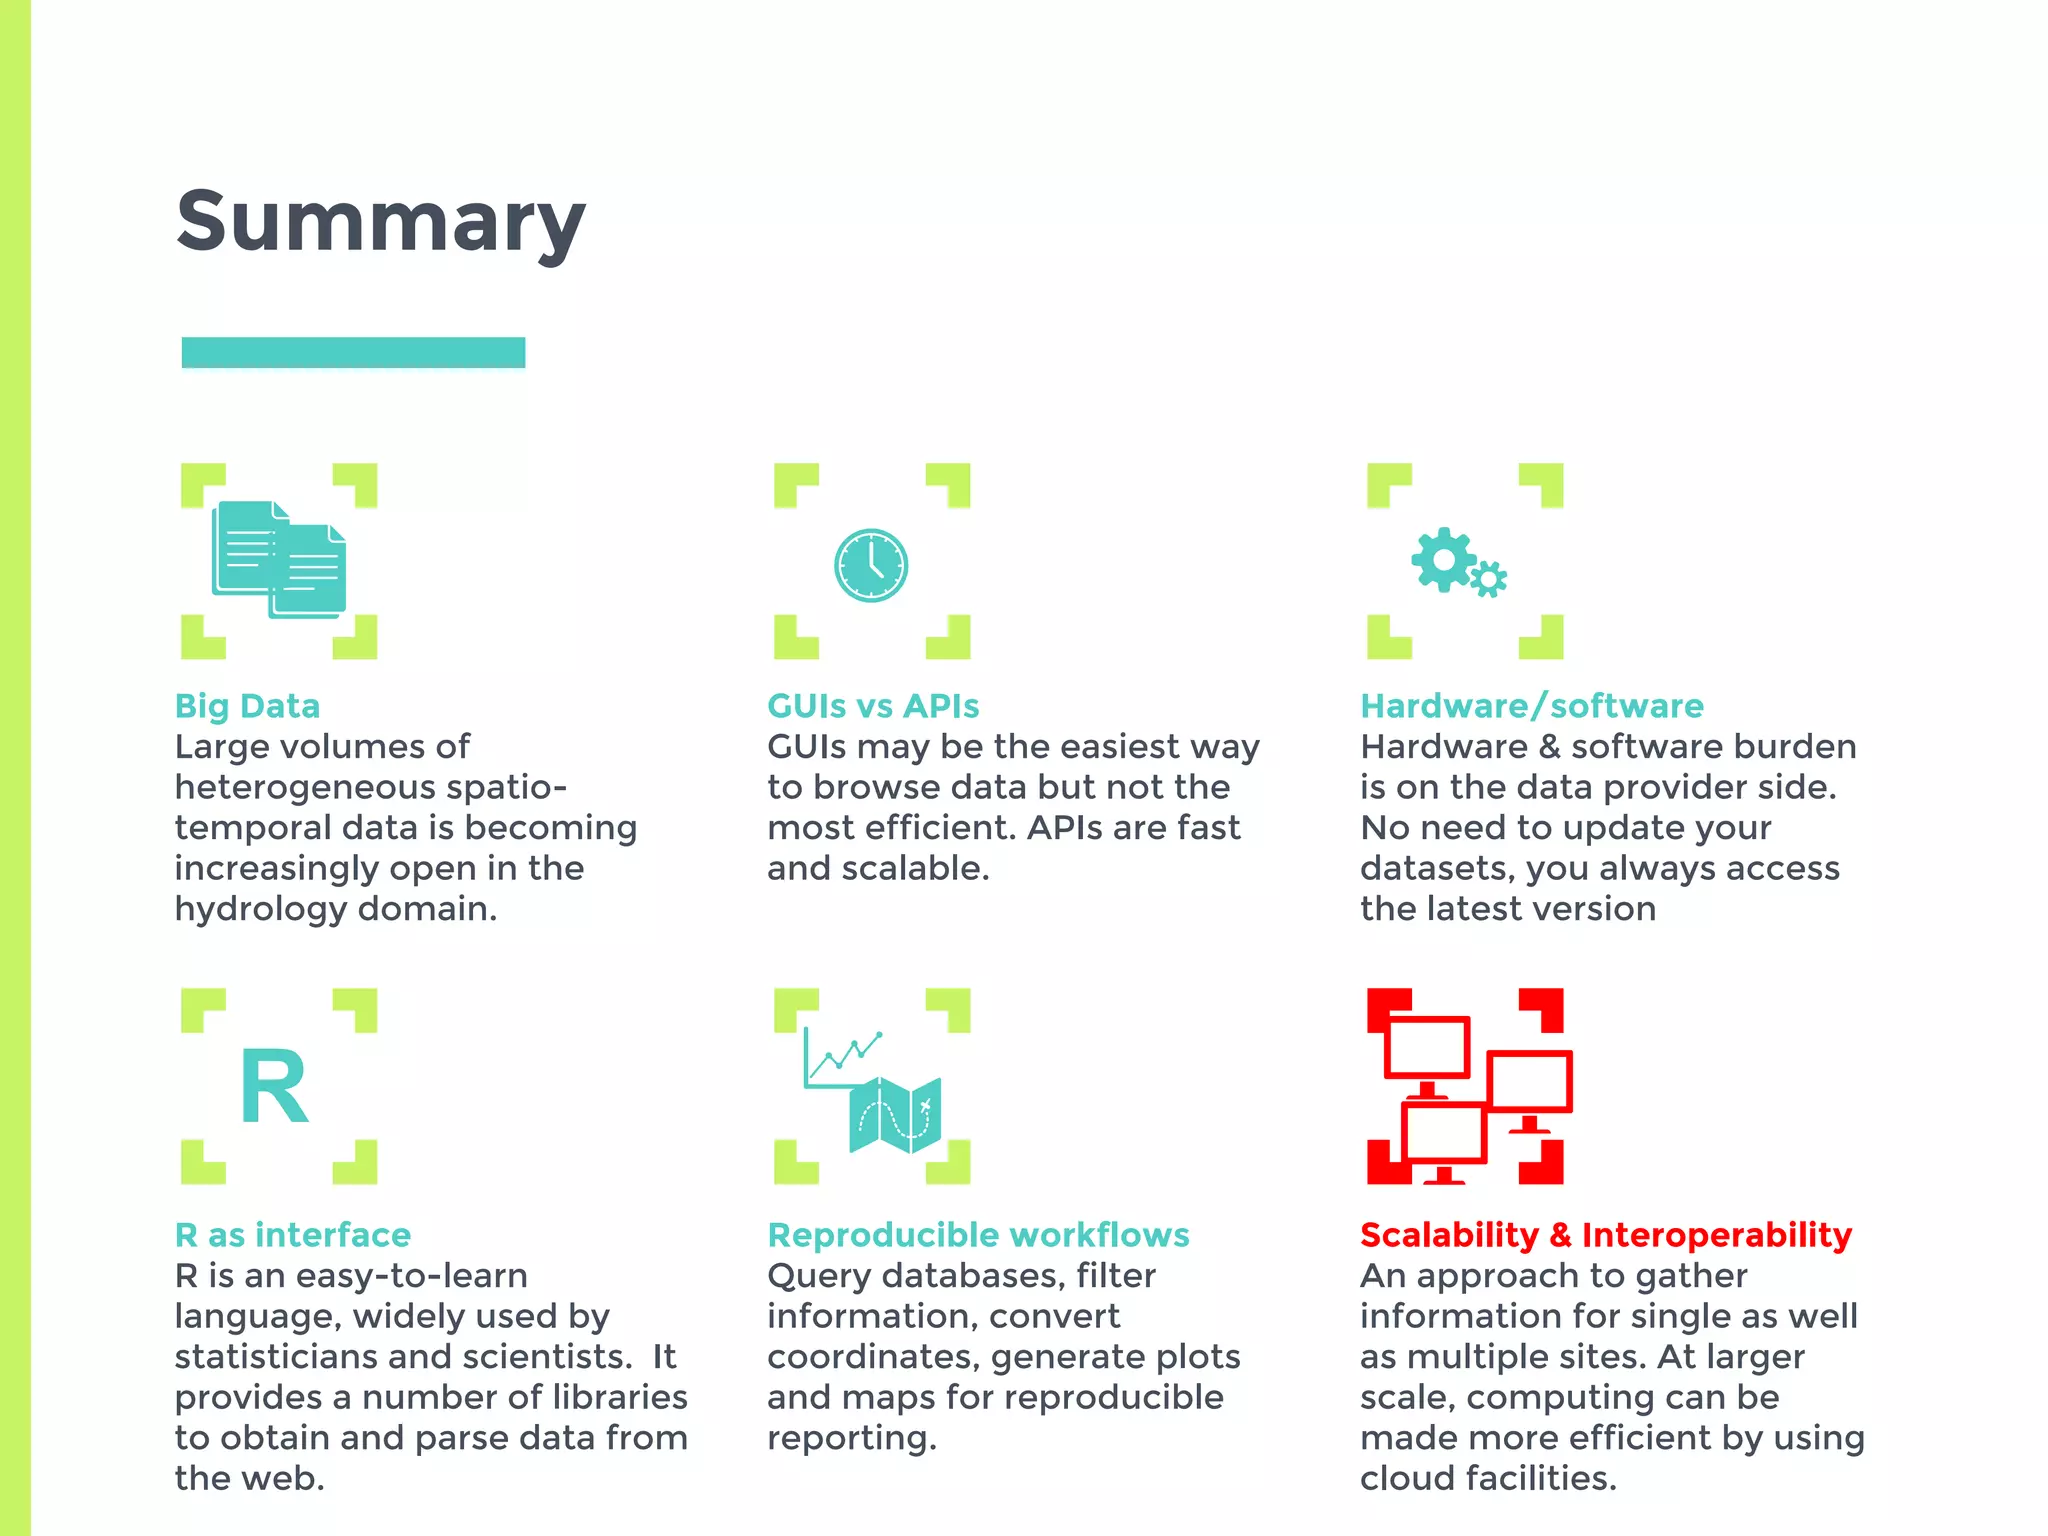


The document discusses improving access to geospatial big data in the hydrology domain, highlighting the importance of open data and data retrieval methods such as APIs versus graphical user interfaces (GUIs). It emphasizes that while GUIs are user-friendly, APIs offer better scalability and efficiency for handling large volumes of heterogeneous data. Additionally, the R programming language is presented as a practical tool for data retrieval and analysis in hydrology, promoting reproducible workflows and effective data management.


