This document describes the creation of a geodatabase to store spatial and attribute data related to polygonal ice-wedge networks in Svalbard, Norway. The geodatabase contains raster, vector, and numeric data from the field site. Feature classes were created to represent polygons, lines, points, and their attributes. Relationships and topology rules were defined. The geodatabase schema was exported to Microsoft Visio for visualization and to ArcCatalog to enable data editing and annotation.
1) The document analyzes the micro-relief and geometry of ice-wedge polygons in Adventdalen, Svalbard, Norway.
2) Two field campaigns were conducted to survey over 8,000 data points across 163 polygons using GPS. This data was used to generate a detailed digital terrain model.
3) Vertical distances along the major and minor axes of each polygon were calculated and analyzed. Results showed 85% of polygons had higher vertical distances along the major axis, suggesting polygon geometry is influenced by micro-relief slopes.
Dorr Space Variant Spatio Temporal Filtering Of Video For Gaze Visualization ...Kalle
We introduce an algorithm for space-variant filtering of video based on a spatio-temporal Laplacian pyramid and use this algorithm to render videos in order to visualize prerecorded eye movements. Spatio-temporal contrast and colour saturation are reduced as a function of distance to the nearest gaze point of regard, i.e. nonfixated, distracting regions are filtered out, whereas fixated image regions remain unchanged. Results of an experiment in which the eye movements of an expert on instructional videos are visualized with this algorithm, so that the gaze of novices is guided to relevant
image locations, show that this visualization technique facilitates the novices’ perceptual learning.
Implementing kohonen's som with missing data in OTBmelaneum
The document discusses implementing Kohonen's self-organizing map (SOM) algorithm to handle missing and erroneous data in time series. It describes the SOM properties and training process. It also provides an example of a MODIS time series over Brittany, France with missing, erroneous, and clean data points to which the modifications would be applied. Finally, it discusses the benefits of implementing the SOM in a generic programming approach.
The document discusses using binary partition trees (BPT) as a structured region-based representation for hyperspectral imagery. It introduces hyperspectral imagery and BPTs. It then discusses constructing a BPT for hyperspectral images by merging regions based on a criterion, and using pruning strategies on the BPT for tasks like object detection. The aim is to leverage BPTs for hyperspectral image analysis through construction of the BPT and subsequent pruning.
The document summarizes the M-tree, a new access method for organizing and searching large datasets in metric spaces. The M-tree is a balanced tree that partitions objects based on their relative distances as measured by a distance function, with objects stored in fixed-size nodes. It can index objects using arbitrary distance functions as long as they satisfy the metric properties. The M-tree aims to reduce both the number of accessed nodes and distance computations needed for similarity queries, improving performance for CPU-intensive distance functions. Algorithms for range and k-nearest neighbor queries are described that leverage distance information stored in the M-tree to prune search spaces.
Halle M. Yaeger is a landscape architectural designer with a Bachelor of Landscape Architecture and a minor in City & Regional Planning. The document provides summaries of 14 projects she has worked on ranging from park designs, corridor studies, food hub plans, and sustainable farming proposals. The projects showcase her skills in site analysis, concept development, design documentation, and communication through plans, sections, renderings, diagrams and models.
4D AUTOMATIC LIP-READING FOR SPEAKER'S FACE IDENTIFCATION sipij
A novel based a trajectory-guided, concatenating approach for synthesizing high-quality image real sample renders video is proposed. The lips reading automated is seeking for modeled the closest real image sample sequence preserve in the library under the data video to the HMM predicted trajectory. The object trajectory is modeled obtained by projecting the face patterns into an KDA feature space is estimated. The approach for speaker's face identification by using synthesise the identity surface of a subject face from a small sample of patterns which sparsely each the view sphere. An KDA algorithm use to the Lip-reading image is discrimination, after that work consisted of in the low dimensional for the fundamental lip features vector is reduced by using the 2D-DCT. The mouth of the set area dimensionality is ordered by a normally reduction base on the PCA to obtain the Eigenlips approach, their proposed approach by[33]. The subjective performance results of the cost function under the automatic lips
reading modeled , which wasn’t illustrate the superior performance of the method.
1) The document analyzes the micro-relief and geometry of ice-wedge polygons in Adventdalen, Svalbard, Norway.
2) Two field campaigns were conducted to survey over 8,000 data points across 163 polygons using GPS. This data was used to generate a detailed digital terrain model.
3) Vertical distances along the major and minor axes of each polygon were calculated and analyzed. Results showed 85% of polygons had higher vertical distances along the major axis, suggesting polygon geometry is influenced by micro-relief slopes.
Dorr Space Variant Spatio Temporal Filtering Of Video For Gaze Visualization ...Kalle
We introduce an algorithm for space-variant filtering of video based on a spatio-temporal Laplacian pyramid and use this algorithm to render videos in order to visualize prerecorded eye movements. Spatio-temporal contrast and colour saturation are reduced as a function of distance to the nearest gaze point of regard, i.e. nonfixated, distracting regions are filtered out, whereas fixated image regions remain unchanged. Results of an experiment in which the eye movements of an expert on instructional videos are visualized with this algorithm, so that the gaze of novices is guided to relevant
image locations, show that this visualization technique facilitates the novices’ perceptual learning.
Implementing kohonen's som with missing data in OTBmelaneum
The document discusses implementing Kohonen's self-organizing map (SOM) algorithm to handle missing and erroneous data in time series. It describes the SOM properties and training process. It also provides an example of a MODIS time series over Brittany, France with missing, erroneous, and clean data points to which the modifications would be applied. Finally, it discusses the benefits of implementing the SOM in a generic programming approach.
The document discusses using binary partition trees (BPT) as a structured region-based representation for hyperspectral imagery. It introduces hyperspectral imagery and BPTs. It then discusses constructing a BPT for hyperspectral images by merging regions based on a criterion, and using pruning strategies on the BPT for tasks like object detection. The aim is to leverage BPTs for hyperspectral image analysis through construction of the BPT and subsequent pruning.
The document summarizes the M-tree, a new access method for organizing and searching large datasets in metric spaces. The M-tree is a balanced tree that partitions objects based on their relative distances as measured by a distance function, with objects stored in fixed-size nodes. It can index objects using arbitrary distance functions as long as they satisfy the metric properties. The M-tree aims to reduce both the number of accessed nodes and distance computations needed for similarity queries, improving performance for CPU-intensive distance functions. Algorithms for range and k-nearest neighbor queries are described that leverage distance information stored in the M-tree to prune search spaces.
Halle M. Yaeger is a landscape architectural designer with a Bachelor of Landscape Architecture and a minor in City & Regional Planning. The document provides summaries of 14 projects she has worked on ranging from park designs, corridor studies, food hub plans, and sustainable farming proposals. The projects showcase her skills in site analysis, concept development, design documentation, and communication through plans, sections, renderings, diagrams and models.
4D AUTOMATIC LIP-READING FOR SPEAKER'S FACE IDENTIFCATION sipij
A novel based a trajectory-guided, concatenating approach for synthesizing high-quality image real sample renders video is proposed. The lips reading automated is seeking for modeled the closest real image sample sequence preserve in the library under the data video to the HMM predicted trajectory. The object trajectory is modeled obtained by projecting the face patterns into an KDA feature space is estimated. The approach for speaker's face identification by using synthesise the identity surface of a subject face from a small sample of patterns which sparsely each the view sphere. An KDA algorithm use to the Lip-reading image is discrimination, after that work consisted of in the low dimensional for the fundamental lip features vector is reduced by using the 2D-DCT. The mouth of the set area dimensionality is ordered by a normally reduction base on the PCA to obtain the Eigenlips approach, their proposed approach by[33]. The subjective performance results of the cost function under the automatic lips
reading modeled , which wasn’t illustrate the superior performance of the method.
The document analyzes geometric and topological characteristics of polygonal networks formed by freezing and thawing of soils in Adventdalen, Svalbard, Norway. Over 10,000 polygons across 120 networks were mapped from aerial imagery. 17 networks were analyzed in detail. Larger networks had smaller average polygon sizes while some networks with larger polygons showed signs of subdivision into smaller polygons over time. Networks with higher percentages of intersections with 4 sides (tetravalent vertices) and smaller, more uniform polygon sizes showed progression toward an equilibrium cracking pattern.
The document discusses metadata and geospatial data management. It describes the purpose of metadata including protecting investments in data creation and ensuring data integrity. It also outlines challenges in sharing geospatial data and standards for metadata including ISO and INSPIRE. Tools are presented for creating UK and INSPIRE compliant metadata including Geodoc, an online metadata editor, and publishing metadata through the GoGeo portal.
REMOTE SENSING AND GEOGRAPHIC INFORMATION SYSTEMS AM Publications
Remote sensing technology's increasing accessibility helps us observe research and learn about our globe in ways we could only imagine a generation ago. Guides to profound knowledge of historical, conceptual and practical uses of remote sensing which is increasing GIS technology. This paper will go briefly through remote sensing benefits, history, technology and the GIS and remote sensing integration and their applications. Remote sensing (RS) is used in mapping the predicted and actual species and dominates the ecosystem canopy.
Playful Explorations of Public and Personal Data - OSCON Data 2011Andrew Turner
It’s easy to find and create data. But what are you going to do with it? Can I ask the world complex questions such as what’s the local crime rate, distance to metro, or rating of my local school? Can you combine these all together to rate houses you may want to buy? And how do you then connect back to your government and local businesses to engage in collaborative decision making.
This talk with discuss how you should consider users and their personal interactions with data and information. We’ll also peel back the covers on how open source tools such as HBase, Cascading, Geos and Polymaps handle analyzing and streaming realtime data to maps and visualizations both on the web and to mobile devices.
To illustrate what’s possible, we’ll dive through GeoCommons, a large online community of data sharing and community analytics that uses open source mapping visualization, Hadoop analysis, and mobile interfaces to provide this to the world. Users can even build and socialize their own analysis methods to share their expert knowledge with other users. We’ll also review how global organizations like the World Bank and United Nations are using these tools to connect with citizens in developing countries to empower them to make decisions on building investment and understanding how climate science may affect their areas.
Mathieu Cain's skills portfolio summarizes his expertise in geographic information systems and geospatial analysis. It includes sections on database design, data collection using GPS, remote sensing of satellite imagery, image processing and classification techniques, and spatial analysis methods such as distance analysis, site suitability analysis, and spatial-temporal analysis. The portfolio provides examples applying these GIS skills to issues such as evaluating potential airport sites, assessing wildfire risk, and modeling disease spread.
1. M.SC and PG.Diploma on Remote Sensing and Geographical information system.
2. Experience on Remote Sensing and GIS of 3 Years 11 Months.
3. 1 Year Diploma on Information Technology.
4.Certificate course On Remote Sensing & Gis From ISRO.
IRJET-Mapping of Mineral Zones using the Spectral Feature Fitting Method in J...IRJET Journal
This document summarizes a study that used the Spectral Feature Fitting (SFF) algorithm to map mineral zones in the Jahazpur belt area of Rajasthan, India using Airborne Visible/Infrared Imaging Spectrometer Next Generation (AVIRIS-NG) hyperspectral imagery. The SFF algorithm was applied to process the AVIRIS-NG imagery to identify and enhance mineral mapping with better accuracy. Preprocessing steps including noise removal and dimensionality reduction using Minimum Noise Fraction transformation were applied. Pixel Purity Index and n-Dimensional visualization were used to extract pure pixel endmembers. The SFF method then helped classify the imagery and produce a mineral distribution map of the study area with high efficiency.
This document discusses making fuel type classification maps (FCM) compliant with the INSPIRE Land Cover data specification. It identifies Land Cover as the most applicable INSPIRE theme and analyzes its CoreRaster application schema. The FCM data will be modeled following this schema, with fuel types encoded in an external file and metadata created using an FCM-specific profile. This will allow FCMs to be shared and used as intended - as input for fire simulation processes.
This document compares three methods for mapping land cover of Vaderahalli Village, India: analysis of satellite imagery using GIS software MapInfo, analysis of Google Earth images using Google Pro software, and analysis of Google Earth images using MATLAB software. Land cover features mapped included green cover, water bodies, open spaces, paved surfaces and built-up areas. Results from each method were verified on-site using GPS. Analysis with MapInfo using satellite imagery provided the most accurate results but was more expensive and complex. Google Pro analysis was less accurate but simpler and cheaper. MATLAB analysis was least accurate and most complex and time-consuming. Overall, remote sensing with GIS provided the most effective land cover mapping approach.
PCI Geomatics is a leading geospatial software and solutions company with over 70 employees and 25,000 licenses installed worldwide. They provide powerful and scalable image processing solutions to extract information from satellite imagery such as SAR (Synthetic Aperture Radar) and LIDAR. Their capabilities include orthorectification, image classification, change detection, and digital elevation model extraction. They support a variety of sensors and applications in areas such as maritime surveillance, disaster response, and natural resource monitoring.
More Related Content
Similar to 2012. Ice-wedge polygons geodatabase - poster
The document analyzes geometric and topological characteristics of polygonal networks formed by freezing and thawing of soils in Adventdalen, Svalbard, Norway. Over 10,000 polygons across 120 networks were mapped from aerial imagery. 17 networks were analyzed in detail. Larger networks had smaller average polygon sizes while some networks with larger polygons showed signs of subdivision into smaller polygons over time. Networks with higher percentages of intersections with 4 sides (tetravalent vertices) and smaller, more uniform polygon sizes showed progression toward an equilibrium cracking pattern.
The document discusses metadata and geospatial data management. It describes the purpose of metadata including protecting investments in data creation and ensuring data integrity. It also outlines challenges in sharing geospatial data and standards for metadata including ISO and INSPIRE. Tools are presented for creating UK and INSPIRE compliant metadata including Geodoc, an online metadata editor, and publishing metadata through the GoGeo portal.
REMOTE SENSING AND GEOGRAPHIC INFORMATION SYSTEMS AM Publications
Remote sensing technology's increasing accessibility helps us observe research and learn about our globe in ways we could only imagine a generation ago. Guides to profound knowledge of historical, conceptual and practical uses of remote sensing which is increasing GIS technology. This paper will go briefly through remote sensing benefits, history, technology and the GIS and remote sensing integration and their applications. Remote sensing (RS) is used in mapping the predicted and actual species and dominates the ecosystem canopy.
Playful Explorations of Public and Personal Data - OSCON Data 2011Andrew Turner
It’s easy to find and create data. But what are you going to do with it? Can I ask the world complex questions such as what’s the local crime rate, distance to metro, or rating of my local school? Can you combine these all together to rate houses you may want to buy? And how do you then connect back to your government and local businesses to engage in collaborative decision making.
This talk with discuss how you should consider users and their personal interactions with data and information. We’ll also peel back the covers on how open source tools such as HBase, Cascading, Geos and Polymaps handle analyzing and streaming realtime data to maps and visualizations both on the web and to mobile devices.
To illustrate what’s possible, we’ll dive through GeoCommons, a large online community of data sharing and community analytics that uses open source mapping visualization, Hadoop analysis, and mobile interfaces to provide this to the world. Users can even build and socialize their own analysis methods to share their expert knowledge with other users. We’ll also review how global organizations like the World Bank and United Nations are using these tools to connect with citizens in developing countries to empower them to make decisions on building investment and understanding how climate science may affect their areas.
Mathieu Cain's skills portfolio summarizes his expertise in geographic information systems and geospatial analysis. It includes sections on database design, data collection using GPS, remote sensing of satellite imagery, image processing and classification techniques, and spatial analysis methods such as distance analysis, site suitability analysis, and spatial-temporal analysis. The portfolio provides examples applying these GIS skills to issues such as evaluating potential airport sites, assessing wildfire risk, and modeling disease spread.
1. M.SC and PG.Diploma on Remote Sensing and Geographical information system.
2. Experience on Remote Sensing and GIS of 3 Years 11 Months.
3. 1 Year Diploma on Information Technology.
4.Certificate course On Remote Sensing & Gis From ISRO.
IRJET-Mapping of Mineral Zones using the Spectral Feature Fitting Method in J...IRJET Journal
This document summarizes a study that used the Spectral Feature Fitting (SFF) algorithm to map mineral zones in the Jahazpur belt area of Rajasthan, India using Airborne Visible/Infrared Imaging Spectrometer Next Generation (AVIRIS-NG) hyperspectral imagery. The SFF algorithm was applied to process the AVIRIS-NG imagery to identify and enhance mineral mapping with better accuracy. Preprocessing steps including noise removal and dimensionality reduction using Minimum Noise Fraction transformation were applied. Pixel Purity Index and n-Dimensional visualization were used to extract pure pixel endmembers. The SFF method then helped classify the imagery and produce a mineral distribution map of the study area with high efficiency.
This document discusses making fuel type classification maps (FCM) compliant with the INSPIRE Land Cover data specification. It identifies Land Cover as the most applicable INSPIRE theme and analyzes its CoreRaster application schema. The FCM data will be modeled following this schema, with fuel types encoded in an external file and metadata created using an FCM-specific profile. This will allow FCMs to be shared and used as intended - as input for fire simulation processes.
This document compares three methods for mapping land cover of Vaderahalli Village, India: analysis of satellite imagery using GIS software MapInfo, analysis of Google Earth images using Google Pro software, and analysis of Google Earth images using MATLAB software. Land cover features mapped included green cover, water bodies, open spaces, paved surfaces and built-up areas. Results from each method were verified on-site using GPS. Analysis with MapInfo using satellite imagery provided the most accurate results but was more expensive and complex. Google Pro analysis was less accurate but simpler and cheaper. MATLAB analysis was least accurate and most complex and time-consuming. Overall, remote sensing with GIS provided the most effective land cover mapping approach.
PCI Geomatics is a leading geospatial software and solutions company with over 70 employees and 25,000 licenses installed worldwide. They provide powerful and scalable image processing solutions to extract information from satellite imagery such as SAR (Synthetic Aperture Radar) and LIDAR. Their capabilities include orthorectification, image classification, change detection, and digital elevation model extraction. They support a variety of sensors and applications in areas such as maritime surveillance, disaster response, and natural resource monitoring.
Similar to 2012. Ice-wedge polygons geodatabase - poster (13)
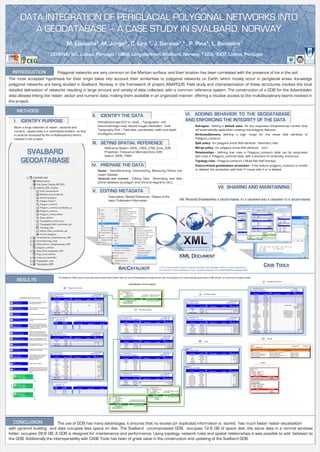
1. M. Lousada1, M. Jorge3 , C. Lira 1, J. Saraiva1,2 , P. Pina1, L. Bandeira1
1 CERENA/IST, Lisboa, Portugal.2 UNIS, Longyearbyen, Svalbard, Norway. 3 CEG/IGOT, Lisboa, Portugal
INTRODUCTION Polygonal networks are very common on the Martian surface, and their location has been correlated with the presence of ice in the soil.
The most accepted hypothesis for their origin takes into account their similarities to polygonal networks on Earth, which mostly occur in periglacial areas. Ice-wedge
polygonal networks are being studied in Svalbard, Norway, in the framework of project ANAPOLIS. Field study and characterization of these structures involves the local
detailed delineation of networks resulting in large amount and variety of data collected, with a common reference system. The construction of a GDB for the Adventdalen
data allowed linking the raster, vector and numeric data, making them available in an organized manner, offering a intuitive access to the multidisciplinary teams involved in
the project.
METHODS
II. IDENTIFY THE DATA VI. ADDING BEHAVIOR TO THE GEODATABASE
I. IDENTIFY PURPOSE Orthophotomaps (0.2 m/pixel) /Topographic and
AND ENFORCING THE INTEGRITY OF THE DATA
Store a large collection of raster , vectorial and Geomorphologic map/Aereal images Geokolibri/ Field Sub-types - Setting a default value for the respective Ortophotomap number that
numeric , spatial data in a centralized location so that Topography Grid / Field data, coordinates, width and depth will automatically apply when creating new polygons features.
it could be accessed by the multidisciplinary teams of polygons contours. AtributesDomains defining a logic range for the areas field attribute of
involved in the project. Polygons_contours.
III. SETING SPATIAL REFERENCE Split policy - for polygons areas field attribute - Geometry ratio.
Reference Sistem: WGS_1984_UTM_Zone_33N Merge policy - for polygons areas field attribute - sum.
SVALBARD Projection: Transverce MercatorZone 33N
Datum: WGS_1984
Relationships - defining how rows in Polygons_contours table can be associated
with rows in Polygons_centroid table, with a direction of cardinality, one-to-one.
GEODATABASE Topology rules - Polygons-contours -( Must Not Self Overlap).
IV. PREPARE THE DATA Feature-linked geodatabase annotation - If the feature polygons_contours is moved
Raster - Georeferencing, Orhorectifing, Mosaicing Orthos into or deleted, the annotation with field nº moves with it or is deleted.
raster Dataset
Vectorial and numeric - Editing Data, Generating new data
(Zonal statistics by polygon area Voronoi diagrams, etc.) .
VII. SHARING AND MAINTAINING
V. EDITING METADATA
Description/Spatial Reference /Status of the
data/Publication Information . VIII. REVERSE ENGINEERING A GEODATABASE TO A DIAGRAM AND A DIAGRAM TO A GEODATABASE
XML DOCUMENT
CASE TOOLS
ARCCATALOG® The computer-aided software engineering (CASE) tools subsystem allows to create blueprints of
the structure of the geodatabase using a graphical language—the Unified Modeling Language (UML).
The Svalbard GDB schema was exported to Microsoft Visio® with the use of Geodatabase Diagrammer tool, the graphics are automatically generated in MS Visio® to construct the data model.
RESULTS Annotation feature class
Geodatabase schema diagram
Polygon feature classes
Annotation feature class Geometry
Contains M values No
Polygons_ContoursAnno Contains Z values No
Relationship class
Polygon_Field_nº Allow Prec-
Line feature classes Field name Data type nulls Default value Domain ision Scale Length
Simple feature class Geometry Polygon Type Composite Forward label Polygons_ContoursAnno
Contains M values No OBJECTID Object ID
Polygons_contours Cardinality One to many Backward label Polygons_Contours
Contains Z values No SHAPE Geometry Yes
NotificationForward
Geodatabase Data Model Summary Allow Prec- FeatureID Long integer Yes 0
Origin feature class Destination feature class
Field name Data type nulls Default value Domain ision Scale Length ZOrder Long integer Yes 0
OBJECTID Object ID NamePolygons_contours Name Polygons_ContoursAnno AnnotationClassID Long integer Yes 0
Simple feature class Geometry Polyline
Point feature class Field measurements of polygons wedges, Shape Geometry Yes
Primary keyOBJECTID
Contains M values No Element Blob Yes 0 0 0
Field_measurements (width and depth of contours). Foreign keyFeatureID Opened_polygons Contains Z values No
Id Long integer Yes 0 SymbolID Long integer Yes 0
Área Double Yes area 0 0 Allow Prec- Status Short integer Yes 0 AnnotationStatus 0
Field_ID Long integer Yes 0 Field name Data type nulls Default value Domain ision Scale Length TextString String Yes 255
Polygon feature class Footprints from rasters with poligons network x_centroid Double Yes 0 0 OBJECTID Object ID FontName String Yes 255
Network_areas_footprints areas in Adventdalen. y_centroid Double Yes 0 0 Shape Geometry Yes FontSize Double Yes 0 0
Point feature classes
Orto Short integer Yes 143 0 Id Long integer Yes 0 Bold Short integer Yes BooleanSymbolValue 0
Shape_Length Double Yes 0 0 Shape_Length Double Yes 0 0 Italic Short integer Yes BooleanSymbolValue 0
Line feature class Shape_Area Double Yes 0 0 Underline Short integer Yes BooleanSymbolValue 0
lines representing incomplete polygons.
Opened_polygons VerticalAlignment Short integer Yes VerticalAlignment 0
HorizontalAlignment Short integer Yes HorizontalAlignment 0
Subtypes of Polygons_contours Simple feature class Geometry Point Simple feature class Geometry Polyline
Contains M values No XOffset Double Yes 0 0
Contains M values No
Point feature class Point feature class representing the polygons Subtype field Orto Polygons_centroid_coordinates_xy Contains Z values No Topography_contour_lines Contains Z values No YOffset Double Yes 0 0
Polygons_centroid_coordinates_xy xy centroid Default subtype 143 List of defined default values and domains for subtypes in this class Angle Double Yes 0 0
Allow Prec- Allow Prec-
Subtype Subtype Field name Data type nulls Default value Domain ision Scale Length Field name Data type nulls Default value Domain ision Scale Length FontLeading Double Yes 0 0
Poygon feature class representing contours Code Description Field name Default value Domain OBJECTID Object ID WordSpacing Double Yes 0 0
OBJECTID Object ID
Polygon feature class
from all areas with networks in Adventdalen. 143 Orto 143 Área area Shape Geometry Yes Shape Geometry Yes CharacterWidth Double Yes 0 0
Polygons_contours
Subtypes point to respective ortophotomap by 144 Orto 144 Área area Id Long integer Yes 0
ARCID Long integer Yes 0
CharacterSpacing Double Yes 0 0
Subtypes are Orto 143, Orto 144, Orto 145 color classification in the map. 145 Orto 145 Área area Área Double Yes 0 0
GRID_CODE Long integer Yes 0
FlipAngle Double Yes 0 0
Field_ID Long integer Yes 0 Override Long integer Yes 0
FROM_NODE Long integer Yes 0
x_centroid Double Yes 0 0 SHAPE_Length Double Yes 0 0
Feature linked annotation (polygon field TO_NODE Long integer Yes 0
Annotation feature class y_centroid Double Yes 0 0 SHAPE_Area Double Yes 0 0
number). The text its placed on maps with Simple feature class Geometry Polygon Shape_Length Double Yes 0 0
Polygons_ContoursAnno Contains M values No
polygon contours, each piece of text stores its Network_areas_footprints Contains Z values No
own position, text string, and display properties.
Allow Prec- Simple feature class Geometry Point
Field name Data type nulls Default value Domain ision Scale Length Contains M values No
Line feature class Elevation contour lines generated from field Field_measurements Contains Z values No Topology
Topography_contour_lines topography data obtaind in the 2010 campain OBJECTID Object ID
Shape Geometry Yes Allow Prec-
id String Yes 10 Field name Data type nulls Default value Domain ision Scale Length Tables
OBJECTID Object ID
Point feature class Field topography coordinates (x,y,z), obtaind Shape_Length Double Yes 0 0
Topography_field_coordinates_xyz with a DGPS in the 2010 campain Shape_Area Double Yes 0 0 Shape Geometry Yes
Field_ID Long integer Yes 0 Custer tolerance 0.000000001
Field_ID_1 Long integer Yes 0 Topology_rules
Polygons vertices coordinates (x,y,z), obtaind Table
Point feature class
with a DGPS in the 2010 campain polygons_centroid Features intarget feature class Topology rule Features in comparison feature class
Vertices_field_coordinates_xyz
Simple feature class Geometry Polygon Allow Prec- Field_measurements Must be Covered by Boundary Of
Geometry Point
Polygons_contours
Contains M values No Simple feature class Field name Data type nulls Default value Domain ision Scale Length
Voronoi_diagrams Contains Z values No Contains M values No Polygons_centroid_coordinates_xy Must Be Properly Inside Polygons_contours
Polygon feature class Voronoi diagrams generated with polygons Vertices_field_coordinates_xyz Contains Z values No OBJECTID Object ID Vertices_field_coordinates_xyz Must be Covered by Boundary Of Polygons_contours
Voronoi_diagrams centroid coordinates. Subtypes point to Allow Prec- Id Long integer Yes 0 Polygons_contours Must not Self Overlap Polygons_contours
Field name Data type nulls Default value Domain ision Scale Length Allow Prec-
Subtypes are Orto 143, Orto 144, Orto 145
respective ortophotomap by color Field name Data type nulls Default value Domain ision Scale Length Área Double Yes 0 0
OBJECTID Object ID
classification in the map. OBJECTID Object ID Field_ID Long integer Yes 0
Shape Geometry Yes
Shape Geometry Yes x_centroid Double Yes 0 0
FID_1 Long integer Yes 0
Table POINTID Long integer Yes 0 y_centroid Double Yes 0 0 Domains
ID Double Yes 0 0
Polygons centroid coordinates. x Double Yes 0 0
polygons_centroid GRIDCODE Double Yes 0 0
FID_2 Long integer Yes 0 y Double Yes 0 0
Table
Id_1 Long integer Yes 0 z Double Yes 0 0
Zonal statistics by polygon area, over a slope x_1 Double Yes 0 0 Slope_zonal_statistics
Table Área Double Yes 0 0
(degrees) raster derived from topography field y1 Double Yes 0 0
Range domain
Slope_zonal_statistics Field_ID Long integer Yes 0
data, includes standard deviations, average Allow Prec- area
x_centroid Double Yes 0 0 Field name Data type nulls Default value Domain ision Scale Length
and sum. Description polygon_area
y_centroid Double Yes 0 0 OBJECTID Object ID Field type Double
Simple feature class Geometry Point Split policy Geometry ratio
Distance Double Yes 0 0 ID Long integer Yes 0
Relationship class Contains M values No
orto Long integer Yes 143 0 Topography_field_coordinates_xyz Contains Z values No PolyFID Long integer Yes 0 Merge Sum values
Polygon_Field_nº policy
Minimum value Maximum value
Shape_Length Double Yes 0 0 Allow Prec- ZSTATS_MIN Double Yes 0 0
One to One 0.1 1000000
Shape_Area Double Yes 0 0 Field name Data type nulls Default value Domain ision Scale Length ZSTATS_MAX Double Yes 0 0
OBJECTID Object ID ZSTATS_AVG Double Yes 0 0
Shape Geometry ZSTATS_STD Double Yes 0 0 Coded value domain
Subtypes of Voronoi_diagrams Yes 0
POINTID Long integer ZSTATS_SUM Double Yes 0 0 AnnotationStatus
Relationship class Subtype field orto Yes 0 0 Description Valid annotation
GRID_CODE Double ZSTATS_CNT Long integer Yes 0
Polygons_centroid Default subtype 143 List of defined default values and domains for subtypes in this class Yes Field type state values.
object_id Long integer Yes 0
Split policy Short integer
One to One Subtype Subtype
Code Description Relationship class Merge Duplicate
Field name Default value Domain
Polygons_centroid policyCode value
Default Description
143 Orto 143 Área
TypeSimple Forward label Polygons_contours 0 Placed
144 Orto 144 Área
CardinalityOne to one Backward label 1 Unplaced
Relationship class 145 Orto 145 Área
NotificationNone polygons_centroid
Slope_statistics NameOrigin table Destination feature class
One to One Primary key
Relationship class polygons_centroid Name Polygons_contours
Foreign key
Slope_statistics x_centroid
x_centroid
TypeSimple Forward label Polygons_contours
CardinalityOne to one Backward label Slope_zonal_statistics
NotificationNone
Origin table Destination feature class
NameSlope_zonal_statistics NamePolygons_contours
Primary keyOBJECTID
Foreign keyOBJECTID
CONCLUSION The use of GDB has many advantages, it ensures that no excess (or duplicate) information is stored, has much faster raster visualization
with pyramid building and data occupies less space on disk. The Svalbard uncompressed GDB, occupies 12.6 GB of space disk, the same data in a normal windows
folder, occupies 28.8 GB. A GDB is designed for maintenance and performance. Using topology, network rules and spatial relationships it was possible to add behavior to
the GDB. Additionally the interoperability with CASE Tools has been of great value in the construction and updating of the Svalbard GDB.