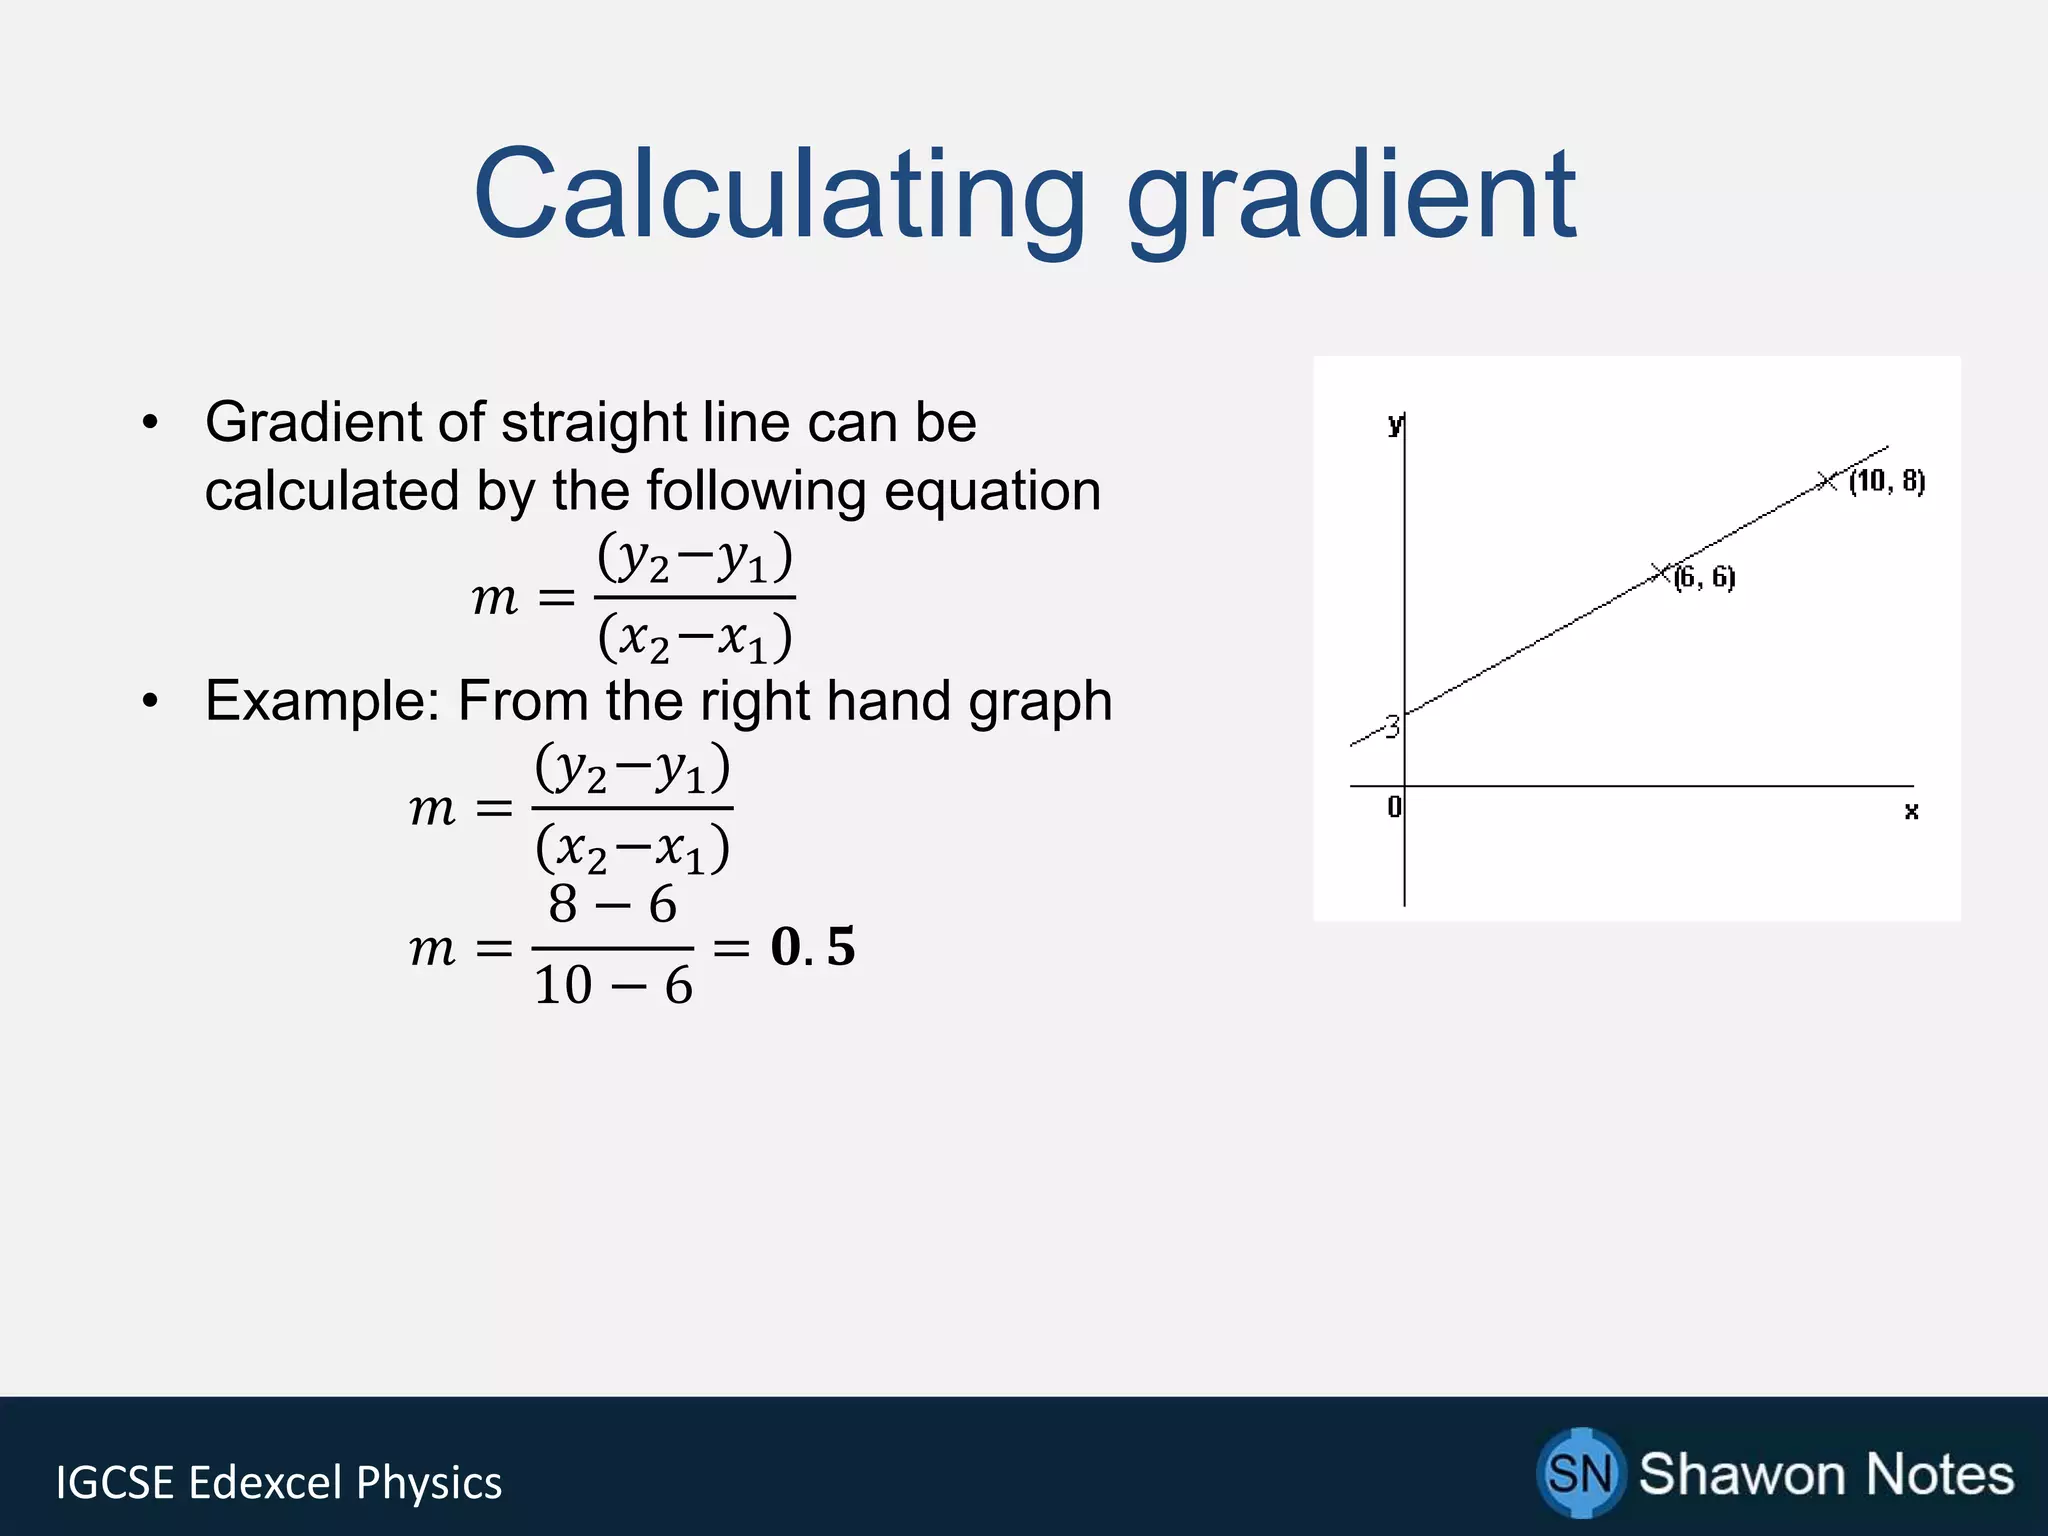
SlideShare a Scribd company logo
1 of 10
IGCSE Edexcel Physics
Graphs
Practical Questions
IGCSE Edexcel Physics
Getting Started
Students are required to know:
• To calculate gradient of the graph
• To sketch “line of best fit” and “curve of
best fit”
• Types of graphs: line and bar chart and
when and where to use them.
• Shapes of graph
IGCSE Edexcel Physics
Calculating gradient
• Gradient of straight line can be
calculated by the following equation
𝑚 =
(𝑦2−𝑦1)
(𝑥2−𝑥1)
• Example: From the right hand graph
𝑚 =
(𝑦2−𝑦1)
(𝑥2−𝑥1)
𝑚 =
8 − 6
10 − 6
= 𝟎. 𝟓
IGCSE Edexcel Physics
Independent variable vs Dependent
variable
• The independent
variable is always on
the horizontal x-axis,
and the dependent
variable is always on
the vertical y-axis as
shown on the right.
IGCSE Edexcel Physics
Types of graph
There are many kinds of graph. Graphs with
axis (x and y) are basically two types:
• Line graph
• Bar chart
• Lines charts are used for continuous
variables and Bar chart are used of
discontinuous variables.
IGCSE Edexcel Physics
Line of best fit
• Line of best fit is
the line that is the
most closest to all
the points.
• It also helps
discard
anomalous
readings
IGCSE Edexcel Physics
Curve of best fit
• The curve of best
fit needs to be
smooth and close
to most of its
readings
• It doesn’t
necessarily have to
join all the points in
the graph
IGCSE Edexcel Physics
Describing Shapes of Graph
• Linear relationship: If a graph produce a straight line,
then the relationship between the two variables is linear.
• Non-linear relationship: If the graph is curved, then the
relationship is non-linear.
IGCSE Edexcel Physics
Describing Shapes of Graph
• Graphs often pass through origin
• Positive/negative correlation: If the gradient of the graph
is positive, then it has positive correlation. If the gradient
is negative, then the graph has negative correlation
• Inverse relationship: The relationship is said to be
inverse if the correlation is negative. That is, if one
variable’s value increase, the other’s decrease.
IGCSE Edexcel Physics
Tips
Graphs are often marked for the following
features:
• Size: your graph should cover more than
50% of the graph paper
• Axis: Label quantity and unit, keep
numbers evenly spaced

More Related Content

What's hot

Metallic Bonding
Metallic BondingMetallic Bonding
Metallic BondingPaula Mills
 
engineering statics :force systems
 engineering statics :force systems engineering statics :force systems
engineering statics :force systemsmusadoto
 
Addition of Vectors | By Head to Tail Rule
Addition of Vectors | By Head to Tail RuleAddition of Vectors | By Head to Tail Rule
Addition of Vectors | By Head to Tail RuleAdeel Rasheed
 
Introduction to vectors
Introduction to vectorsIntroduction to vectors
Introduction to vectorshamcosine
 
Properties of metals
Properties of metalsProperties of metals
Properties of metalsPriti Nayak
 
Change of Phase and Latent Heat
Change of Phase and Latent HeatChange of Phase and Latent Heat
Change of Phase and Latent HeatLyn Agustin
 
Scalars And Vectors
Scalars And  VectorsScalars And  Vectors
Scalars And Vectorsyapshinn
 
0625 w05 qp_1
0625 w05 qp_10625 w05 qp_1
0625 w05 qp_1King Ali
 
Chapter 1 kinetic particle theory (1)
Chapter 1   kinetic particle theory (1)Chapter 1   kinetic particle theory (1)
Chapter 1 kinetic particle theory (1)AR Sharmila Jose
 
Projectile motion
Projectile motionProjectile motion
Projectile motionnlahoud
 
Fluid mechanics lectur notes
Fluid mechanics lectur notesFluid mechanics lectur notes
Fluid mechanics lectur notesisminci
 
Grade 9 U0-L3 - Measurement
Grade 9 U0-L3 - MeasurementGrade 9 U0-L3 - Measurement
Grade 9 U0-L3 - Measurementgruszecki1
 
FORCE | CONTACT AND NON-CONTACT FORCES
FORCE | CONTACT AND NON-CONTACT FORCESFORCE | CONTACT AND NON-CONTACT FORCES
FORCE | CONTACT AND NON-CONTACT FORCESSiddhesh Karangutkar
 
AQA Biology unit 3
AQA Biology unit 3AQA Biology unit 3
AQA Biology unit 3Saqib Ali
 

What's hot (20)

Metallic Bonding
Metallic BondingMetallic Bonding
Metallic Bonding
 
statics
staticsstatics
statics
 
engineering statics :force systems
 engineering statics :force systems engineering statics :force systems
engineering statics :force systems
 
Addition of Vectors | By Head to Tail Rule
Addition of Vectors | By Head to Tail RuleAddition of Vectors | By Head to Tail Rule
Addition of Vectors | By Head to Tail Rule
 
Introduction to vectors
Introduction to vectorsIntroduction to vectors
Introduction to vectors
 
Properties of metals
Properties of metalsProperties of metals
Properties of metals
 
Change of Phase and Latent Heat
Change of Phase and Latent HeatChange of Phase and Latent Heat
Change of Phase and Latent Heat
 
Matter
MatterMatter
Matter
 
Scalars And Vectors
Scalars And  VectorsScalars And  Vectors
Scalars And Vectors
 
Unit and Measure
Unit and MeasureUnit and Measure
Unit and Measure
 
0625 w05 qp_1
0625 w05 qp_10625 w05 qp_1
0625 w05 qp_1
 
Chapter 1 kinetic particle theory (1)
Chapter 1   kinetic particle theory (1)Chapter 1   kinetic particle theory (1)
Chapter 1 kinetic particle theory (1)
 
Projectile motion
Projectile motionProjectile motion
Projectile motion
 
Ch 2 ~ vector
Ch 2 ~ vectorCh 2 ~ vector
Ch 2 ~ vector
 
Fluid mechanics lectur notes
Fluid mechanics lectur notesFluid mechanics lectur notes
Fluid mechanics lectur notes
 
Grade 9 U0-L3 - Measurement
Grade 9 U0-L3 - MeasurementGrade 9 U0-L3 - Measurement
Grade 9 U0-L3 - Measurement
 
FORCE | CONTACT AND NON-CONTACT FORCES
FORCE | CONTACT AND NON-CONTACT FORCESFORCE | CONTACT AND NON-CONTACT FORCES
FORCE | CONTACT AND NON-CONTACT FORCES
 
AQA Biology unit 3
AQA Biology unit 3AQA Biology unit 3
AQA Biology unit 3
 
Chapter 8.3: Ionic and Metallic Bonds
Chapter 8.3: Ionic and Metallic BondsChapter 8.3: Ionic and Metallic Bonds
Chapter 8.3: Ionic and Metallic Bonds
 
FLUID MECHANICS
FLUID MECHANICSFLUID MECHANICS
FLUID MECHANICS
 

Similar to IGCSE Physics Graphs

Maths presentation
Maths presentationMaths presentation
Maths presentationMEBAD1
 
Finding the correlation co-efficient using Excel.pptx
Finding the correlation co-efficient using Excel.pptxFinding the correlation co-efficient using Excel.pptx
Finding the correlation co-efficient using Excel.pptxGargiAkhoury2
 
Obj. 18 Isosceles and Equilateral Triangles
Obj. 18 Isosceles and Equilateral TrianglesObj. 18 Isosceles and Equilateral Triangles
Obj. 18 Isosceles and Equilateral Trianglessmiller5
 
Grade 9 U0-L5-Graphing
Grade 9 U0-L5-GraphingGrade 9 U0-L5-Graphing
Grade 9 U0-L5-Graphinggruszecki1
 
Curve fitting of exponential curve
Curve fitting of exponential curveCurve fitting of exponential curve
Curve fitting of exponential curveDivyang Rathod
 
Bmb12e ppt 1_r
Bmb12e ppt 1_rBmb12e ppt 1_r
Bmb12e ppt 1_rJohn Hani
 
135. Graphic Presentation
135. Graphic Presentation135. Graphic Presentation
135. Graphic PresentationLAKSHMANAN S
 
LINEAR ALGEBRA, WITH OPTIMIZATION
LINEAR ALGEBRA, WITH OPTIMIZATIONLINEAR ALGEBRA, WITH OPTIMIZATION
LINEAR ALGEBRA, WITH OPTIMIZATIONCHARAK RAY
 
Checklist for practicals[1]
Checklist for practicals[1]Checklist for practicals[1]
Checklist for practicals[1]shravan900
 
DATA GRAPHICS 8th Sem.pdf
DATA GRAPHICS 8th Sem.pdfDATA GRAPHICS 8th Sem.pdf
DATA GRAPHICS 8th Sem.pdfRavinandan A P
 
ANALYTIC-GEOMETRY(4).pptx
ANALYTIC-GEOMETRY(4).pptxANALYTIC-GEOMETRY(4).pptx
ANALYTIC-GEOMETRY(4).pptxBercasioKelvin
 
Unit 1 – Geometric Terms & Definitions
Unit 1 – Geometric Terms & DefinitionsUnit 1 – Geometric Terms & Definitions
Unit 1 – Geometric Terms & DefinitionsMs. Rey ZE.K
 
Parallel Line Properties
Parallel Line PropertiesParallel Line Properties
Parallel Line PropertiesFidelfo Moral
 
PG STAT 531 Lecture 3 Graphical and Diagrammatic Representation of Data
PG STAT 531 Lecture 3 Graphical and Diagrammatic Representation of DataPG STAT 531 Lecture 3 Graphical and Diagrammatic Representation of Data
PG STAT 531 Lecture 3 Graphical and Diagrammatic Representation of DataAashish Patel
 

Similar to IGCSE Physics Graphs (20)

Maths presentation
Maths presentationMaths presentation
Maths presentation
 
Math 8 linear inequalities
Math 8   linear inequalitiesMath 8   linear inequalities
Math 8 linear inequalities
 
Finding the correlation co-efficient using Excel.pptx
Finding the correlation co-efficient using Excel.pptxFinding the correlation co-efficient using Excel.pptx
Finding the correlation co-efficient using Excel.pptx
 
Obj. 18 Isosceles and Equilateral Triangles
Obj. 18 Isosceles and Equilateral TrianglesObj. 18 Isosceles and Equilateral Triangles
Obj. 18 Isosceles and Equilateral Triangles
 
Presenting scientific data graphing
Presenting scientific data graphingPresenting scientific data graphing
Presenting scientific data graphing
 
Grade 9 U0-L5-Graphing
Grade 9 U0-L5-GraphingGrade 9 U0-L5-Graphing
Grade 9 U0-L5-Graphing
 
Vectors Yr 1.pptx
Vectors Yr 1.pptxVectors Yr 1.pptx
Vectors Yr 1.pptx
 
Curve fitting of exponential curve
Curve fitting of exponential curveCurve fitting of exponential curve
Curve fitting of exponential curve
 
Bmb12e ppt 1_r
Bmb12e ppt 1_rBmb12e ppt 1_r
Bmb12e ppt 1_r
 
135. Graphic Presentation
135. Graphic Presentation135. Graphic Presentation
135. Graphic Presentation
 
LINEAR ALGEBRA, WITH OPTIMIZATION
LINEAR ALGEBRA, WITH OPTIMIZATIONLINEAR ALGEBRA, WITH OPTIMIZATION
LINEAR ALGEBRA, WITH OPTIMIZATION
 
Checklist for practicals[1]
Checklist for practicals[1]Checklist for practicals[1]
Checklist for practicals[1]
 
Lec 1.0.pptx
Lec 1.0.pptxLec 1.0.pptx
Lec 1.0.pptx
 
DATA GRAPHICS 8th Sem.pdf
DATA GRAPHICS 8th Sem.pdfDATA GRAPHICS 8th Sem.pdf
DATA GRAPHICS 8th Sem.pdf
 
Ch02
Ch02Ch02
Ch02
 
ANALYTIC-GEOMETRY(4).pptx
ANALYTIC-GEOMETRY(4).pptxANALYTIC-GEOMETRY(4).pptx
ANALYTIC-GEOMETRY(4).pptx
 
Linear relations
   Linear relations   Linear relations
Linear relations
 
Unit 1 – Geometric Terms & Definitions
Unit 1 – Geometric Terms & DefinitionsUnit 1 – Geometric Terms & Definitions
Unit 1 – Geometric Terms & Definitions
 
Parallel Line Properties
Parallel Line PropertiesParallel Line Properties
Parallel Line Properties
 
PG STAT 531 Lecture 3 Graphical and Diagrammatic Representation of Data
PG STAT 531 Lecture 3 Graphical and Diagrammatic Representation of DataPG STAT 531 Lecture 3 Graphical and Diagrammatic Representation of Data
PG STAT 531 Lecture 3 Graphical and Diagrammatic Representation of Data
 

Recently uploaded

Paris 2024 Olympic Geographies - an activity
Paris 2024 Olympic Geographies - an activityParis 2024 Olympic Geographies - an activity
Paris 2024 Olympic Geographies - an activityGeoBlogs
 
Russian Escort Service in Delhi 11k Hotel Foreigner Russian Call Girls in Delhi
Russian Escort Service in Delhi 11k Hotel Foreigner Russian Call Girls in DelhiRussian Escort Service in Delhi 11k Hotel Foreigner Russian Call Girls in Delhi
Russian Escort Service in Delhi 11k Hotel Foreigner Russian Call Girls in Delhikauryashika82
 
BAG TECHNIQUE Bag technique-a tool making use of public health bag through wh...
BAG TECHNIQUE Bag technique-a tool making use of public health bag through wh...BAG TECHNIQUE Bag technique-a tool making use of public health bag through wh...
BAG TECHNIQUE Bag technique-a tool making use of public health bag through wh...Sapna Thakur
 
SOCIAL AND HISTORICAL CONTEXT - LFTVD.pptx
SOCIAL AND HISTORICAL CONTEXT - LFTVD.pptxSOCIAL AND HISTORICAL CONTEXT - LFTVD.pptx
SOCIAL AND HISTORICAL CONTEXT - LFTVD.pptxiammrhaywood
 
Grant Readiness 101 TechSoup and Remy Consulting
Grant Readiness 101 TechSoup and Remy ConsultingGrant Readiness 101 TechSoup and Remy Consulting
Grant Readiness 101 TechSoup and Remy ConsultingTechSoup
 
microwave assisted reaction. General introduction
microwave assisted reaction. General introductionmicrowave assisted reaction. General introduction
microwave assisted reaction. General introductionMaksud Ahmed
 
Activity 01 - Artificial Culture (1).pdf
Activity 01 - Artificial Culture (1).pdfActivity 01 - Artificial Culture (1).pdf
Activity 01 - Artificial Culture (1).pdfciinovamais
 
Presentation by Andreas Schleicher Tackling the School Absenteeism Crisis 30 ...
Presentation by Andreas Schleicher Tackling the School Absenteeism Crisis 30 ...Presentation by Andreas Schleicher Tackling the School Absenteeism Crisis 30 ...
Presentation by Andreas Schleicher Tackling the School Absenteeism Crisis 30 ...EduSkills OECD
 
Student login on Anyboli platform.helpin
Student login on Anyboli platform.helpinStudent login on Anyboli platform.helpin
Student login on Anyboli platform.helpinRaunakKeshri1
 
Sanyam Choudhary Chemistry practical.pdf
Sanyam Choudhary Chemistry practical.pdfSanyam Choudhary Chemistry practical.pdf
Sanyam Choudhary Chemistry practical.pdfsanyamsingh5019
 
APM Welcome, APM North West Network Conference, Synergies Across Sectors
APM Welcome, APM North West Network Conference, Synergies Across SectorsAPM Welcome, APM North West Network Conference, Synergies Across Sectors
APM Welcome, APM North West Network Conference, Synergies Across SectorsAssociation for Project Management
 
Measures of Central Tendency: Mean, Median and Mode
Measures of Central Tendency: Mean, Median and ModeMeasures of Central Tendency: Mean, Median and Mode
Measures of Central Tendency: Mean, Median and ModeThiyagu K
 
Measures of Dispersion and Variability: Range, QD, AD and SD
Measures of Dispersion and Variability: Range, QD, AD and SDMeasures of Dispersion and Variability: Range, QD, AD and SD
Measures of Dispersion and Variability: Range, QD, AD and SDThiyagu K
 
BASLIQ CURRENT LOOKBOOK LOOKBOOK(1) (1).pdf
BASLIQ CURRENT LOOKBOOK  LOOKBOOK(1) (1).pdfBASLIQ CURRENT LOOKBOOK  LOOKBOOK(1) (1).pdf
BASLIQ CURRENT LOOKBOOK LOOKBOOK(1) (1).pdfSoniaTolstoy
 
Arihant handbook biology for class 11 .pdf
Arihant handbook biology for class 11 .pdfArihant handbook biology for class 11 .pdf
Arihant handbook biology for class 11 .pdfchloefrazer622
 
Accessible design: Minimum effort, maximum impact
Accessible design: Minimum effort, maximum impactAccessible design: Minimum effort, maximum impact
Accessible design: Minimum effort, maximum impactdawncurless
 
The Most Excellent Way | 1 Corinthians 13
The Most Excellent Way | 1 Corinthians 13The Most Excellent Way | 1 Corinthians 13
The Most Excellent Way | 1 Corinthians 13Steve Thomason
 
Explore beautiful and ugly buildings. Mathematics helps us create beautiful d...
Explore beautiful and ugly buildings. Mathematics helps us create beautiful d...Explore beautiful and ugly buildings. Mathematics helps us create beautiful d...
Explore beautiful and ugly buildings. Mathematics helps us create beautiful d...christianmathematics
 
Disha NEET Physics Guide for classes 11 and 12.pdf
Disha NEET Physics Guide for classes 11 and 12.pdfDisha NEET Physics Guide for classes 11 and 12.pdf
Disha NEET Physics Guide for classes 11 and 12.pdfchloefrazer622
 

Recently uploaded (20)

Paris 2024 Olympic Geographies - an activity
Paris 2024 Olympic Geographies - an activityParis 2024 Olympic Geographies - an activity
Paris 2024 Olympic Geographies - an activity
 
Russian Escort Service in Delhi 11k Hotel Foreigner Russian Call Girls in Delhi
Russian Escort Service in Delhi 11k Hotel Foreigner Russian Call Girls in DelhiRussian Escort Service in Delhi 11k Hotel Foreigner Russian Call Girls in Delhi
Russian Escort Service in Delhi 11k Hotel Foreigner Russian Call Girls in Delhi
 
BAG TECHNIQUE Bag technique-a tool making use of public health bag through wh...
BAG TECHNIQUE Bag technique-a tool making use of public health bag through wh...BAG TECHNIQUE Bag technique-a tool making use of public health bag through wh...
BAG TECHNIQUE Bag technique-a tool making use of public health bag through wh...
 
SOCIAL AND HISTORICAL CONTEXT - LFTVD.pptx
SOCIAL AND HISTORICAL CONTEXT - LFTVD.pptxSOCIAL AND HISTORICAL CONTEXT - LFTVD.pptx
SOCIAL AND HISTORICAL CONTEXT - LFTVD.pptx
 
Grant Readiness 101 TechSoup and Remy Consulting
Grant Readiness 101 TechSoup and Remy ConsultingGrant Readiness 101 TechSoup and Remy Consulting
Grant Readiness 101 TechSoup and Remy Consulting
 
microwave assisted reaction. General introduction
microwave assisted reaction. General introductionmicrowave assisted reaction. General introduction
microwave assisted reaction. General introduction
 
Activity 01 - Artificial Culture (1).pdf
Activity 01 - Artificial Culture (1).pdfActivity 01 - Artificial Culture (1).pdf
Activity 01 - Artificial Culture (1).pdf
 
Mattingly "AI & Prompt Design: The Basics of Prompt Design"
Mattingly "AI & Prompt Design: The Basics of Prompt Design"Mattingly "AI & Prompt Design: The Basics of Prompt Design"
Mattingly "AI & Prompt Design: The Basics of Prompt Design"
 
Presentation by Andreas Schleicher Tackling the School Absenteeism Crisis 30 ...
Presentation by Andreas Schleicher Tackling the School Absenteeism Crisis 30 ...Presentation by Andreas Schleicher Tackling the School Absenteeism Crisis 30 ...
Presentation by Andreas Schleicher Tackling the School Absenteeism Crisis 30 ...
 
Student login on Anyboli platform.helpin
Student login on Anyboli platform.helpinStudent login on Anyboli platform.helpin
Student login on Anyboli platform.helpin
 
Sanyam Choudhary Chemistry practical.pdf
Sanyam Choudhary Chemistry practical.pdfSanyam Choudhary Chemistry practical.pdf
Sanyam Choudhary Chemistry practical.pdf
 
APM Welcome, APM North West Network Conference, Synergies Across Sectors
APM Welcome, APM North West Network Conference, Synergies Across SectorsAPM Welcome, APM North West Network Conference, Synergies Across Sectors
APM Welcome, APM North West Network Conference, Synergies Across Sectors
 
Measures of Central Tendency: Mean, Median and Mode
Measures of Central Tendency: Mean, Median and ModeMeasures of Central Tendency: Mean, Median and Mode
Measures of Central Tendency: Mean, Median and Mode
 
Measures of Dispersion and Variability: Range, QD, AD and SD
Measures of Dispersion and Variability: Range, QD, AD and SDMeasures of Dispersion and Variability: Range, QD, AD and SD
Measures of Dispersion and Variability: Range, QD, AD and SD
 
BASLIQ CURRENT LOOKBOOK LOOKBOOK(1) (1).pdf
BASLIQ CURRENT LOOKBOOK  LOOKBOOK(1) (1).pdfBASLIQ CURRENT LOOKBOOK  LOOKBOOK(1) (1).pdf
BASLIQ CURRENT LOOKBOOK LOOKBOOK(1) (1).pdf
 
Arihant handbook biology for class 11 .pdf
Arihant handbook biology for class 11 .pdfArihant handbook biology for class 11 .pdf
Arihant handbook biology for class 11 .pdf
 
Accessible design: Minimum effort, maximum impact
Accessible design: Minimum effort, maximum impactAccessible design: Minimum effort, maximum impact
Accessible design: Minimum effort, maximum impact
 
The Most Excellent Way | 1 Corinthians 13
The Most Excellent Way | 1 Corinthians 13The Most Excellent Way | 1 Corinthians 13
The Most Excellent Way | 1 Corinthians 13
 
Explore beautiful and ugly buildings. Mathematics helps us create beautiful d...
Explore beautiful and ugly buildings. Mathematics helps us create beautiful d...Explore beautiful and ugly buildings. Mathematics helps us create beautiful d...
Explore beautiful and ugly buildings. Mathematics helps us create beautiful d...
 
Disha NEET Physics Guide for classes 11 and 12.pdf
Disha NEET Physics Guide for classes 11 and 12.pdfDisha NEET Physics Guide for classes 11 and 12.pdf
Disha NEET Physics Guide for classes 11 and 12.pdf
 

IGCSE Physics Graphs

  • 2. IGCSE Edexcel Physics Getting Started Students are required to know: • To calculate gradient of the graph • To sketch “line of best fit” and “curve of best fit” • Types of graphs: line and bar chart and when and where to use them. • Shapes of graph
  • 3. IGCSE Edexcel Physics Calculating gradient • Gradient of straight line can be calculated by the following equation 𝑚 = (𝑦2−𝑦1) (𝑥2−𝑥1) • Example: From the right hand graph 𝑚 = (𝑦2−𝑦1) (𝑥2−𝑥1) 𝑚 = 8 − 6 10 − 6 = 𝟎. 𝟓
  • 4. IGCSE Edexcel Physics Independent variable vs Dependent variable • The independent variable is always on the horizontal x-axis, and the dependent variable is always on the vertical y-axis as shown on the right.
  • 5. IGCSE Edexcel Physics Types of graph There are many kinds of graph. Graphs with axis (x and y) are basically two types: • Line graph • Bar chart • Lines charts are used for continuous variables and Bar chart are used of discontinuous variables.
  • 6. IGCSE Edexcel Physics Line of best fit • Line of best fit is the line that is the most closest to all the points. • It also helps discard anomalous readings
  • 7. IGCSE Edexcel Physics Curve of best fit • The curve of best fit needs to be smooth and close to most of its readings • It doesn’t necessarily have to join all the points in the graph
  • 8. IGCSE Edexcel Physics Describing Shapes of Graph • Linear relationship: If a graph produce a straight line, then the relationship between the two variables is linear. • Non-linear relationship: If the graph is curved, then the relationship is non-linear.
  • 9. IGCSE Edexcel Physics Describing Shapes of Graph • Graphs often pass through origin • Positive/negative correlation: If the gradient of the graph is positive, then it has positive correlation. If the gradient is negative, then the graph has negative correlation • Inverse relationship: The relationship is said to be inverse if the correlation is negative. That is, if one variable’s value increase, the other’s decrease.
  • 10. IGCSE Edexcel Physics Tips Graphs are often marked for the following features: • Size: your graph should cover more than 50% of the graph paper • Axis: Label quantity and unit, keep numbers evenly spaced