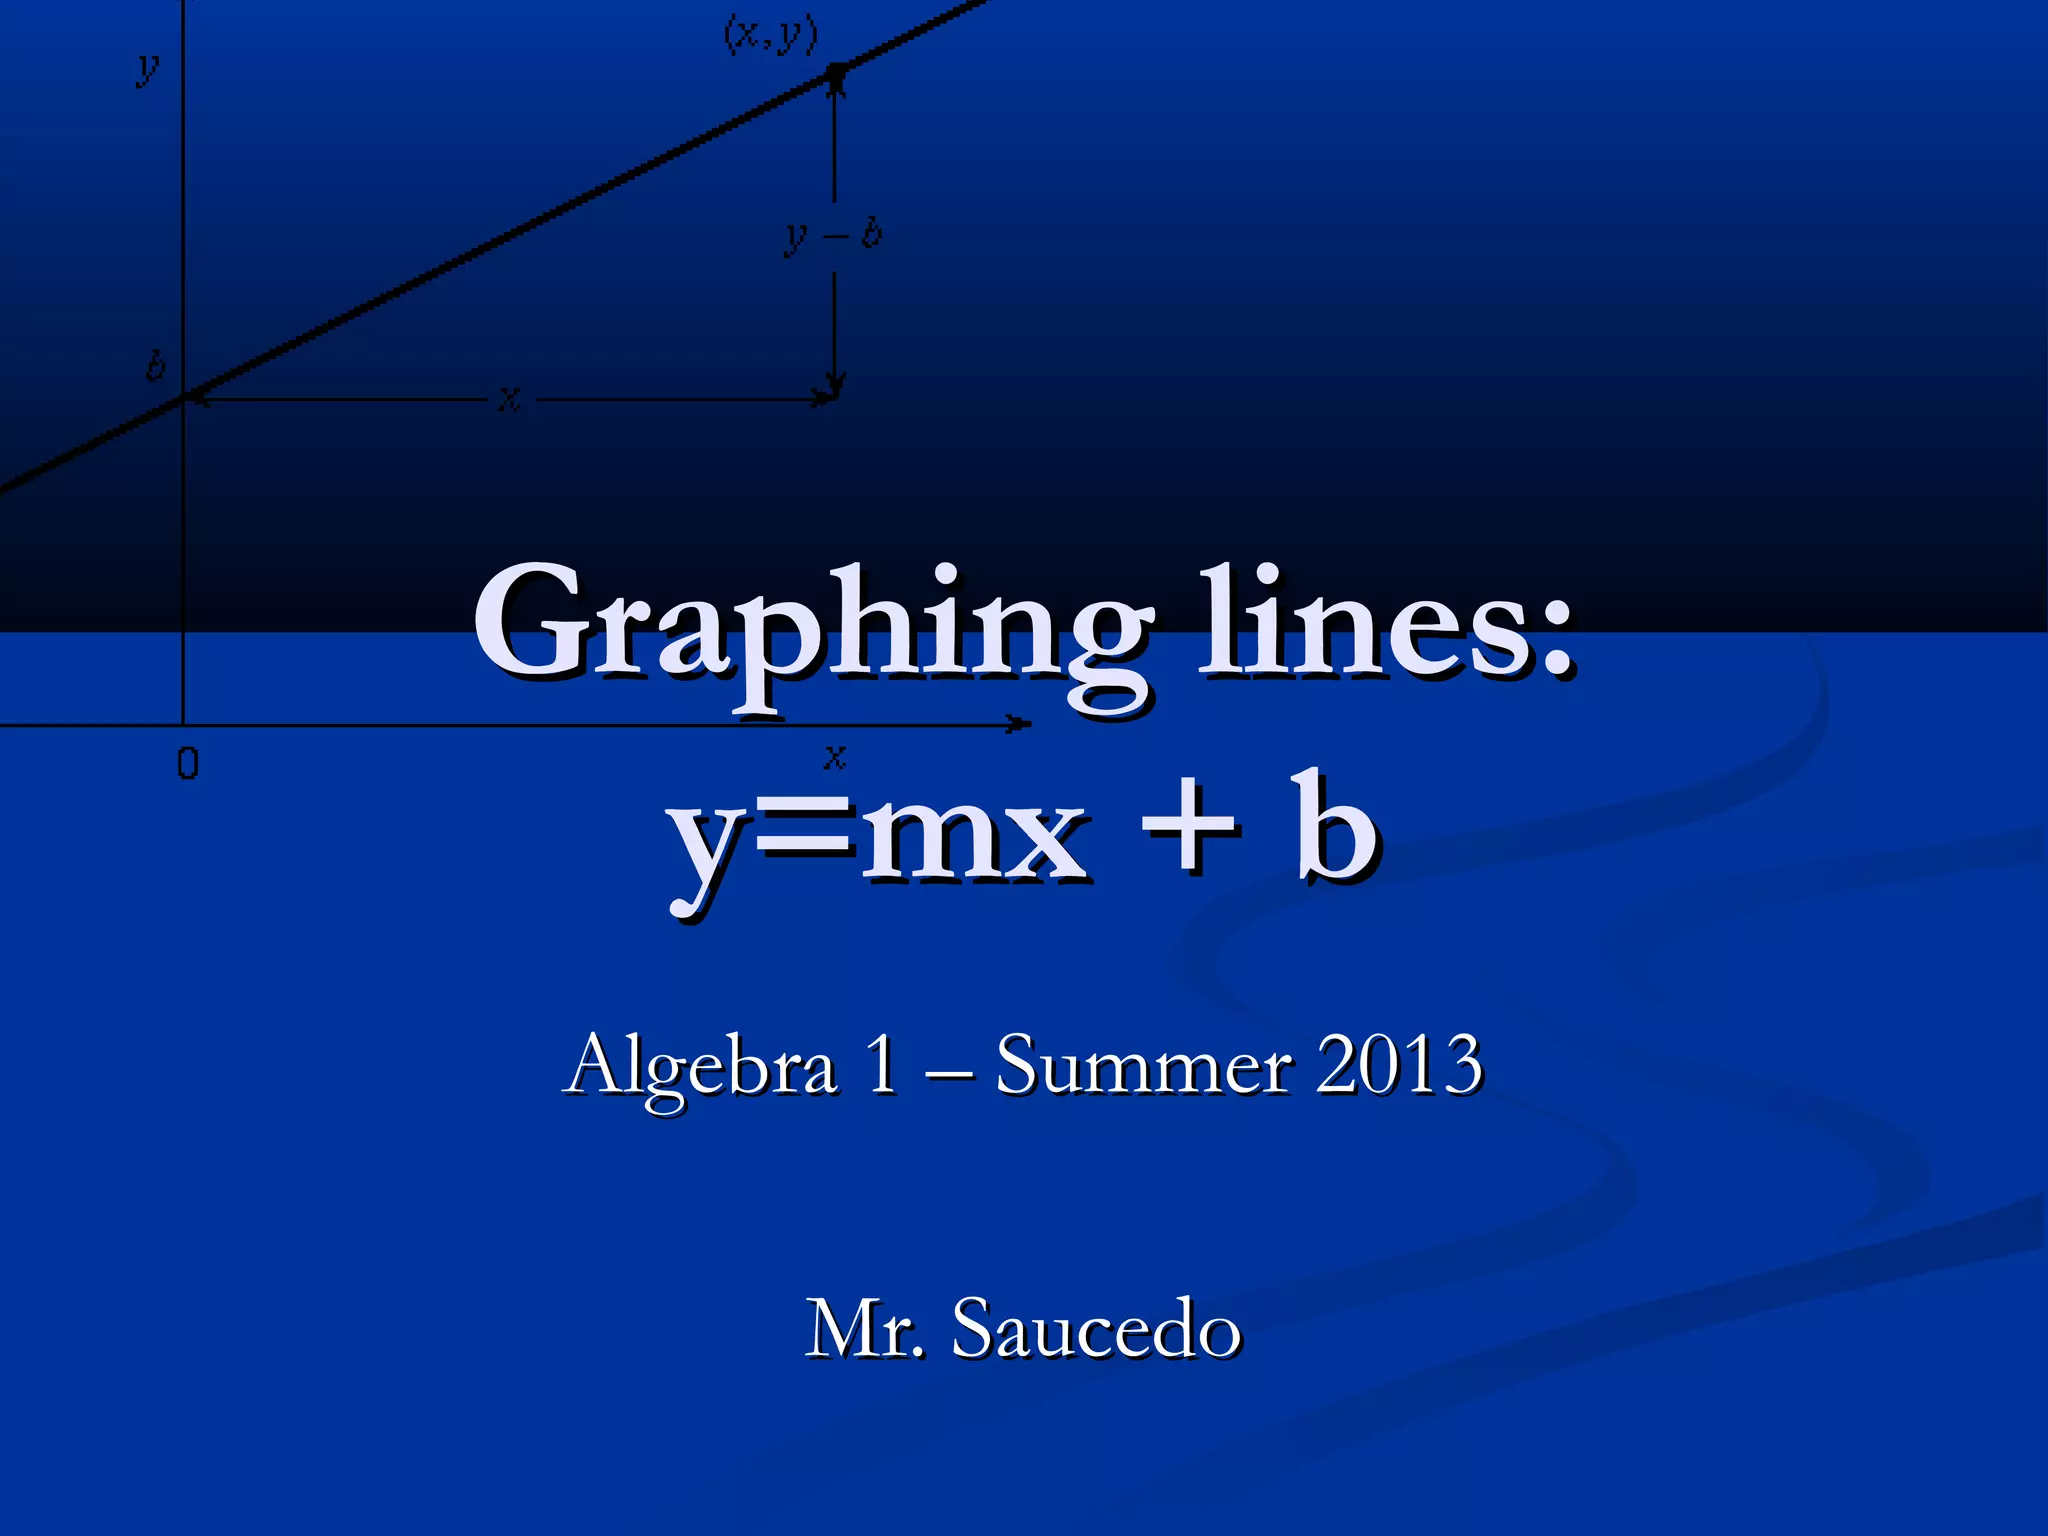
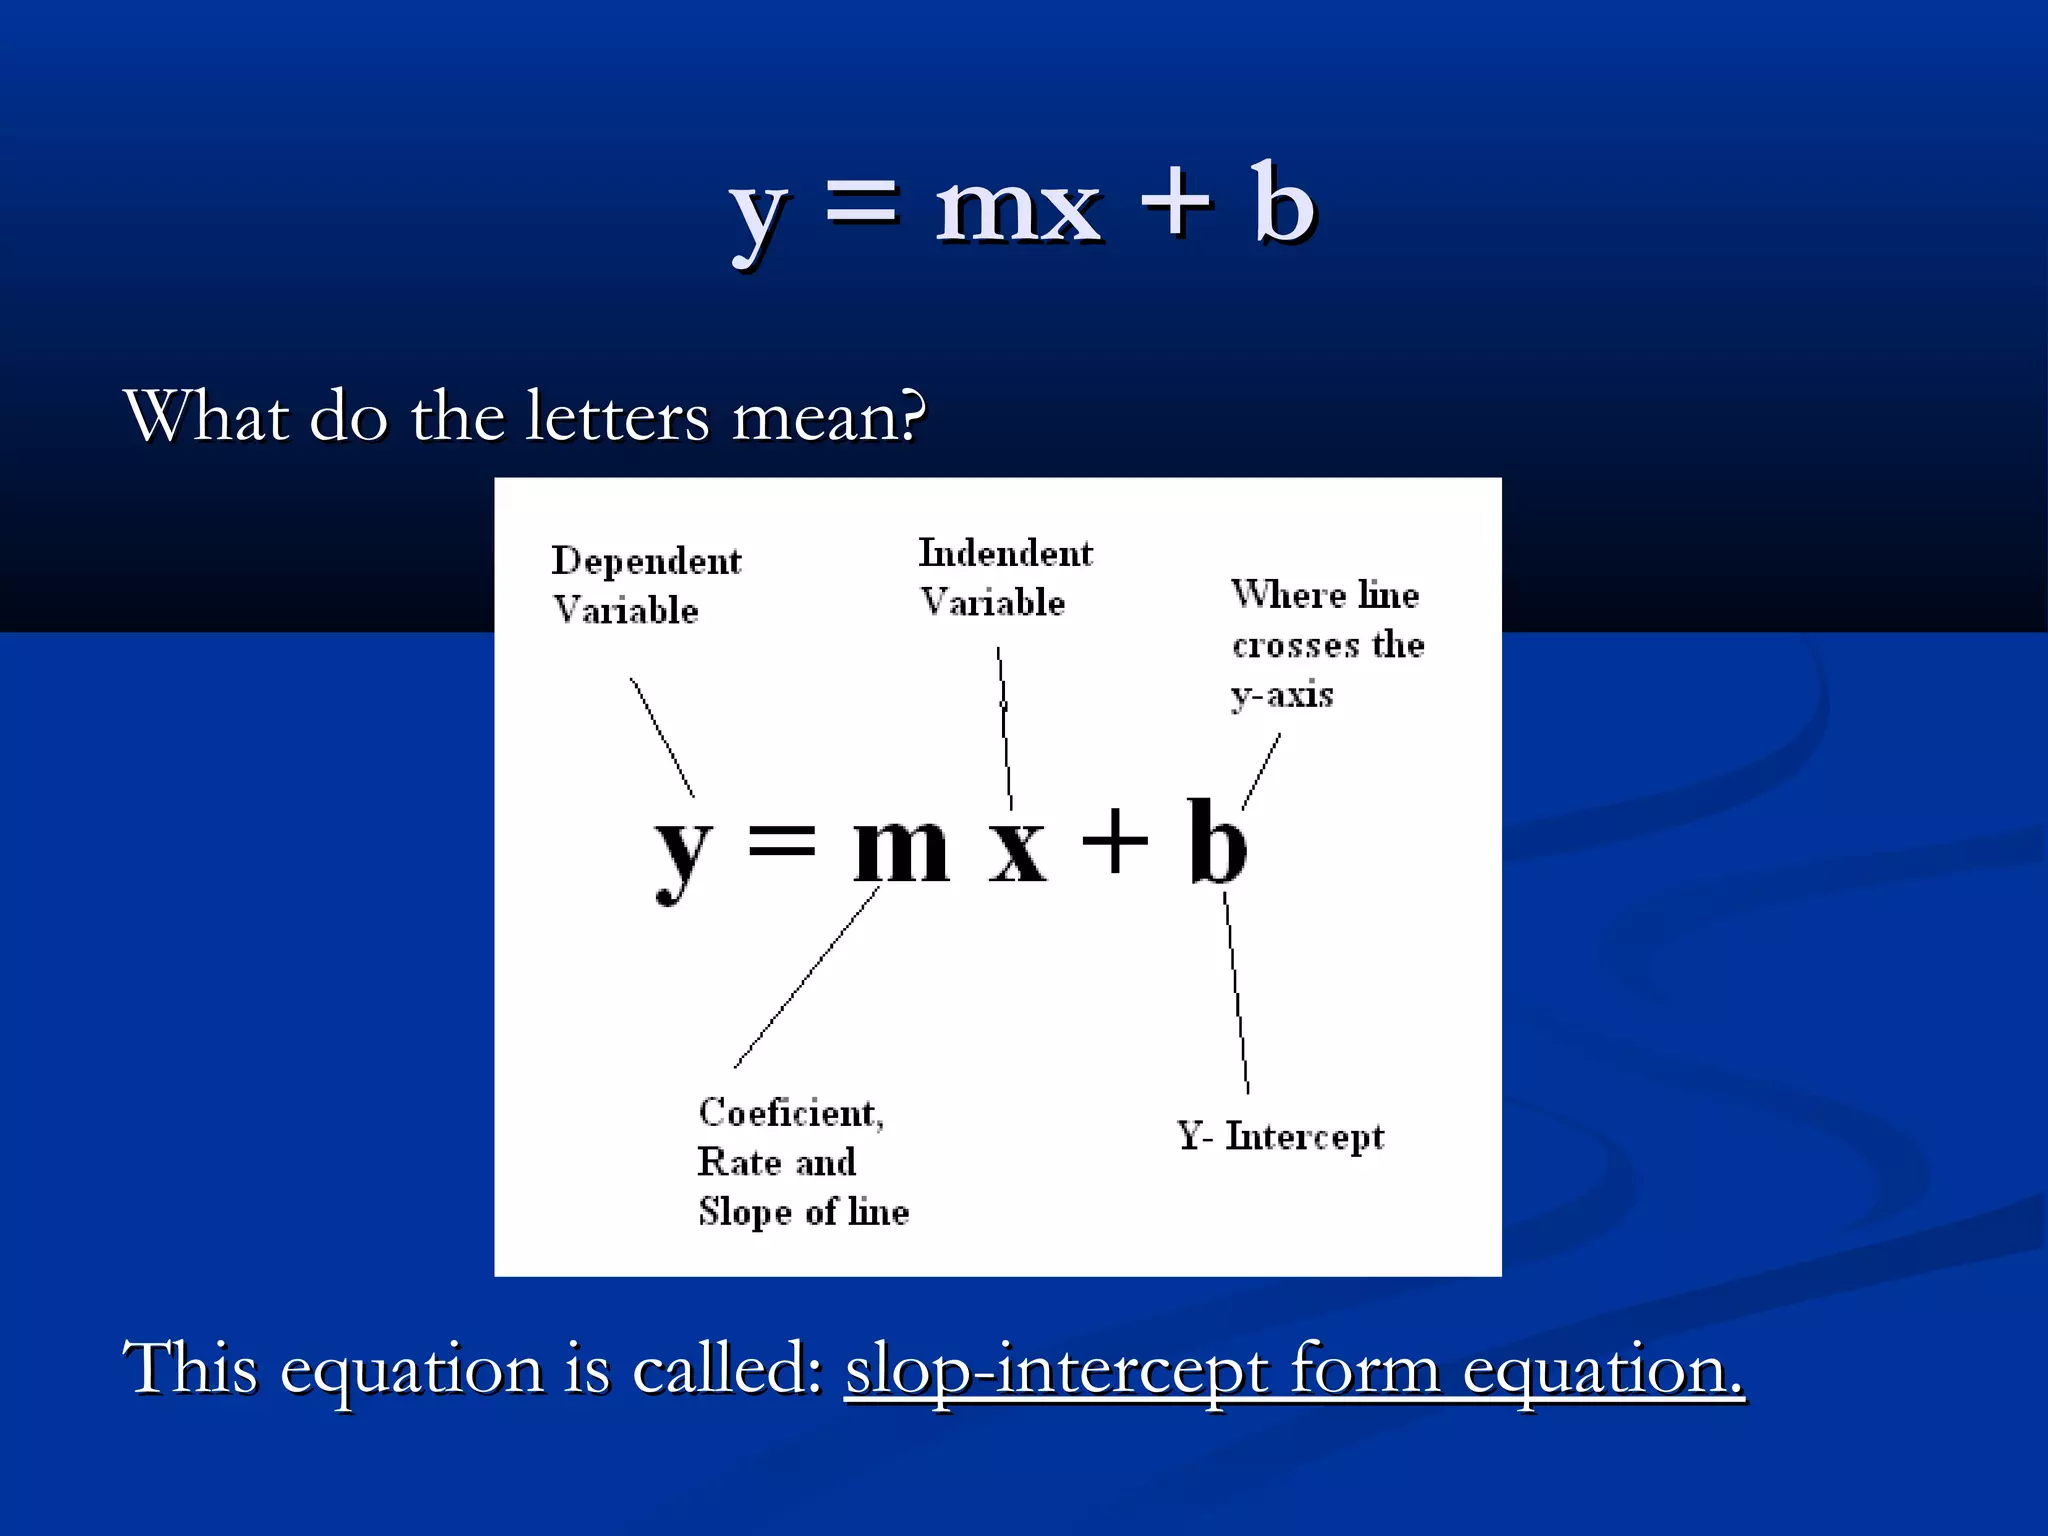
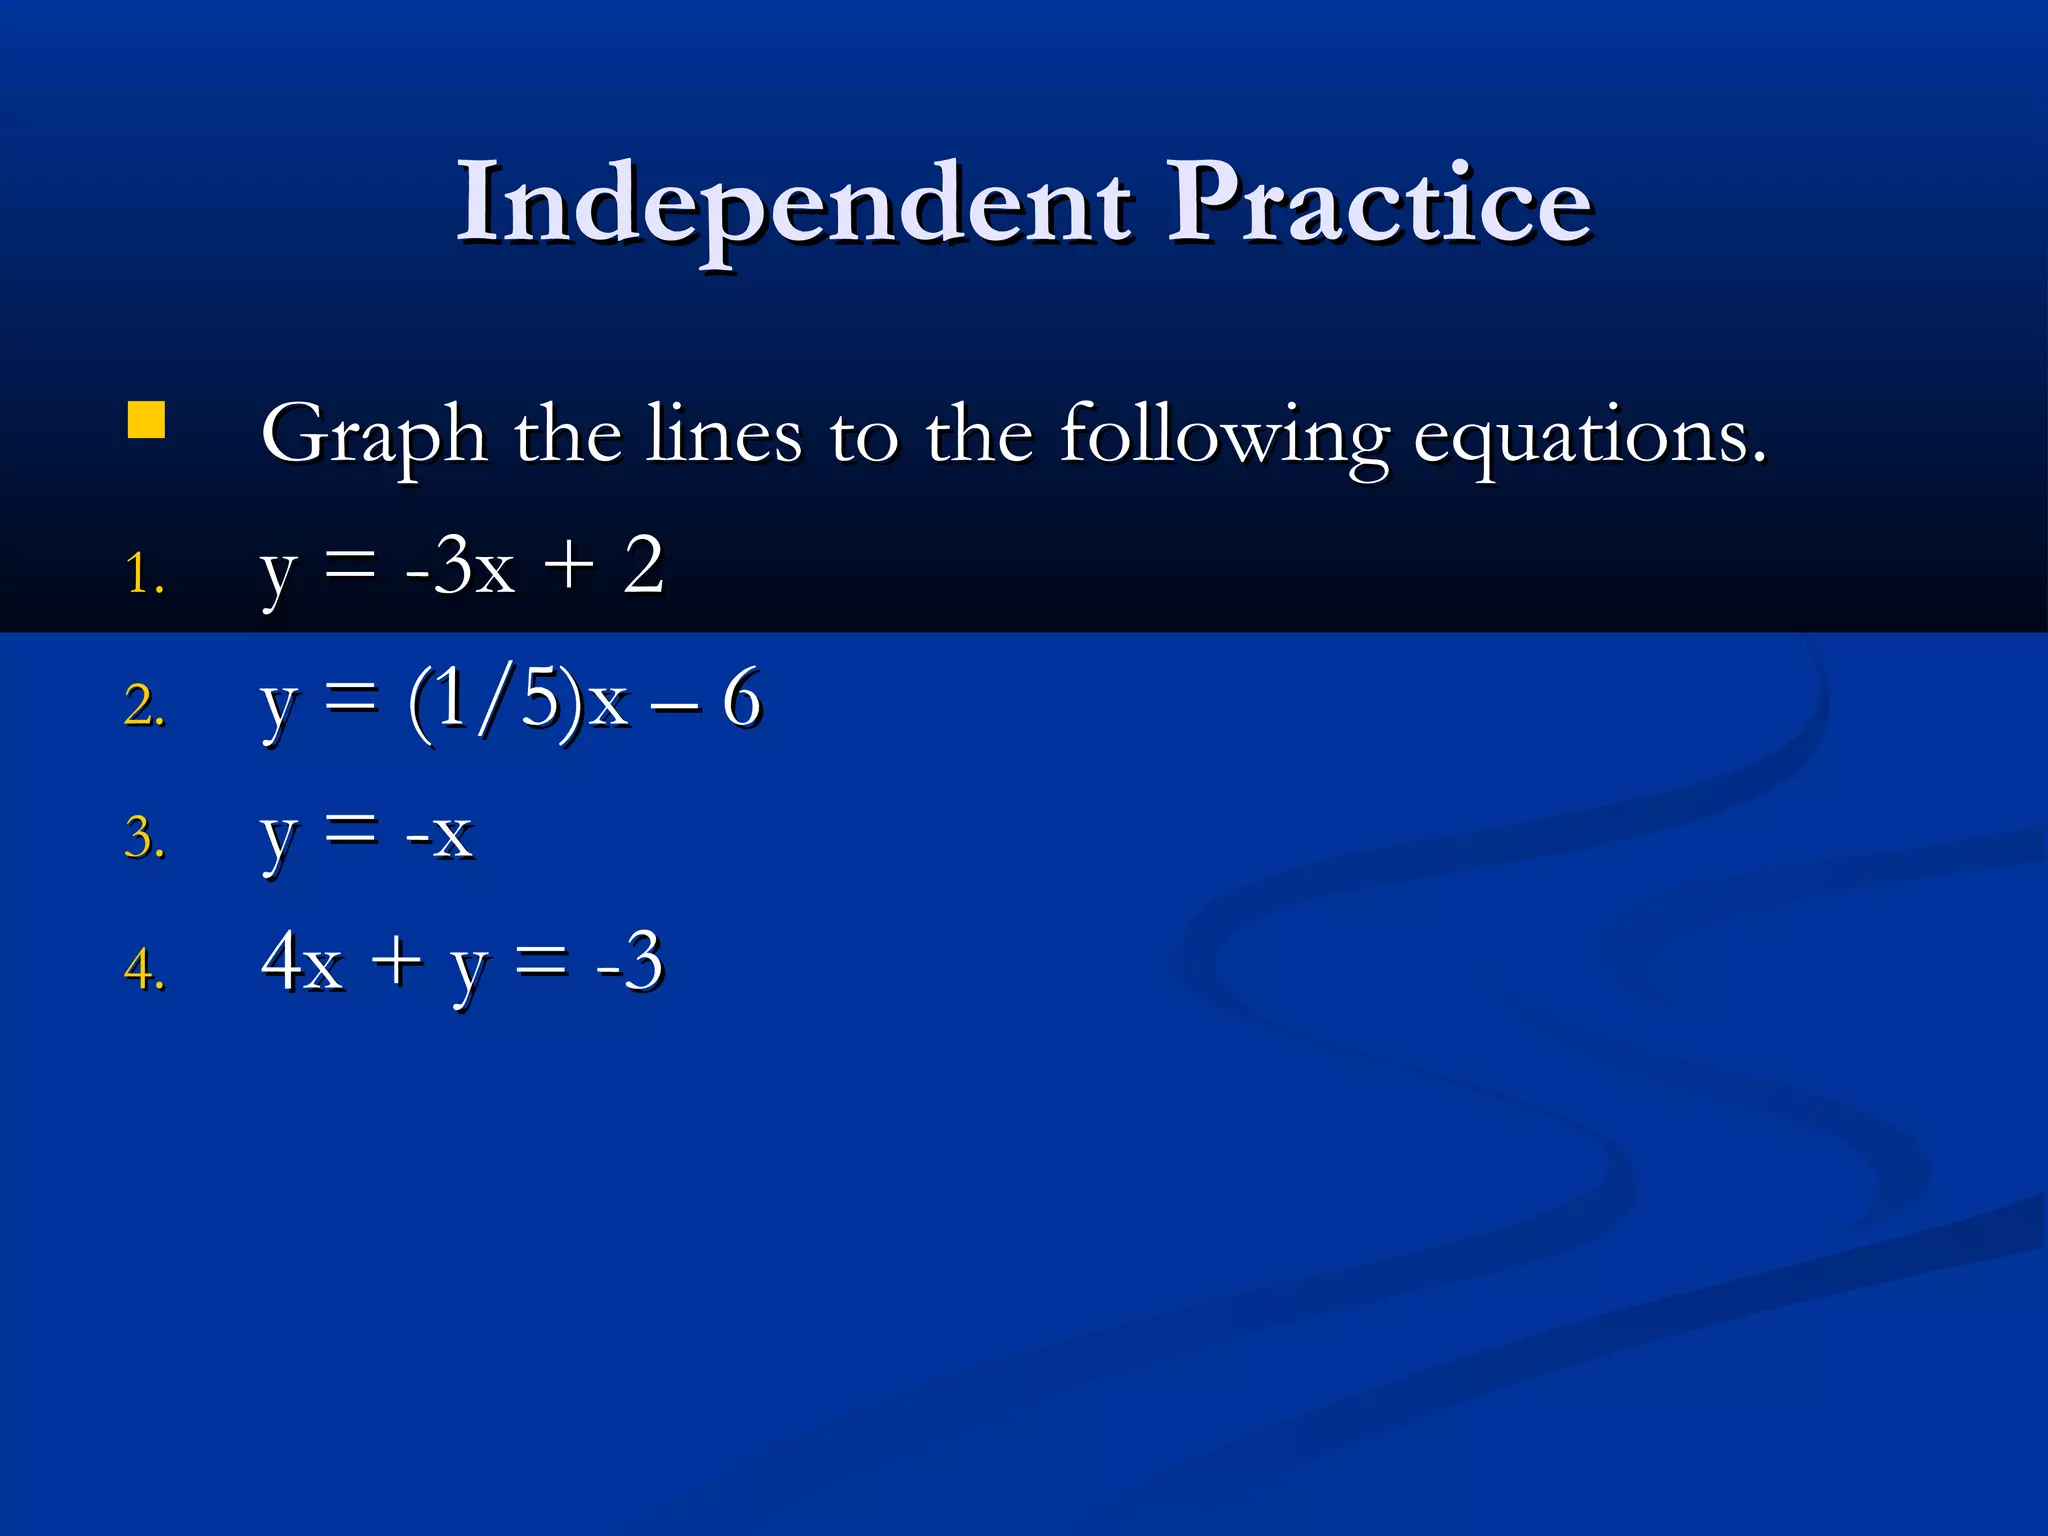
This document discusses graphing lines using the slope-intercept form equation y=mx+b. It explains that m represents the slope and b represents the y-intercept. Examples are provided to demonstrate how to graph lines by identifying m and b values and plotting points. Students are guided in graphing several lines and then assigned independent practice graphing additional lines using the slope-intercept form.


![[Question Paper] Mathematics – II (Old Course) [September / 2013]](https://cdn.slidesharecdn.com/ss_thumbnails/m-ii-qpoldcoursesep-2013-170714203203-thumbnail.jpg?width=640&height=640&fit=bounds)


![[Question Paper] Design and Analysis of Algorithms (Old Course) [September / ...](https://cdn.slidesharecdn.com/ss_thumbnails/daa-qpoldcoursesep-2013-170714203158-thumbnail.jpg?width=640&height=640&fit=bounds)


![Coded Agents – with UiPath SDK + LangGraph [Virtual Hands-on Workshop]](https://cdn.slidesharecdn.com/ss_thumbnails/codedagentsdeck-251215155422-5497c599-thumbnail.jpg?width=640&height=640&fit=bounds)


![Vibe Coding vs. Spec-Driven Development [Free Meetup]](https://cdn.slidesharecdn.com/ss_thumbnails/vibecodingvsspecdrivendevelopment-251209105622-43f455e7-thumbnail.jpg?width=640&height=640&fit=bounds)


